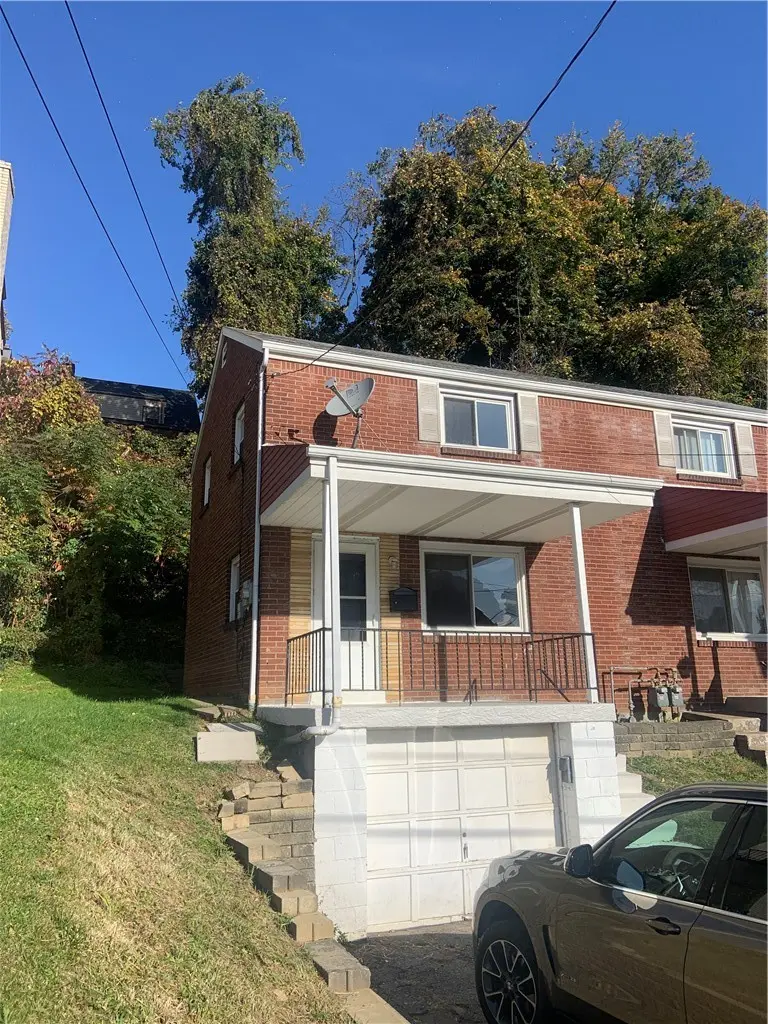
3912-3914 Meadowbrook Blvd · Brentwood, PA
Flood risk 1/10 · Minimal
- FEMA flood zone
- X (unshaded)
- Chance of flooding over 30 yrs
- 0.0%
- Est. flood insurance / yr
- $473 – $860
Fire risk 1/10 · Minimal
- Est. fire insurance / yr
- $511 – $949
Heat risk 3/10 · Minor
- Hot days now (above 96°F)
- 7 days/yr
- Hot days in 30 yrs
- 17 days/yr
Wind risk 2/10 · Minimal
- Chance of severe wind over 30 yrs
- —
Air-quality risk 3/10 · Minor
- Unhealthy air days now
- 3 days/yr
- Unhealthy air days in 30 yrs
- 5 days/yr
Risk factors via First Street. Map © Google.
Why this score? — see what drove the F grade
The composite is a weighted blend of 9 inputs, each scored 0–100. Each bar is that input's sub-score; the figure is the points it added to the 100-point composite (weight × sub-score).
- Cash flow +7.5/30.0
- ARV discount +7.5/15.0
- Livability +4.0/5.0
- Rent growth +3.6/5.0
- Schools +3.4/10.0
- Condition / age +2.5/5.0
- 1% rule +2.2/10.0
- DSCR +1.6/10.0
- Appreciation +0.0/10.0
$225,000
🖨 Deal sheet 📄 Offer letter ✓ Due diligence
Listing remarks
Side-by-Side Brick Duplex. All Separate Utilities. Great property with a lot of recent updates. Left side is vacant. Right side long term tenant in place. rent is $1110. Left side is vacant and projected rent is $1100
Key facts
- Separate utilities
- Recent updates
- Garage
Tags
Property features AI
Finance
- Financial info: Two-unit property; Gross rental income reported at $25,800; Insurance expense reported at $700; Unit rents reported at approximately $1,100 and $1,050
Exterior
- Parking: Built-in parking; Attached garage with space for 2 vehicles
- Utilities: Electricity available; Natural gas available; Public water available; Public sewer available
- Home design: Residential zoning
- Construction: Brick construction
- Exterior features: Brick exterior; Asphalt roof
Interior
- Bedrooms: Two 2-bedroom units
- Bathrooms: Each unit has 1 full bathroom
- Interior features: Public transportation access nearby
Neighborhood map
What this means for you Summary
Snapshot
- This is a 4-bed/2.0-bath single-family listed at $225k.
Deal economics
- At list price, monthly cash flow is $-279 ($-3k/yr) — negative.
- To cash-flow at today's rent, offer at most $185k (17.9% below list).
- To meet the 1% rule (rent ≥ 1% of price), the offer needs to be $162k (28.2% below list).
- Recommended offer: $162k (28.2% below list) — sets the bar for 1% rule.
Location & tenants
- Location reads 81/100 on livability (#178 in PA, #1,479 nationally) — a professional / high-income tenant draw. Strengths: schools A+, cost of living A+, housing A+; Watch: amenities C-.
- Brentwood Borough SD (suburban): math 29% / reading 50% proficiency, ranked #357 of 539 in PA (top 66%) — families likely to look elsewhere, expect single-tenant / working-renter base with shorter leases.
- Market conditions: Rents rising fast (+4.3%/yr); 117 active listings in the ZIP; 15 comparable units currently listed for rent nearby; rentals leasing fast (median 7d on market — plan ~1-2 weeks tenant-placement turnaround); solid renter incomes; 2,996 units permitted in Allegheny County in 2024 (1,588 in 5+ unit buildings).
Forward outlook
- Local home prices are declining (-3.0%/yr); year-one equity from $2k of loan paydown is wiped out by about $7k of value loss. Plan a longer hold.
Negotiation context
- Only 3 days on market — expect competitive offers; lowballing is unlikely to land.
- 4 sale attempts since 3y ago with the ask held roughly flat each time — persistent listings suggest the price (not the market) is what's stuck; bring a comps-based counter.
Risks & watch-outs
- Watch-outs: built in 1950 — expect roof / HVAC / electrical / plumbing capex.
Questions for the listing agent
- What do current leases actually rent for vs. the listed asking? Can we see a recent rent roll and the last 12 months of T-12 income?
- Built in 1950 — when were the roof, HVAC, electrical panel, plumbing, and water heater last replaced?
- Is there a deadline driving the sale (1031 exchange, divorce, estate, relocation)? That informs how much negotiation room exists.
- Schools are A-rated — typically a magnet for longer-tenancy family renters. What's the average tenant stay here, and is there a school-zone premium baked into asking?
- The area grade is low — what's the realistic commute time and amenity access for the typical tenant pool here? Any planned neighborhood developments (good or bad) we should know about?
- What's the average days-on-market for RENTAL listings here right now (not sales)? A rising rental-DOM trend means longer vacancies and softer asking-rent achievability than the comps imply.
- What's the recent tenant-quality profile in this submarket — average credit score on applications, eviction rate, late-payment / NSF rate, and stable-employment percentage? A property-management company in the area should have these aggregated.
- How much new for-sale + rental construction is in the pipeline within 1–3 miles? Heavy new supply typically softens prices + rents 12–24 months out; constrained supply supports both.
Investment metrics
- 1% rule
- 0.72% ✗
- Cap rate
- 4.81%
- Cash-on-cash
- -5.31%
- DSCR
- 0.76
- GRM
- 11.6
CMA / ARV
No comps found within radius.
Show comp detail 12 sales within ~0.75 mi
| Address | Dist | Beds/Ba | Sqft | Sold | Price | $/sf | Match |
|---|---|---|---|---|---|---|---|
| 4000 Brownsville Rd | 0.19mi | 4/2.5 | 2,592 | 1mo | $328,000 | $127 | 76 |
| 3908 Brownsville Rd | 0.14mi | 3/2.0 (-1) | 1,261 | 0mo | $225,000 | $178 | 75 |
| 4018 Meadowbrook Blvd | 0.15mi | 3/1.0 (-1) | — | 2mo | $210,000 | — | 70 |
| 4048 Cloverlea St | 0.23mi | 3/1.0 (-1) | 1,364 | 0mo | $167,500 | $123 | 68 |
| 4111 Tuxey Ave | 0.27mi | 3/1.5 (-1) | 1,424 | 1mo | $229,900 | $161 | 67 |
| 109 Burdine Ave | 0.34mi | 3/2.0 (-1) | 1,682 | 1mo | $275,000 | $163 | 66 |
| 1354 Prospect Rd | 0.47mi | 3/1.5 (-1) | 1,894 | 1mo | $365,000 | $193 | 58 |
| 4305 Clairton Blvd | 0.47mi | 3/1.5 (-1) | 1,732 | 1mo | $127,500 | $74 | 57 |
| 3613 Kaufmann Ave | 0.44mi | 3/1.0 (-1) | 1,134 | 2mo | $162,000 | $143 | 57 |
| 3512 Dauphin Ave | 0.52mi | 3/1.5 (-1) | 1,596 | 1mo | $64,900 | $41 | 55 |
| 4355 E Barlind Dr | 0.63mi | 3/2.0 (-1) | 1,224 | 2mo | $257,500 | $210 | 52 |
| 4923 Leona Dr | 0.70mi | 3/1.0 (-1) | 1,046 | 1mo | $204,000 | $195 | 45 |
Match score weights: distance 35% · size 25% · config 20% · recency 20%. Top-matched comps best support the ARV.
Projected returns pro-forma
-3.0% appreciation · 4.33% rent growth · sell at horizon
- IRR
- -23.9%
- Equity multiple
- 0.17×
- Total profit
- $-51,988
- Equity at exit
- $33,548
- IRR
- -15.7%
- Equity multiple
- 0.07×
- Total profit
- $-58,783
- Equity at exit
- $19,454
Cash invested: $63,000 (down + closing). Projections, not guarantees.
Landlord ↔ Tenant lean methodology
- Overall (STATE)
- 62 Landlord-Friendly
- State Pennsylvania
- 62 Landlord-Friendly · EVEN
- County
- — inherits STATE
- City
- — inherits STATE
ZIP-level market 15227
- Home prices YoY
- -27.5%
- Rents YoY
- 4.3%
- Active inventory
- 117
- Price-to-rent
- 11.6×
Monthly cashflow live
- Estimated rent
- $1,616 high interval (Pro) →
- Mortgage (P&I)
- −$1,180
- Tax est. 1.5%
- −$281 /mo · $3,375/yr
- Insurance
- −$94
- HOA
- −$0
- Vacancy / Maint / Mgmt
- −$339
- Net cashflow
- $-279
Break-even live
UW: 25.0% down · 7.5% · 30yr · 1.5% tax · 5.0% vac · 8.0% maint · 8.0% mgmt
Financing live
Cash to close
- Down payment
- $56,250
- Closing costs
- $6,750
- Reserves months
- —
- Total cash needed
- —
Loan-product check · same deal, 3 products live
Conventional
25% down · 7.5% · 30yr
- Down + closing
- —
- Monthly P&I
- —
- Monthly cashflow
- —
- DSCR
- —
- Eligible?
- —
Personal DTI + credit; lowest rate.
DSCR
20% down · 8.5% · 30yr
- Down + closing
- —
- Monthly P&I
- —
- Monthly cashflow
- —
- DSCR
- —
- Eligible?
- —
No personal income docs; deal must DSCR.
Hard money
10% down · 12.0% · 12mo
- Down + closing
- —
- Monthly P&I
- —
- Monthly cashflow
- —
- DSCR
- —
- Eligible?
- —
Short-term bridge; refi at stabilization.
Rent comps 15 comps
| Address | Beds | Baths | Sqft | Rent | $/sqft | DOM | Units | Dist |
|---|---|---|---|---|---|---|---|---|
| 4588 E Willock Rd Pittsburgh, PA | 3.0 | 1.5 | 1500 | $1,500 | $1.00 | 4d | 1 | 0.23mi |
| 1526 Parkline Dr Pittsburgh, PA | 3.0 | 1.0 | 942 | $1,475 | $1.56 | 7d | 44 | 0.49mi |
| 3367 Jameson Dr Brentwood, PA | 2.0–3.0 | 1.0 | 975 | $1,435 | $1.47 | 7d | 7 | 0.62mi |
| 453 Greenlee Rd Pittsburgh, PA | 3.0 | 1.0 | 1176 | $1,495 | $1.27 | 43d | 1 | 0.70mi |
| 206 E Garden Rd Pittsburgh, PA | 3.0 | 1.0 | — | $1,450 | — | 10d | 1 | 0.72mi |
| 139 W Bellecrest Ave Brentwood, PA | 1.0–3.0 | 1.0 | 775 | $1,450 | $1.87 | 2d | 12 | 0.80mi |
| 111 Kaplan Ave Unit 2 Brentwood, PA | 3.0 | 1.0 | — | $1,350 | — | 7d | 1 | 0.88mi |
| 2823 Clermont Ave Pittsburgh, PA | 3.0 | 1.0 | 1354 | $1,490 | $1.10 | 20d | 1 | 1.13mi |
| 2940 Brevard Ave Pittsburgh, PA | 3.0 | 1.5 | 1176 | $1,475 | $1.25 | 43d | 1 | 1.22mi |
| 2721 Pyramid Ave Pittsburgh, PA | 3.0 | 1.0 | 1560 | $1,550 | $0.99 | 7d | 1 | 1.23mi |
| 3341 Recker Dr Pittsburgh, PA | 3.0 | 2.0 | 1174 | $1,750 | $1.49 | 23d | 1 | 1.24mi |
| 3341 Recker Dr Pittsburgh, PA | 3.0 | 2.0 | 875 | $1,790 | $2.05 | 43d | 1 | 1.24mi |
| 2900 Willett Rd Unit 1 Pittsburgh, PA | 3.0 | 2.0 | — | $1,450 | — | 43d | 1 | 1.25mi |
| 3812 Louisa St Pittsburgh, PA | 3.0 | 1.5 | — | $1,995 | — | 7d | 1 | 1.45mi |
| 103 Paddock Ln Pittsburgh, PA | 3.0 | 2.0 | 2100 | $2,299 | $1.09 | 2d | 1 | 1.49mi |
Listing history 5 events
-
2026-06-18days on market $225,000 Active 3 DOM
-
2026-06-17remarks 217-char remark
-
2026-06-17days on market $225,000 Active 2 DOM
-
2026-06-16remarks 153-char remark
-
2026-06-16$225,000 Active 1 DOM
ⓘ Source: listings_history table (triggers on properties + properties_extension) + one-shot
backfill from property_details.listing_events for pre-trigger history.
Climate risk First Street
- Flood 1/10 Low FEMA zone X (unshaded) · 0% chance over 30 yrs
- Wildfire 1/10 Low
- Heat 3/10 Moderate 7 d/yr ≥96°F today · 17 d/yr by 30 yrs out
- Wind 2/10 Low
- Air quality 3/10 Moderate 3 unhealthy d/yr today · 5 by 30 yrs out
Nearby sold comps map
Loading sold comps map…
Walkable amenities ~0.75 mi
Loading nearby amenities…
Taxation est. · year 1
- Rental income
- $19,387
- − Mortgage interest
- −$12,603
- − Property taxes
- −$3,375
- − Insurance
- −$1,125
- − Repairs & maintenance
- −$1,551
- − Management
- −$1,551
- − Depreciation
- −$6,545
- Taxable loss
- −$7,364
- Est. tax savings @ 24.0%
- +$1,767
- After-tax cash flow
- $-1,576/yr
For passive investors: Depreciation is non-cash, so a rental often shows a tax loss while cash-flowing — sheltering income. Rental losses are passive: they offset passive income freely, and up to $25,000/yr can offset ordinary (W-2) income if you actively participate and your MAGI is under $100k (phasing out to $0 by $150k); unused losses carry forward. On sale, claimed depreciation is recaptured at up to 25%, and gains may owe capital-gains tax (a 1031 exchange can defer both). Figures are a year-1 estimate at your 24.0% rate — not tax advice; consult a CPA.
Schools (NCES district)
- District
- Brentwood Borough SD
- NCES district ID
- 4204140
- Math proficiency
- 29% ▼ -15.00%
- Reading proficiency
- 50% ▼ -15.00%
- Median HH income
- $49,260
- Composite
- 33.92/100
- National rank
- #5341
- State rank
- #357 of 539 in PA
Livability — Brentwood
- Score
- 81/100
- State rank
- #178
- US rank
- #1479
Category grades
Schools grade is shown separately in the Schools card above.
Census & demographics
- Census place
- Brentwood, PA
- County
- Allegheny County · 1,022,028 people
- City population
- 28,460
- Metro
- Pittsburgh, PA
- Population (ZIP)
- 28,460
- Household income
- $75,448
- Rent vs Own
- Severe rent burden
- 780.0
Population outlook (Allegheny County) Hauer SSP2
- Today (2025)
- 1,250,282 people
- By 2030
- 1,256,482 · +0.5%
- By 2040
- 1,256,318 · +0.5%
- By 2050
- 1,244,169 · -0.5%
- By 2075
- 1,197,693 · -4.2%
- By 2100
- 1,093,187 · -12.6%
Race, ethnicity, and origin ACS 2023
- Neighborhood character
- Predominantly White (80%)
- Race & ethnicity
- White 80% Black 7% Asian 6% Two or more races 5% Hispanic / Latino 1%
- Common ancestry
- Romanian 9% Scotch-Irish 2% Slovak 1%
- Foreign-born
- 9% · India, Canada, China
- Languages at home
- 89% English-only · Other Indo-European 6% Other Asian/Pacific 1% French/Haitian/Cajun 1%
Political lean MEDSL · Allegheny
- 2024 margin
- Strong D (+20.3) · D 59.7% · R 39.4%
- 2008→2024 swing
- +4.8pp toward D · 2008: 15.5pp · 2024: 20.3pp
- All cycles
- 2024: D+20.3 2020: D+20.4 2016: D+16.4 2012: D+14.4 2008: D+15.5
Not yet ingested
- Civics
- —
Market trends
- HPI YoY
- ▼ -92.53%
- Current HPI
- 243.6383
- Rent YoY
- ▲ 4.33%
- Metro
- Pittsburgh, PA
- State GDP YoY
- ▲ 1.68%
- F500 in state
- 34
Industry mix (Fortune 500 HQ in PA)
| Industry | F500 HQs | Revenue |
|---|---|---|
| Healthcare | 2 | $309B |
|
||
| Insurance | 2 | $27B |
|
||
| Telecommunications / Media | 1 | $124B |
|
||
| Industrial Distribution | 1 | $22B |
|
||
| Financial Services | 1 | $20B |
|
||
| Chemicals / Materials | 1 | $18B |
|
||
Price history
+22400.0% since first listed7 events — show timeline
- 2026-06-15 Listed $225,000 West Penn MLS
- 2026-05-20 Listed for Rent $1,100 RENTALBEAST
- 2024-03-09 Rental Removed $900 WPMLS
- 2024-02-24 Listed for Rent $900 WPMLS
- 2024-02-06 Rental Removed $950 WPMLS
- 2024-01-31 Price Changed $950 WPMLS
- 2023-10-21 Listed for Rent $1,000 WPMLS
Cash-flow waterfall
monthlySold comps — $/sqft
last 12 mo · ≤1 miLoading sold comps…