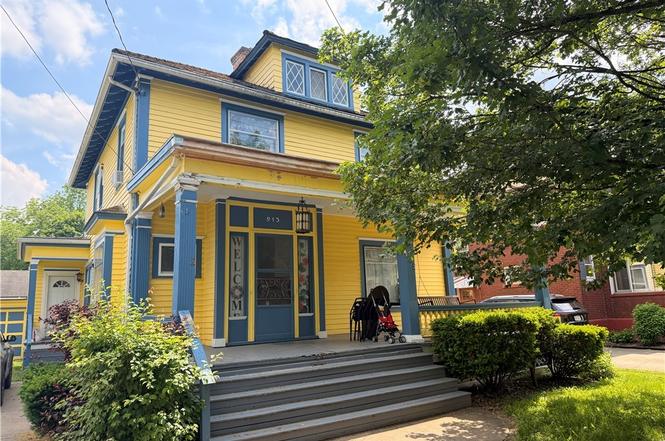
913 Washington St · Olean, NY
Flood risk 5/10 · Moderate
- FEMA flood zone
- X (shaded)
- Chance of flooding over 30 yrs
- 0.24%
- Est. flood insurance / yr
- $473 – $860
Fire risk 3/10 · Minor
- Est. fire insurance / yr
- $691 – $1,283
Heat risk 2/10 · Minimal
- Hot days now (above 90°F)
- 8 days/yr
- Hot days in 30 yrs
- 19 days/yr
Wind risk 1/10 · Minimal
- Chance of severe wind over 30 yrs
- —
Air-quality risk 1/10 · Minimal
- Unhealthy air days now
- 0 days/yr
- Unhealthy air days in 30 yrs
- 0 days/yr
Risk factors via First Street. Map © Google.
Why this score? — see what drove the B- grade
The composite is a weighted blend of 9 inputs, each scored 0–100. Each bar is that input's sub-score; the figure is the points it added to the 100-point composite (weight × sub-score).
- Cash flow +25.0/30.0
- ARV discount +15.0/15.0
- DSCR +8.1/10.0
- 1% rule +7.3/10.0
- Livability +3.6/5.0
- Schools +3.5/10.0
- Rent growth +2.5/5.0
- Condition / age +2.5/5.0
- Appreciation +0.0/10.0
$119,900
🖨 Deal sheet 📄 Offer letter ✓ Due diligence
Listing remarks
Located in Olean, this 4 bed, 2 bath century-old home offers 1,728 sq ft of space. Highlights include a 1- car detached garage and a full unfinished basement for storage. The property features a classic boiler system with a furnace updated in 2010.
Key facts
- Furnace updated
- Detached garage
- 4,503 sq ft lot
Tags
Property features AI
Exterior
- Parking: Detached garage; 1 garage space
- Utilities: Water available (public listed; also noted as not connected); Septic tank sewer
- Home design: Two-story residence; Existing/resale property
- Construction: Shingle roof; Construction details: see remarks; Partial basement
- Exterior features: Stamped concrete driveway; Rectangular residential lot (approx. 46 x 97)
Interior
- Kitchen: Pantry (kitchen storage indicated)
- Bedrooms: Total rooms include other room types (4 total rooms); Basement level present (partial basement)
- Flooring: Vinyl flooring; Varies by room
- Bathrooms: 2 full bathrooms (both on the main level)
- Heating & cooling: Heating details: see remarks
- Interior features: Pantry; See remarks / additional features; Varied flooring
Neighborhood map
What this means for you Summary
Snapshot
- This is a 4-bed/1.5-bath single-family listed at $120k.
Deal economics
- At list price, monthly cash flow is $260 ($3k/yr) — positive.
- The deal already cash-flows at list — no discount required.
- Meets the 1% rule at list price ($1k rent vs $120k).
Location & tenants
- Location reads 72/100 on livability (#353 in NY) — a middle-class / working-renter tenant base. Strengths: cost of living A+, housing A+, health & safety A+; Watch: crime F, amenities F, commute F.
- Olean City School District (town): math 40% / reading 43% proficiency, ranked #511 of 590 in NY (top 87%) — families likely to look elsewhere, expect single-tenant / working-renter base with shorter leases.
- Market conditions: 141 active listings in the ZIP; 128 units permitted in Cattaraugus County in 2024 (21 in 5+ unit buildings).
Forward outlook
- Local home prices are declining (-3.0%/yr); year-one equity from $829 of loan paydown is wiped out by about $4k of value loss. Plan a longer hold.
- Cattaraugus County population projected at -28% by 2050 — secular population decline; favor cash flow + early exit over multi-decade hold.
Negotiation context
- Only 1 days on market — expect competitive offers; lowballing is unlikely to land.
- Current owner paid $70k; list at $120k implies a 71% gain — meaningful room to come down on a strong offer.
Risks & watch-outs
- Watch-outs: built in 1940 — expect roof / HVAC / electrical / plumbing capex.
- Climate carrying-cost: moderate flood risk — expect insurance premiums to compound above CPI over the hold.
Questions for the listing agent
- Built in 1940 — when were the roof, HVAC, electrical panel, plumbing, and water heater last replaced?
- Is there a deadline driving the sale (1031 exchange, divorce, estate, relocation)? That informs how much negotiation room exists.
- Schools are B-rated — typically a magnet for longer-tenancy family renters. What's the average tenant stay here, and is there a school-zone premium baked into asking?
- Crime grade is F in this area — have there been break-ins, vandalism, or insurance claims at this property in the last 3 years? What carrier currently insures it and at what premium?
- What's the average days-on-market for RENTAL listings here right now (not sales)? A rising rental-DOM trend means longer vacancies and softer asking-rent achievability than the comps imply.
- What's the recent tenant-quality profile in this submarket — average credit score on applications, eviction rate, late-payment / NSF rate, and stable-employment percentage? A property-management company in the area should have these aggregated.
- How much new for-sale + rental construction is in the pipeline within 1–3 miles? Heavy new supply typically softens prices + rents 12–24 months out; constrained supply supports both.
Investment metrics
- 1% rule
- 1.23% ✓
- Cap rate
- 8.90%
- Cash-on-cash
- 9.31%
- DSCR
- 1.41
- GRM
- 6.8
CMA / ARV
- ARV (on-the-fly)
- $165,888
- Comps found
- 12
Show comp detail 12 sales within ~0.75 mi
| Address | Dist | Beds/Ba | Sqft | Sold | Price | $/sf | Match |
|---|---|---|---|---|---|---|---|
| 1013 W Sullivan St | 0.11mi | 5/1.5 (+1) | 1,713 (-1%) | 1mo | $164,300 | $96 | 88 |
| 126 N 8th St | 0.08mi | 3/1.5 (-1) | 1,552 (-10%) | 9mo | $144,000 | $93 | 67 |
| 223 S 7th St | 0.36mi | 3/1.5 (-1) | 1,786 (+3%) | 7mo | $144,000 | $81 | 67 |
| 216 N 14th St | 0.33mi | 3/1.5 (-1) | 1,516 (-12%) | 3mo | $143,000 | $94 | 57 |
| 215 South Second St | 0.54mi | 4/2.0 | 1,880 (+9%) | 4mo | $32,500 | $17 | 55 |
| 133 N 13th St | 0.29mi | 3/2.0 (-1) | 1,496 (-13%) | 6mo | $149,900 | $100 | 52 |
| 133 N 15th St | 0.41mi | 3/1.5 (-1) | 1,554 (-10%) | 9mo | $180,000 | $116 | 52 |
| 221 N 19th St | 0.64mi | 4/1.0 | 1,578 (-9%) | 6mo | $182,320 | $116 | 49 |
| 207 N Clinton St | 0.69mi | 3/1.5 (-1) | 1,816 (+5%) | 6mo | $117,500 | $65 | 49 |
| 106 S 14th St | 0.40mi | 5/2.0 (+1) | 1,980 (+15%) | 5mo | $212,500 | $107 | 46 |
| 315 N 18th St | 0.61mi | 3/2.0 (-1) | 1,577 (-9%) | 7mo | $180,000 | $114 | 44 |
| 2005 W State St | 0.66mi | 3/1.0 (-1) | 1,504 (-13%) | 5mo | $115,000 | $76 | 36 |
Match score weights: distance 35% · size 25% · config 20% · recency 20%. Top-matched comps best support the ARV.
Projected returns pro-forma
-3.0% appreciation · 3.0% rent growth · sell at horizon
- IRR
- -2.2%
- Equity multiple
- 0.92×
- Total profit
- $-2,772
- Equity at exit
- $17,877
- IRR
- 7.6%
- Equity multiple
- 1.57×
- Total profit
- $19,228
- Equity at exit
- $10,367
Cash invested: $33,572 (down + closing). Projections, not guarantees.
Landlord ↔ Tenant lean methodology
- Overall (STATE)
- 15 Strongly Tenant-Friendly
- State New York
- 15 Strongly Tenant-Friendly · D+10
- County
- — inherits STATE
- City
- — inherits STATE
ZIP-level market 14760
- Home prices YoY
- -7.7%
- Active inventory
- 141
- Price-to-rent
- 6.8×
Monthly cashflow live
- Estimated rent
- $1,476 medium interval (Pro) →
- Mortgage (P&I)
- −$629
- Tax from tax record
- −$227 /mo · $2,725/yr
- Insurance
- −$50
- HOA
- −$0
- Vacancy / Maint / Mgmt
- −$310
- Net cashflow
- $260
Break-even live
UW: 25.0% down · 7.5% · 30yr · 1.5% tax · 5.0% vac · 8.0% maint · 8.0% mgmt
Financing live
Cash to close
- Down payment
- $29,975
- Closing costs
- $3,597
- Reserves months
- —
- Total cash needed
- —
Loan-product check · same deal, 3 products live
Conventional
25% down · 7.5% · 30yr
- Down + closing
- —
- Monthly P&I
- —
- Monthly cashflow
- —
- DSCR
- —
- Eligible?
- —
Personal DTI + credit; lowest rate.
DSCR
20% down · 8.5% · 30yr
- Down + closing
- —
- Monthly P&I
- —
- Monthly cashflow
- —
- DSCR
- —
- Eligible?
- —
No personal income docs; deal must DSCR.
Hard money
10% down · 12.0% · 12mo
- Down + closing
- —
- Monthly P&I
- —
- Monthly cashflow
- —
- DSCR
- —
- Eligible?
- —
Short-term bridge; refi at stabilization.
Listing history 2 events
-
2026-06-17remarks 250-char remark
-
2026-06-17$119,900 Active 1 DOM
ⓘ Source: listings_history table (triggers on properties + properties_extension) + one-shot
backfill from property_details.listing_events for pre-trigger history.
Tax reassessment forecast NY · Partial reset (capped growth)
- Current annual tax
- $2,725 · $227/mo
- Projected year-2 tax
- $2,725 · $227/mo
- Expected delta
- $0/yr ($0/mo · 0.0%)
ⓘ Screening estimate from a state-policy table — verify with the county assessor before closing.
Climate risk First Street
- Flood 5/10 Major FEMA zone X (shaded) · 24% chance over 30 yrs
- Wildfire 3/10 Moderate
- Heat 2/10 Low 8 d/yr ≥90°F today · 19 d/yr by 30 yrs out
- Wind 1/10 Low
- Air quality 1/10 Low 0 unhealthy d/yr today · 0 by 30 yrs out
Nearby sold comps map
Loading sold comps map…
Walkable amenities ~0.75 mi
Loading nearby amenities…
Taxation est. · year 1
- Rental income
- $17,715
- − Mortgage interest
- −$6,716
- − Property taxes
- −$2,725
- − Insurance
- −$600
- − Repairs & maintenance
- −$1,417
- − Management
- −$1,417
- − Depreciation
- −$3,488
- Taxable income
- $1,352
- Est. tax owed @ 24.0%
- −$324
- After-tax cash flow
- $2,801/yr
For passive investors: Depreciation is non-cash, so a rental often shows a tax loss while cash-flowing — sheltering income. Rental losses are passive: they offset passive income freely, and up to $25,000/yr can offset ordinary (W-2) income if you actively participate and your MAGI is under $100k (phasing out to $0 by $150k); unused losses carry forward. On sale, claimed depreciation is recaptured at up to 25%, and gains may owe capital-gains tax (a 1031 exchange can defer both). Figures are a year-1 estimate at your 24.0% rate — not tax advice; consult a CPA.
Schools (NCES district)
- District
- Olean City School District
- NCES district ID
- 3621720
- Math proficiency
- 40% ▼ -10.00%
- Reading proficiency
- 43% ▼ -3.00%
- Median HH income
- $40,365
- Composite
- 34.81/100
- National rank
- #5104
- State rank
- #511 of 590 in NY
Livability — Olean
- Score
- 72/100
- State rank
- #353
- US rank
- #5930
Category grades
Schools grade is shown separately in the Schools card above.
Census & demographics
- Census place
- Olean, NY
- City population
- 17,272
- Population (ZIP)
- 17,272
Population outlook (Cattaraugus County) Hauer SSP2
- Today (2025)
- 71,623 people
- By 2030
- 67,751 · -5.4%
- By 2040
- 59,488 · -16.9%
- By 2050
- 51,601 · -28.0%
- By 2075
- 35,025 · -51.1%
- By 2100
- 21,243 · -70.3%
Race, ethnicity, and origin ACS 2023
- Neighborhood character
- Predominantly White (89%)
- Race & ethnicity
- White 89% Two or more races 5% Black 2% Asian 2% Hispanic / Latino 1%
- Common ancestry
- Romanian 10% Iranian 2% Lithuanian 1%
- Foreign-born
- 3% · Canada
- Languages at home
- 97% English-only · Other Indo-European 1%
Political lean MEDSL · Cattaraugus
- 2024 margin
- Solid R (+32.8) · D 33.6% · R 66.4%
- 2008→2024 swing
- -22.2pp toward R · 2008: -10.6pp · 2024: -32.8pp
- All cycles
- 2024: R+32.8 2020: R+29.5 2016: R+34.4 2012: R+13.4 2008: R+10.6
Not yet ingested
- Civics
- —
Market trends
- HPI YoY
- ▼ -19.85%
- Current HPI
- 237.327
- Rent YoY
- —
- Metro
- —
- State GDP YoY
- ▲ 2.60%
- F500 in state
- 92
Industry mix (Fortune 500 HQ in NY)
| Industry | F500 HQs | Revenue |
|---|---|---|
| Financial Services | 10 | $950B |
|
||
| Consumer Goods | 9 | $162B |
|
||
| Insurance | 4 | $225B |
|
||
| Telecommunications | 2 | $144B |
|
||
| Pharmaceuticals | 2 | $112B |
|
||
| Media / Entertainment | 2 | $69B |
|
||
Price history
+31.2% since first listed5 events — show timeline
- 2026-06-17 Listed $119,900 WNYREIS
- 2024-06-24 Sold (Public Records) $70,000 Public Records
- 2009-12-03 Sold (Public Records) $65,000 Public Records
- 2004-01-06 Sold (Public Records) $97,000 Public Records
- 2002-07-09 Sold (Public Records) $91,400 Public Records
Property tax history
+2.8%/yrLatest (2025): $2,725 · -38.9% YoY. Source: county tax records.
Cash-flow waterfall
monthlySold comps — $/sqft
last 12 mo · ≤1 miLoading sold comps…