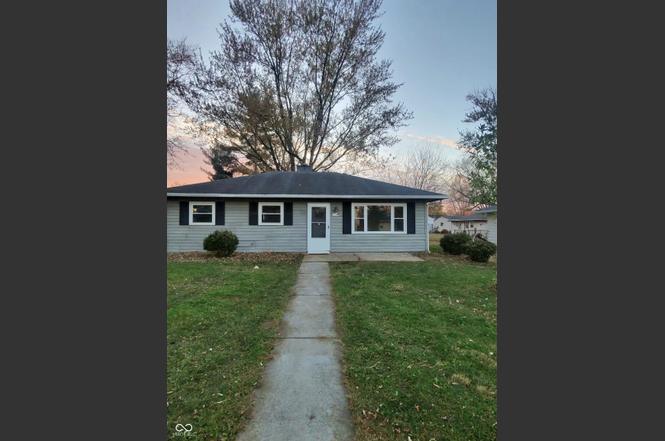
1503 Payton St · Crawfordsville, IN
Flood risk 1/10 · Minimal
- FEMA flood zone
- X (unshaded)
- Chance of flooding over 30 yrs
- 0.0%
- Est. flood insurance / yr
- $507 – $1,088
Fire risk 1/10 · Minimal
- Est. fire insurance / yr
- $717 – $1,331
Heat risk 3/10 · Minor
- Hot days now (above 101°F)
- 7 days/yr
- Hot days in 30 yrs
- 18 days/yr
Wind risk 2/10 · Minimal
- Chance of severe wind over 30 yrs
- 1.0%
Air-quality risk 2/10 · Minimal
- Unhealthy air days now
- 1 days/yr
- Unhealthy air days in 30 yrs
- 2 days/yr
Risk factors via First Street. Map © Google.
Why this score? — see what drove the C grade
The composite is a weighted blend of 9 inputs, each scored 0–100. Each bar is that input's sub-score; the figure is the points it added to the 100-point composite (weight × sub-score).
- Cash flow +21.2/30.0
- ARV discount +13.2/15.0
- DSCR +6.8/10.0
- 1% rule +4.4/10.0
- Livability +3.6/5.0
- Rent growth +3.3/5.0
- Schools +2.5/10.0
- Condition / age +2.5/5.0
- Appreciation +0.0/10.0
$139,700
🖨 Deal sheet 📄 Offer letter ✓ Due diligence
Listing remarks
Welcome to this beautifully updated single-level home featuring 3 bedrooms and 1 full bath, perfectly situated in one of Crawfordsville's desirable neighborhoods. Located within the Crawfordsville Community School Corporation, this home offers convenient access to local parks, recreation facilities, and community amenities. Step inside to enjoy a fresh, newly remodeled interior with modern finishes throughout that include new flooring, new kitchen cabinets, new stainless-steel appliances, new bathroom fixtures, and fresh paint throughout the home. The home sits on a spacious lot with a fully fenced backyard, ideal for children, pets, and outdoor entertaining. Whether you're a first-time hom
Key facts
- Community amenities
- New kitchen cabinets
- 7,536 sq ft lot
Tags
Neighborhood map
What this means for you Summary
Snapshot
- This is a 3-bed/1.0-bath single-family listed at $140k.
Deal economics
- At list price, monthly cash flow is $202 ($2k/yr) — positive.
- The deal already cash-flows at list — no discount required.
- To meet the 1% rule (rent ≥ 1% of price), the offer needs to be $131k (6.4% below list).
- Recommended offer: $131k (6.4% below list) — sets the bar for 1% rule.
- Cap rate 8.0% vs local median 3.5% in Crawfordsville — top-decile yield for the area; either an underpriced asset or a hidden risk that comps aren't pricing in. Stress-test before assuming the spread holds.
Location & tenants
- Location reads 72/100 on livability (#118 in IN) — a middle-class / working-renter tenant base. Strengths: cost of living A+, housing A+, crime A; Watch: commute D+, amenities F, employment D-.
- Crawfordsville Community Schools (town): math 27% / reading 32% proficiency, ranked #247 of 301 in IN (top 82%) — low school quality limits family demand, transient renter base, plan for 1-2y turnover.
- Zoned schools: Laura Hose Elementary School (384 students, 68% FRL).
- Market conditions: Rents rising (+3.3%/yr); 203 active listings in the ZIP; 1 comparable units currently listed for rent nearby; 52 units permitted in Montgomery County in 2024 (0 in 5+ unit buildings).
Forward outlook
- Local home prices are declining (-3.0%/yr); year-one equity from $966 of loan paydown is wiped out by about $4k of value loss. Plan a longer hold.
- Montgomery County population projected to shrink 9% by 2050 — rents likely to lag national; underwrite the cash flow, not the appreciation.
Negotiation context
- It's been on market 39 days — a 3% lower offer ($136k) is reasonable based on typical stale-listing flexibility.
- 2 sale attempts; this cycle's ask has dropped $9k (6%) from the opening price — seller is motivated, your offer sets the floor, not the list.
Risks & watch-outs
- Watch-outs: built in 1955 — expect roof / HVAC / electrical / plumbing capex.
Questions for the listing agent
- It's been on market 39 days. Have you received any prior offers? Is the seller open to a 6% concession, seller financing, or rate buy-down credit?
- Built in 1955 — when were the roof, HVAC, electrical panel, plumbing, and water heater last replaced?
- Is there a deadline driving the sale (1031 exchange, divorce, estate, relocation)? That informs how much negotiation room exists.
- Schools are D-rated, which usually means shorter tenancies and higher turnover. Who's the typical renter profile here, and what's been the actual vacancy rate?
- What's the average days-on-market for RENTAL listings here right now (not sales)? A rising rental-DOM trend means longer vacancies and softer asking-rent achievability than the comps imply.
- What's the recent tenant-quality profile in this submarket — average credit score on applications, eviction rate, late-payment / NSF rate, and stable-employment percentage? A property-management company in the area should have these aggregated.
- How much new for-sale + rental construction is in the pipeline within 1–3 miles? Heavy new supply typically softens prices + rents 12–24 months out; constrained supply supports both.
Investment metrics
- 1% rule
- 0.94% ✗
- Cap rate
- 8.03%
- Cash-on-cash
- 6.19%
- DSCR
- 1.28
- GRM
- 8.9
CMA / ARV
- ARV (on-the-fly)
- $159,840
- Comps found
- 12
Show comp detail 12 sales within ~0.75 mi
| Address | Dist | Beds/Ba | Sqft | Sold | Price | $/sf | Match |
|---|---|---|---|---|---|---|---|
| 1509 Edgewood Dr | 0.05mi | 3/1.0 | 864 (0%) | 12mo | $149,000 | $172 | 87 |
| 1402 Edgewood Dr | 0.09mi | 3/1.0 | 864 (0%) | 13mo | $160,000 | $185 | 85 |
| 1001 Ray St | 0.16mi | 2/1.0 (-1) | 880 (+2%) | 2mo | $170,000 | $193 | 83 |
| 1125 Mill St | 0.33mi | 3/1.0 | 891 (+3%) | 3mo | $165,000 | $185 | 77 |
| 906 Ray St | 0.21mi | 2/1.0 (-1) | 832 (-4%) | 3mo | $150,000 | $180 | 76 |
| 1204 Ladoga Rd | 0.14mi | 3/1.0 | 816 (-6%) | 10mo | $155,000 | $190 | 76 |
| 1404 Payton St | 0.05mi | 2/2.0 (-1) | 925 (+7%) | 6mo | $158,000 | $171 | 72 |
| 1704 Athens St | 0.15mi | 3/1.0 | 912 (+6%) | 15mo | $180,000 | $197 | 71 |
| 1404 Edgewood Dr | 0.09mi | 3/1.0 | 925 (+7%) | 18mo | $150,000 | $162 | 69 |
| 1511 Southside Dr | 0.44mi | 3/1.0 | 960 (+11%) | 2mo | $181,000 | $189 | 59 |
| 414 Hughes St | 0.53mi | 3/1.5 | 960 (+11%) | 1mo | $65,000 | $68 | 54 |
| 910 Tuttle Ave | 0.75mi | 3/1.0 | 770 (-11%) | 16mo | $115,000 | $149 | 34 |
Match score weights: distance 35% · size 25% · config 20% · recency 20%. Top-matched comps best support the ARV.
Projected returns pro-forma
-3.0% appreciation · 3.28% rent growth · sell at horizon
- IRR
- -6.5%
- Equity multiple
- 0.76×
- Total profit
- $-9,476
- Equity at exit
- $20,830
- IRR
- 3.4%
- Equity multiple
- 1.24×
- Total profit
- $9,571
- Equity at exit
- $12,079
Cash invested: $39,116 (down + closing). Projections, not guarantees.
Landlord ↔ Tenant lean methodology
- Overall (STATE)
- 90 Strongly Landlord-Friendly
- State Indiana
- 90 Strongly Landlord-Friendly · R+11
- County
- — inherits STATE
- City
- — inherits STATE
ZIP-level market 47933
- Home prices YoY
- -27.1%
- Rents YoY
- 3.3%
- Active inventory
- 203
- Price-to-rent
- 8.9×
Monthly cashflow live
- Estimated rent
- $1,308 medium interval (Pro) →
- Mortgage (P&I)
- −$733
- Tax from tax record
- −$41 /mo · $489/yr
- Insurance
- −$58
- HOA
- −$0
- Vacancy / Maint / Mgmt
- −$275
- Net cashflow
- $202
Break-even live
UW: 25.0% down · 7.5% · 30yr · 1.5% tax · 5.0% vac · 8.0% maint · 8.0% mgmt
Financing live
Cash to close
- Down payment
- $34,925
- Closing costs
- $4,191
- Reserves months
- —
- Total cash needed
- —
Loan-product check · same deal, 3 products live
Conventional
25% down · 7.5% · 30yr
- Down + closing
- —
- Monthly P&I
- —
- Monthly cashflow
- —
- DSCR
- —
- Eligible?
- —
Personal DTI + credit; lowest rate.
DSCR
20% down · 8.5% · 30yr
- Down + closing
- —
- Monthly P&I
- —
- Monthly cashflow
- —
- DSCR
- —
- Eligible?
- —
No personal income docs; deal must DSCR.
Hard money
10% down · 12.0% · 12mo
- Down + closing
- —
- Monthly P&I
- —
- Monthly cashflow
- —
- DSCR
- —
- Eligible?
- —
Short-term bridge; refi at stabilization.
Rent comps 1 comps
| Address | Beds | Baths | Sqft | Rent | $/sqft | DOM | Units | Dist |
|---|---|---|---|---|---|---|---|---|
| 200 Knoll Cir Crawfordsville, IN | 1.0–2.0 | 1.0–2.0 | 821 | $1,250 | $1.52 | 13d | 9 | 1.15mi |
Listing history 6 events
-
2026-02-24status Pending
-
2026-01-30price $139,700
-
2026-01-16$148,900 Active
-
2025-12-17historical
-
2025-12-12price $149,500
-
2025-11-28$163,000 Active
ⓘ Source: listings_history table (triggers on properties + properties_extension) + one-shot
backfill from property_details.listing_events for pre-trigger history.
Tax reassessment forecast IN · Partial reset (capped growth)
- Current annual tax
- $489 · $41/mo
- Projected year-2 tax
- $838 · $70/mo
- Expected delta
- +$349/yr (+$29/mo · 71.4%)
ⓘ Screening estimate from a state-policy table — verify with the county assessor before closing.
Climate risk First Street
- Flood 1/10 Low FEMA zone X (unshaded) · 0% chance over 30 yrs
- Wildfire 1/10 Low
- Heat 3/10 Moderate 7 d/yr ≥101°F today · 18 d/yr by 30 yrs out
- Wind 2/10 Low 100% chance of damaging wind over 30 yrs
- Air quality 2/10 Low 1 unhealthy d/yr today · 2 by 30 yrs out
Nearby sold comps map
Loading sold comps map…
Walkable amenities ~0.75 mi
Loading nearby amenities…
Taxation est. · year 1
- Rental income
- $15,697
- − Mortgage interest
- −$7,825
- − Property taxes
- −$489
- − Insurance
- −$698
- − Repairs & maintenance
- −$1,256
- − Management
- −$1,256
- − Depreciation
- −$4,064
- Taxable income
- $109
- Est. tax owed @ 24.0%
- −$26
- After-tax cash flow
- $2,396/yr
For passive investors: Depreciation is non-cash, so a rental often shows a tax loss while cash-flowing — sheltering income. Rental losses are passive: they offset passive income freely, and up to $25,000/yr can offset ordinary (W-2) income if you actively participate and your MAGI is under $100k (phasing out to $0 by $150k); unused losses carry forward. On sale, claimed depreciation is recaptured at up to 25%, and gains may owe capital-gains tax (a 1031 exchange can defer both). Figures are a year-1 estimate at your 24.0% rate — not tax advice; consult a CPA.
Schools (NCES district)
- District
- Crawfordsville Community Schools
- NCES district ID
- 1802460
- Math proficiency
- 27% ▼ -8.00%
- Reading proficiency
- 32% ▼ -6.00%
- Median HH income
- $39,087
- Composite
- 24.73/100
- National rank
- #7606
- State rank
- #247 of 301 in IN
Livability — Crawfordsville
- Score
- 72/100
- State rank
- #118
- US rank
- #6376
Category grades
Schools grade is shown separately in the Schools card above.
Census & demographics
- Census place
- Crawfordsville, IN
- County
- Montgomery County · 28,357 people
- City population
- 28,357
- Metro
- Crawfordsville, IN
- Population (ZIP)
- 28,357
- Household income
- $68,130
- Rent vs Own
- Severe rent burden
- 464.0
Population outlook (Montgomery County) Hauer SSP2
- Today (2025)
- 37,893 people
- By 2030
- 37,539 · -0.9%
- By 2040
- 36,536 · -3.6%
- By 2050
- 34,454 · -9.1%
- By 2075
- 28,852 · -23.9%
- By 2100
- 21,145 · -44.2%
Race, ethnicity, and origin ACS 2023
- Neighborhood character
- Predominantly White (88%)
- Race & ethnicity
- White 88% Hispanic / Latino 7% Two or more races 7%
- Hispanic origin (detail)
- Mexican 5% Puerto Rican 2%
- Common ancestry
- Slovak 2% Lithuanian 2% Romanian 2%
- Foreign-born
- 4% · Canada
- Languages at home
- 93% English-only · Spanish 6%
Political lean MEDSL · Montgomery
- 2024 margin
- Solid R (+48.2) · D 24.9% · R 73.2% · Other 1.9%
- 2008→2024 swing
- -28.3pp toward R · 2008: -19.9pp · 2024: -48.2pp
- All cycles
- 2024: R+48.2 2020: R+49.1 2016: R+50.9 2012: R+38.5 2008: R+19.9
Not yet ingested
- Civics
- —
Market trends
- HPI YoY
- ▼ -78.91%
- Current HPI
- 211.6864
- Rent YoY
- ▲ 3.28%
- Metro
- Crawfordsville, IN
- State GDP YoY
- ▲ 2.90%
- F500 in state
- 18
Industry mix (Fortune 500 HQ in IN)
| Industry | F500 HQs | Revenue |
|---|---|---|
| Industrial Machinery | 2 | $37B |
|
||
| Healthcare | 1 | $177B |
|
||
| Pharmaceuticals | 1 | $45B |
|
||
| Metals / Steel | 1 | $18B |
|
||
| Agriculture | 1 | $17B |
|
||
| Packaging | 1 | $12B |
|
||
Price history
-14.3% since first listed6 events — show timeline
- 2026-02-24 Pending — MIBOR as Distributed by MLS Grid
- 2026-01-30 Price Changed $139,700 MIBOR as Distributed by MLS Grid
- 2026-01-16 Listed $148,900 MIBOR as Distributed by MLS Grid
- 2025-12-17 Listing Removed — MIBOR as Distributed by MLS Grid
- 2025-12-12 Price Changed $149,500 MIBOR as Distributed by MLS Grid
- 2025-11-28 Listed $163,000 MIBOR as Distributed by MLS Grid
Property tax history
+14.9%/yrLatest (2025): $489 · -12.0% YoY. Source: county tax records.
Cash-flow waterfall
monthlySold comps — $/sqft
last 12 mo · ≤1 miLoading sold comps…