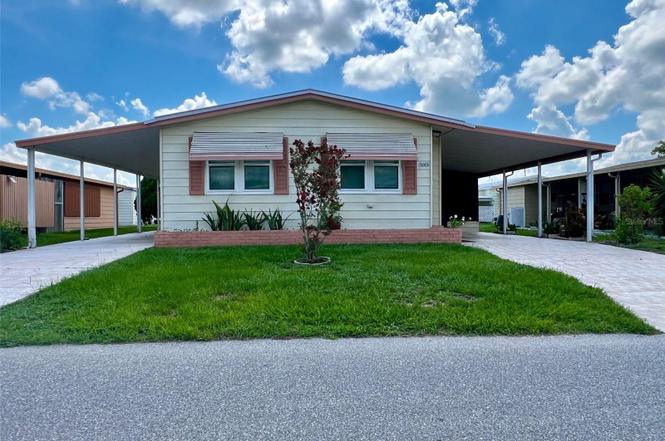
5013 Foxwood Blvd · Lakeland, FL
Flood risk 1/10 · Minimal
- FEMA flood zone
- X (unshaded)
- Chance of flooding over 30 yrs
- 0.0%
- Est. flood insurance / yr
- $507 – $1,088
Fire risk 4/10 · Minor
- Est. fire insurance / yr
- $947 – $1,759
Heat risk 9/10 · Severe
- Hot days now (above 108°F)
- 7 days/yr
- Hot days in 30 yrs
- 24 days/yr
Wind risk 9/10 · Severe
- Chance of severe wind over 30 yrs
- 99.0%
Air-quality risk 2/10 · Minimal
- Unhealthy air days now
- 1 days/yr
- Unhealthy air days in 30 yrs
- 1 days/yr
Risk factors via First Street. Map © Google.
Why this score? — see what drove the C- grade
The composite is a weighted blend of 9 inputs, each scored 0–100. Each bar is that input's sub-score; the figure is the points it added to the 100-point composite (weight × sub-score).
- Cash flow +21.4/30.0
- ARV discount +7.5/15.0
- DSCR +6.8/10.0
- 1% rule +4.8/10.0
- Livability +3.9/5.0
- Schools +3.5/10.0
- Rent growth +3.2/5.0
- Condition / age +2.5/5.0
- Appreciation +0.0/10.0
$165,000
🖨 Deal sheet (PDF) 📄 Offer letter ✓ Due diligence
Listing remarks
PRICE IMPROVEMENT! Charming 2BR/2BA home in the sought-after 55+ community of Foxwood Lake Estates — where you own the land! This well-maintained home offers major updates, including a 2-year-old metal roof, 3–4-year-old A/C, new hot water heater and dishwasher (March 2026), and updated GFI receptacles for added peace of mind. The spacious open-concept living and dining area is perfect for entertaining, while the screened-in porch and air-conditioned utility room/workshop provide extra space for relaxing or hobbies. A rare find in the community, this property features two driveways with parking for up to four vehicles. Residents enjoy an active lifestyle with access to a l
Key facts
- Community pool
- Spacious open floor
- 4,800 sq ft lot
Tags
Property features AI
Finance
- Other: Furnished
- HOA & community: HOA required (Foxwood Lake Estates/Melody) — $68.06 monthly ($816.75 annually); Community clubhouse, pool, fitness center, dog park; Deed restrictions; Buyer approval required; Golf carts allowed; Senior community; Pets allowed (cats and dogs)
Exterior
- Parking: Carport with 4 spaces
- Utilities: Public water; Public sewer; Cable available
- Home design: Manufactured double-wide home; One level; Faces west
- Construction: Vinyl siding; Shingle roof; Crawlspace foundation
- Exterior features: Covered, enclosed patio; Patio; Shade shutters; Shed(s)
Interior
- Kitchen: Dishwasher; Range; Microwave; Refrigerator
- Bedrooms: 2 bedrooms
- Flooring: Carpet; Linoleum
- Bathrooms: 2 full bathrooms
- Heating & cooling: Central heating; Central air conditioning
- Interior features: Ceiling fans
- Laundry & utility: In-unit laundry room with washer and dryer
Neighborhood map
What this means for you Summary
Snapshot
- This is a 2-bed/2.0-bath manufactured listed at $165k.
Deal economics
- At list price, monthly cash flow is $245 ($3k/yr) — positive.
- The deal already cash-flows at list — no discount required.
- To meet the 1% rule (rent ≥ 1% of price), the offer needs to be $162k (1.8% below list).
- Recommended offer: $145k (12.0% below list) — sets the bar for market timing.
Location & tenants
- Location reads 77/100 on livability (#206 in FL, #3,179 nationally) — a middle-class / working-renter tenant base. Strengths: cost of living A+, housing A+, health & safety A+; Watch: employment D+, amenities F, commute F.
- Polk (suburban): math 39% / reading 43% proficiency, ranked #62 of 73 in FL (top 85%) — families likely to look elsewhere, expect single-tenant / working-renter base with shorter leases.
- Zoned schools: Sleepy Hill Elementary School (math 44% / reading 38%, grade F, #1,454 of 2,144 statewide, top 69%, 739 students, 66% FRL); Sleepy Hill Middle School (math 29% / reading 34%, grade F, #453 of 571 statewide, top 81%, 1,090 students, 66% FRL); Kathleen Senior High School (math 19% / reading 31%, grade F, #501 of 667 statewide, top 75%, 2,051 students, 59% FRL) — zoned schools at 64% FRL track the district average.
- Market conditions: Rents rising (+2.8%/yr); 511 active listings in the ZIP; 16 comparable units currently listed for rent nearby; rentals at typical pace (median 21d on market — plan ~3-4 weeks tenant-placement turnaround); 10,384 units permitted in Polk County in 2024 (1,716 in 5+ unit buildings).
Forward outlook
- Local home prices are declining (-3.0%/yr); year-one equity from $1k of loan paydown is wiped out by about $5k of value loss. Plan a longer hold.
- Polk County population projected at +33% by 2050 — long-run rental-demand tailwind backs the buy-and-hold thesis.
Negotiation context
- It's been on market 695 days — a 12% lower offer ($145k) is reasonable based on typical stale-listing flexibility.
- 3 sale attempts since 2y ago; this cycle's ask has dropped $55k (25%) from the opening price — seller is motivated, your offer sets the floor, not the list.
- Current owner paid $48k; list at $165k implies a 247% gain — meaningful room to come down on a strong offer.
Risks & watch-outs
- Climate carrying-cost: severe wind risk, 99% chance of damaging wind over 30y; extreme-heat days projected 7→24/yr by 2055 (HVAC capex compounding) — expect insurance premiums to compound above CPI over the hold.
Questions for the listing agent
- It's been on market 695 days. Have you received any prior offers? Is the seller open to a 12% concession, seller financing, or rate buy-down credit?
- What does the HOA fee cover, when was the last increase, and are there any pending special assessments or reserve-fund shortfalls?
- Why hasn't it sold? Are there any deal-killer items the seller is aware of (foundation, flood, title, zoning, code violations)?
- Is there a deadline driving the sale (1031 exchange, divorce, estate, relocation)? That informs how much negotiation room exists.
- What's the average days-on-market for RENTAL listings here right now (not sales)? A rising rental-DOM trend means longer vacancies and softer asking-rent achievability than the comps imply.
- What's the recent tenant-quality profile in this submarket — average credit score on applications, eviction rate, late-payment / NSF rate, and stable-employment percentage? A property-management company in the area should have these aggregated.
- How much new for-sale + rental construction is in the pipeline within 1–3 miles? Heavy new supply typically softens prices + rents 12–24 months out; constrained supply supports both.
Investment metrics
- 1% rule
- 0.98% ✗
- Cap rate
- 8.08%
- Cash-on-cash
- 6.38%
- DSCR
- 1.28
- GRM
- 8.5
CMA / ARV
No comps found within radius.
Projected returns pro-forma
-3.0% appreciation · 2.78% rent growth · sell at horizon
- IRR
- -6.7%
- Equity multiple
- 0.75×
- Total profit
- $-11,503
- Equity at exit
- $24,602
- IRR
- 2.6%
- Equity multiple
- 1.18×
- Total profit
- $8,485
- Equity at exit
- $14,266
Cash invested: $46,200 (down + closing). Projections, not guarantees.
Landlord ↔ Tenant lean methodology
- Overall (STATE)
- 87 Strongly Landlord-Friendly
- State Florida
- 87 Strongly Landlord-Friendly · R+3
- County
- — inherits STATE
- City
- — inherits STATE
ZIP-level market 33810
- Rents YoY
- 2.8%
- Active inventory
- 511
- Price-to-rent
- 8.5×
Monthly cashflow live
- Estimated rent
- $1,620 high interval (Pro) →
- Mortgage (P&I)
- −$865
- Tax from tax record
- −$32 /mo · $385/yr
- Insurance
- −$69
- HOA
- −$68
- Vacancy / Maint / Mgmt
- −$340
- Net cashflow
- $245
Break-even live
Sensitivity live
| Price | -10% $339 | -5% $292 | +0% $245 | +5% $199 | +10% $152 |
|---|---|---|---|---|---|
| Rent | -10% $117 | -5% $181 | +0% $245 | +5% $309 | +10% $373 |
| Rate | -1.0pp $329 | -0.5pp $287 | base $245 | +0.5pp $203 | +1.0pp $159 |
UW: 25.0% down · 7.5% · 30yr · 1.5% tax · 5.0% vac · 8.0% maint · 8.0% mgmt
Financing live
Cash to close
- Down payment
- $41,250
- Closing costs
- $4,950
- Reserves months
- —
- Total cash needed
- —
Loan-product check · same deal, 3 products live
Conventional
25% down · 7.5% · 30yr
- Down + closing
- —
- Monthly P&I
- —
- Monthly cashflow
- —
- DSCR
- —
- Eligible?
- —
Personal DTI + credit; lowest rate.
DSCR
20% down · 8.5% · 30yr
- Down + closing
- —
- Monthly P&I
- —
- Monthly cashflow
- —
- DSCR
- —
- Eligible?
- —
No personal income docs; deal must DSCR.
Hard money
10% down · 12.0% · 12mo
- Down + closing
- —
- Monthly P&I
- —
- Monthly cashflow
- —
- DSCR
- —
- Eligible?
- —
Short-term bridge; refi at stabilization.
Rent comps 16 comps
| Address | Beds | Baths | Sqft | Rent | $/sqft | DOM | Units | Dist |
|---|---|---|---|---|---|---|---|---|
| 5227 Grace St E Lakeland, FL | 3.0 | 2.0 | 1062 | $1,775 | $1.67 | 25d | 1 | 0.31mi |
| 1567 Longbow Dr Lakeland, FL | 2.0 | 1.5 | 864 | $1,195 | $1.38 | 4d | 1 | 0.34mi |
| 6120 Burnett St Lakeland, FL | 1.0–3.0 | 1.0–2.0 | 1002 | $1,910 | $1.91 | 5d | 21 | 0.73mi |
| 5233 US Highway 98 N Lakeland, FL | 1.0–2.0 | 1.0–2.0 | 794 | $1,505 | $1.89 | 4d | 15 | 0.76mi |
| 4500 Williamstown Blvd Lakeland, FL | 3.0 | 1.0–2.0 | 1062 | $1,508 | $1.42 | 25d | 1 | 0.86mi |
| 1510 Galloway Oaks Dr Lakeland, FL | 2.0–3.0 | 2.0 | 1066 | $1,376 | $1.29 | 23d | 8 | 0.92mi |
| 909 Shirley Ann Trl Lakeland, FL | 2.0 | 2.0 | 950 | $1,460 | $1.54 | 25d | 1 | 0.94mi |
| 1545 Kennedy Blvd Lakeland, FL | 1.0–3.0 | 1.0–2.0 | 997 | $1,682 | $1.69 | 4d | 24 | 1.01mi |
| 6032 Norton Rd Unit 6032 Lakeland, FL | 2.0 | 2.0 | 880 | $1,295 | $1.47 | 25d | 1 | 1.04mi |
| 4240 Summer Landing Dr #106 Lakeland, FL | 3.0 | 2.0 | 1038 | $1,700 | $1.64 | 25d | 1 | 1.05mi |
| 4240 Summer Landing Dr Lakeland, FL | 2.0–3.0 | 2.0 | 1083 | $1,450 | $1.34 | 15d | 2 | 1.05mi |
| 6031 Crafton Dr Lakeland, FL | 2.0 | 1.0 | 914 | $1,125 | $1.23 | 15d | 1 | 1.11mi |
| 4355 Corporate Ave Lakeland, FL | 2.0 | 2.0 | 872 | $1,531 | $1.76 | 12d | 1 | 1.15mi |
| 6131 Doe Cir E Lakeland, FL | 3.0 | 2.0 | 1353 | $1,700 | $1.26 | 16d | 1 | 1.29mi |
| 733 Carpenters Way #37 Lakeland, FL | 2.0 | 1.5 | 1307 | $1,400 | $1.07 | 20d | 1 | 1.41mi |
| 5818 Bambi Dr Lakeland, FL | 3.0 | 2.0 | 1401 | $2,200 | $1.57 | 25d | 1 | 1.48mi |
HOA detail
- Monthly dues
- $68 · $816/yr
- Likely covers
- water
Listing history 27 events
-
2026-06-22days on market $165,000 Active 695 DOM
-
2026-06-18days on market $165,000 Active 692 DOM
-
2026-06-17days on market $165,000 Active 691 DOM
-
2026-06-16days on market $165,000 Active 690 DOM
-
2026-06-15days on market $165,000 Active 689 DOM
-
2026-06-13days on market $165,000 Active 687 DOM
-
2026-06-10days on market $165,000 Active 684 DOM
-
2026-06-09days on market $165,000 Active 683 DOM
-
2026-06-08days on market $165,000 Active 682 DOM
-
2026-06-07days on market $165,000 Active 681 DOM
-
2026-06-05days on market $165,000 Active 678 DOM
-
2026-06-03days on market $165,000 Active 676 DOM
-
2026-06-01days on market $165,000 Active 675 DOM
-
2026-05-31days on market $165,000 Active 674 DOM
-
2026-03-31status Active
-
2026-03-31price $165,000
-
2026-03-23status Active
-
2026-03-15status Pending
-
2026-01-09price $170,000
-
2025-07-10price $175,000
-
2025-05-12price $180,000
-
2025-03-24price $185,000
-
2025-02-07price $200,000
-
2024-08-07price $210,000
-
2024-07-11$220,000 Active
-
1996-11-05soldstatus $47,500
-
1993-12-02soldstatus $36,500
ⓘ Source: listings_history table (triggers on properties + properties_extension) + one-shot
backfill from property_details.listing_events for pre-trigger history.
Tax reassessment forecast FL · Resets to sale price
- Current annual tax
- $385 · $32/mo
- Projected year-2 tax
- $1,370 · $114/mo
- Expected delta
- +$984/yr (+$82/mo · 255.4%)
ⓘ Screening estimate from a state-policy table — verify with the county assessor before closing.
Climate risk First Street
- Flood 1/10 Low FEMA zone X (unshaded) · 0% chance over 30 yrs
- Wildfire 4/10 Moderate
- Heat 9/10 Extreme 7 d/yr ≥108°F today · 24 d/yr by 30 yrs out
- Wind 9/10 Extreme 99% chance of damaging wind over 30 yrs
- Air quality 2/10 Low 1 unhealthy d/yr today · 1 by 30 yrs out
Nearby sold comps map
Loading sold comps map…
Walkable amenities ~0.75 mi
Loading nearby amenities…
Taxation est. · year 1
- Rental income
- $19,437
- − Mortgage interest
- −$9,243
- − Property taxes
- −$385
- − Insurance
- −$825
- − Repairs & maintenance
- −$1,555
- − Management
- −$1,555
- − HOA
- −$816
- − Depreciation
- −$4,800
- Taxable income
- $258
- Est. tax owed @ 24.0%
- −$62
- After-tax cash flow
- $2,883/yr
For passive investors: Depreciation is non-cash, so a rental often shows a tax loss while cash-flowing — sheltering income. Rental losses are passive: they offset passive income freely, and up to $25,000/yr can offset ordinary (W-2) income if you actively participate and your MAGI is under $100k (phasing out to $0 by $150k); unused losses carry forward. On sale, claimed depreciation is recaptured at up to 25%, and gains may owe capital-gains tax (a 1031 exchange can defer both). Figures are a year-1 estimate at your 24.0% rate — not tax advice; consult a CPA.
Schools (NCES district)
- District
- Polk
- NCES district ID
- 1201590
- Math proficiency
- 39% ▼ -11.00%
- Reading proficiency
- 43% ▼ -4.00%
- Median HH income
- $43,979
- Composite
- 34.74/100
- National rank
- #5132
- State rank
- #62 of 73 in FL
Livability — Lakeland
- Score
- 77/100
- State rank
- #206
- US rank
- #3179
Category grades
Schools grade is shown separately in the Schools card above.
Census & demographics
- Census place
- Lakeland, FL
- County
- Polk County · 740,051 people
- City population
- 277,690
- Metro
- Lakeland-Winter Haven, FL
- Population (ZIP)
- 55,137
- Household income
- $69,986
- Rent vs Own
- Severe rent burden
- 1208.0
Population outlook (Polk County) Hauer SSP2
- Today (2025)
- 752,975 people
- By 2030
- 804,621 · +6.9%
- By 2040
- 906,117 · +20.3%
- By 2050
- 1,000,476 · +32.9%
- By 2075
- 1,197,520 · +59.0%
- By 2100
- 1,271,518 · +68.9%
Race, ethnicity, and origin ACS 2023
- Neighborhood character
- Diverse neighborhood (Simpson 0.58)
- Race & ethnicity
- White 59% Hispanic / Latino 23% Black 12% Two or more races 10% Asian 2%
- Hispanic origin (detail)
- Mexican 5% Puerto Rican 9% Cuban 5%
- Common ancestry
- Italian 2% Lithuanian 2% Slovak 1%
- Foreign-born
- 9% · Canada, Jamaica
- Languages at home
- 79% English-only · Spanish 17% French/Haitian/Cajun 1% Tagalog/Filipino 1%
Political lean MEDSL · Polk
- 2024 margin
- Strong R (+20.7) · D 39.2% · R 59.9%
- 2008→2024 swing
- -14.6pp toward R · 2008: -6.1pp · 2024: -20.7pp
- All cycles
- 2024: R+20.7 2020: R+14.4 2016: R+14.1 2012: R+6.8 2008: R+6.1
Not yet ingested
- Civics
- —
Market trends
- HPI YoY
- ▼ -194.94%
- Current HPI
- 320.7366
- Rent YoY
- ▲ 2.78%
- Metro
- Lakeland-Winter Haven, FL
- State GDP YoY
- ▲ 3.28%
- F500 in state
- 36
Industry mix (Fortune 500 HQ in FL)
| Industry | F500 HQs | Revenue |
|---|---|---|
| Industrial Technology | 2 | $29B |
|
||
| Insurance | 2 | $17B |
|
||
| Retail | 1 | $60B |
|
||
| Technology Distribution | 1 | $58B |
|
||
| Homebuilding | 1 | $35B |
|
||
| Technology Manufacturing | 1 | $35B |
|
||
Price history
+352.1% since first listed13 events — show timeline
- 2026-03-31 Relisted — Stellar MLS as Distributed by MLS Grid
- 2026-03-31 Price Changed $165,000 Stellar MLS as Distributed by MLS Grid
- 2026-03-23 Relisted — Stellar MLS as Distributed by MLS Grid
- 2026-03-15 Pending — Stellar MLS as Distributed by MLS Grid
- 2026-01-09 Price Changed $170,000 Stellar MLS as Distributed by MLS Grid
- 2025-07-10 Price Changed $175,000 Stellar MLS as Distributed by MLS Grid
- 2025-05-12 Price Changed $180,000 Stellar MLS as Distributed by MLS Grid
- 2025-03-24 Price Changed $185,000 Stellar MLS as Distributed by MLS Grid
- 2025-02-07 Price Changed $200,000 Stellar MLS as Distributed by MLS Grid
- 2024-08-07 Price Changed $210,000 Stellar MLS as Distributed by MLS Grid
- 2024-07-11 Listed $220,000 Stellar MLS as Distributed by MLS Grid
- 1996-11-05 Sold (Public Records) $47,500 Public Records
- 1993-12-02 Sold (Public Records) $36,500 Public Records
Property tax history
+0.5%/yrLatest (2025): $385 · +2.2% YoY. Source: county tax records.
Cash-flow waterfall
monthlySold comps — $/sqft
last 12 mo · ≤1 miLoading sold comps…