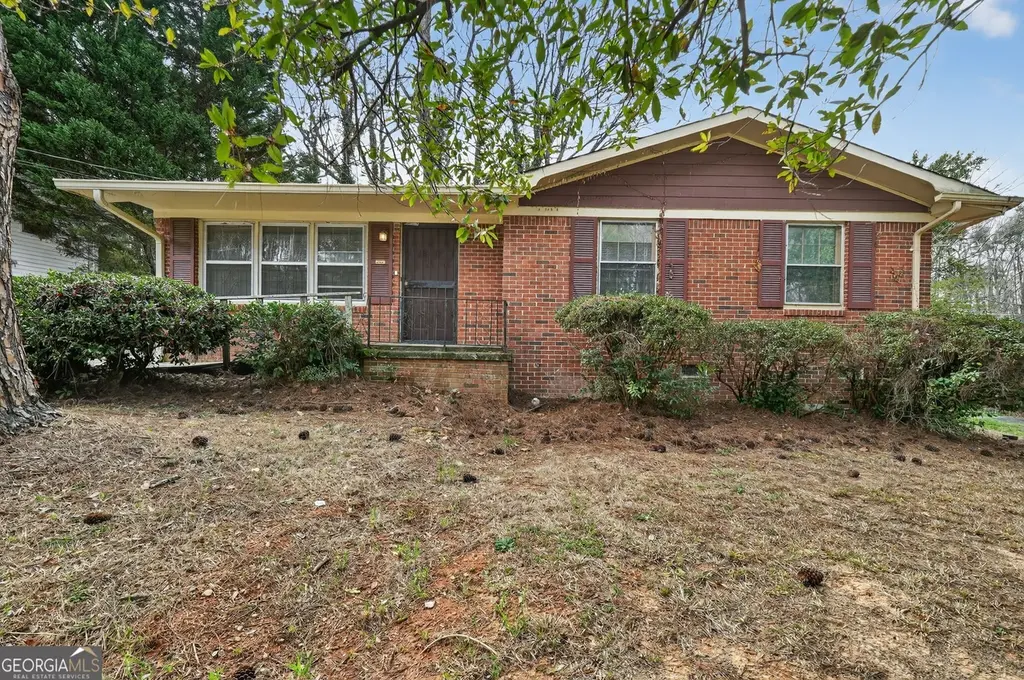
4054 Princeton Pl SW · Atlanta, GA
Flood risk 1/10 · Minimal
- FEMA flood zone
- X (unshaded)
- Chance of flooding over 30 yrs
- 0.0%
- Est. flood insurance / yr
- $473 – $860
Fire risk 3/10 · Minor
- Est. fire insurance / yr
- $963 – $1,789
Heat risk 5/10 · Moderate
- Hot days now (above 103°F)
- 7 days/yr
- Hot days in 30 yrs
- 17 days/yr
Wind risk 4/10 · Minor
- Chance of severe wind over 30 yrs
- 23.0%
Air-quality risk 4/10 · Minor
- Unhealthy air days now
- 3 days/yr
- Unhealthy air days in 30 yrs
- 5 days/yr
Risk factors via First Street. Map © Google.
Why this score? — see what drove the C+ grade
The composite is a weighted blend of 9 inputs, each scored 0–100. Each bar is that input's sub-score; the figure is the points it added to the 100-point composite (weight × sub-score).
- Cash flow +20.9/30.0
- ARV discount +15.0/15.0
- DSCR +6.7/10.0
- 1% rule +5.7/10.0
- Livability +4.2/5.0
- Rent growth +3.2/5.0
- Schools +2.7/10.0
- Condition / age +2.5/5.0
- Appreciation +0.0/10.0
$169,900
🖨 Deal sheet 📄 Offer letter ✓ Due diligence
Listing remarks MLS
Solid cozy single story all brick ranch home is 1404 sq ft. Has 3 bedrooms, one bath. Open back yard, ready for move in. Come make this your home. Easy to renovate and customize.
Key facts
- Open back yard
- Brick ranch home
- 0.24 acre lot
Tags
Neighborhood map
What this means for you Summary
Snapshot
- This is a 3-bed/1.0-bath single-family listed at $170k.
Deal economics
- At list price, monthly cash flow is $238 ($3k/yr) — positive.
- The deal already cash-flows at list — no discount required.
- Meets the 1% rule at list price ($2k rent vs $170k).
- Recommended offer: $155k (9.0% below list) — sets the bar for market timing.
- Cap rate 8.0% vs local median 3.1% in Atlanta — top-decile yield for the area; either an underpriced asset or a hidden risk that comps aren't pricing in. Stress-test before assuming the spread holds.
Location & tenants
- Location reads 83/100 on livability (#6 in GA, #919 nationally) — a professional / high-income tenant draw. Strengths: amenities A+, commute A+, housing A+; Watch: schools C-, cost of living C-.
- Atlanta Public Schools (urban): math 28% / reading 35% proficiency, ranked #80 of 174 in GA (top 46%) — families likely to look elsewhere, expect single-tenant / working-renter base with shorter leases; 71% free/reduced lunch — lower-income household profile, screen leases tightly.
- Market conditions: Rents rising (+2.6%/yr); 483 active listings in the ZIP; 30 comparable units currently listed for rent nearby; rentals at typical pace (median 25d on market — plan ~3-4 weeks tenant-placement turnaround); 11,565 units permitted in Fulton County in 2024 (8,159 in 5+ unit buildings).
- This rent runs 35% of the median local income ($63k/yr) — at the standard rent-burdened threshold; future hikes will face affordability resistance.
Forward outlook
- Local home prices are declining (-3.0%/yr); year-one equity from $1k of loan paydown is wiped out by about $5k of value loss. Plan a longer hold.
- Fulton County population projected at +38% by 2050 — long-run rental-demand tailwind backs the buy-and-hold thesis.
Negotiation context
- It's been on market 97 days — a 9% lower offer ($155k) is reasonable based on typical stale-listing flexibility.
- 2 sale attempts; this cycle's ask has dropped $15k (8%) from the opening price — seller is motivated, your offer sets the floor, not the list.
Risks & watch-outs
- Climate carrying-cost: extreme-heat days projected 7→17/yr by 2055 (HVAC capex compounding) — expect insurance premiums to compound above CPI over the hold.
Questions for the listing agent
- It's been on market 97 days. Have you received any prior offers? Is the seller open to a 9% concession, seller financing, or rate buy-down credit?
- Built in 1965 — when were the roof, HVAC, electrical panel, plumbing, and water heater last replaced?
- Why hasn't it sold? Are there any deal-killer items the seller is aware of (foundation, flood, title, zoning, code violations)?
- Is there a deadline driving the sale (1031 exchange, divorce, estate, relocation)? That informs how much negotiation room exists.
- What's the average days-on-market for RENTAL listings here right now (not sales)? A rising rental-DOM trend means longer vacancies and softer asking-rent achievability than the comps imply.
- What's the recent tenant-quality profile in this submarket — average credit score on applications, eviction rate, late-payment / NSF rate, and stable-employment percentage? A property-management company in the area should have these aggregated.
- How much new for-sale + rental construction is in the pipeline within 1–3 miles? Heavy new supply typically softens prices + rents 12–24 months out; constrained supply supports both.
Investment metrics
- 1% rule
- 1.07% ✓
- Cap rate
- 7.97%
- Cash-on-cash
- 5.99%
- DSCR
- 1.27
- GRM
- 7.8
CMA / ARV
- ARV (median comp)
- $333,516
- List price
- $169,900
- Delta
- -49.06%
- Verdict
- UNDERPRICED
- Comps
- 20 within 1.0 mi
Show comp detail 12 sales within ~0.75 mi
| Address | Dist | Beds/Ba | Sqft | Sold | Price | $/sf | Match |
|---|---|---|---|---|---|---|---|
| 3971 Cornell Blvd SW | 0.27mi | 3/2.0 | 1,480 (+5%) | 18mo | $200,000 | $135 | 59 |
| 473 Oakside Dr SW | 0.52mi | 3/2.0 | 1,362 (-3%) | 12mo | $155,000 | $114 | 56 |
| 4031 Bakers Ferry Rd SW | 0.48mi | 3/2.5 | 1,442 (+3%) | 16mo | $245,000 | $170 | 54 |
| 273 Fennel Way SW | 0.52mi | 4/2.0 (+1) | 1,474 (+5%) | 6mo | $200,000 | $136 | 54 |
| 4023 Kenner Dr SW | 0.74mi | 3/2.0 | 1,389 (-1%) | 16mo | $248,000 | $179 | 46 |
| 354 Tarragon Way SW | 0.67mi | 3/2.0 | 1,306 (-7%) | 12mo | $280,000 | $214 | 43 |
| 3698 Fairlane Dr | 0.72mi | 3/2.0 | 1,432 (+2%) | 20mo | $153,000 | $107 | 43 |
| 3966 Kenner Dr | 0.74mi | 3/2.0 | 1,432 (+2%) | 21mo | $250,000 | $175 | 40 |
| 344 Woodstock Dr SW | 0.36mi | 4/3.0 (+1) | 1,600 (+14%) | 10mo | $305,000 | $191 | 39 |
| 3950 Fennel Cir SW | 0.66mi | 3/2.0 | 1,254 (-11%) | 13mo | $240,000 | $191 | 37 |
| 320 Fennel Way SW | 0.60mi | 3/3.0 | 1,234 (-12%) | 16mo | $220,000 | $178 | 30 |
| 335 Tarragon Way SW | 0.63mi | 4/2.0 (+1) | 1,555 (+11%) | 19mo | $260,000 | $167 | 28 |
Match score weights: distance 35% · size 25% · config 20% · recency 20%. Top-matched comps best support the ARV.
Projected returns pro-forma
-3.0% appreciation · 2.63% rent growth · sell at horizon
- IRR
- -7.4%
- Equity multiple
- 0.73×
- Total profit
- $-13,027
- Equity at exit
- $25,333
- IRR
- 1.7%
- Equity multiple
- 1.12×
- Total profit
- $5,574
- Equity at exit
- $14,690
Cash invested: $47,572 (down + closing). Projections, not guarantees.
Landlord ↔ Tenant lean methodology
- Overall (STATE)
- 90 Strongly Landlord-Friendly
- State Georgia
- 90 Strongly Landlord-Friendly · R+3
- County
- — inherits STATE
- City
- — inherits STATE
ZIP-level market 30331
- Home prices YoY
- -34.2%
- Rents YoY
- 2.6%
- Active inventory
- 483
- Price-to-rent
- 7.8×
Monthly cashflow live
- Estimated rent
- $1,823 high interval (Pro) →
- Mortgage (P&I)
- −$891
- Tax from tax record
- −$241 /mo · $2,891/yr
- Insurance
- −$71
- HOA
- −$0
- Vacancy / Maint / Mgmt
- −$383
- Net cashflow
- $238
Break-even live
UW: 25.0% down · 7.5% · 30yr · 1.5% tax · 5.0% vac · 8.0% maint · 8.0% mgmt
Financing live
Cash to close
- Down payment
- $42,475
- Closing costs
- $5,097
- Reserves months
- —
- Total cash needed
- —
Loan-product check · same deal, 3 products live
Conventional
25% down · 7.5% · 30yr
- Down + closing
- —
- Monthly P&I
- —
- Monthly cashflow
- —
- DSCR
- —
- Eligible?
- —
Personal DTI + credit; lowest rate.
DSCR
20% down · 8.5% · 30yr
- Down + closing
- —
- Monthly P&I
- —
- Monthly cashflow
- —
- DSCR
- —
- Eligible?
- —
No personal income docs; deal must DSCR.
Hard money
10% down · 12.0% · 12mo
- Down + closing
- —
- Monthly P&I
- —
- Monthly cashflow
- —
- DSCR
- —
- Eligible?
- —
Short-term bridge; refi at stabilization.
Rent comps 30 comps
| Address | Beds | Baths | Sqft | Rent | $/sqft | DOM | Units | Dist |
|---|---|---|---|---|---|---|---|---|
| 440 Dartmouth Dr SW Atlanta, GA | 4.0 | 3.0 | 1148 | $1,795 | $1.56 | 21d | 1 | 0.33mi |
| 40 Candlelight Ln SW Apt B Atlanta, GA | 3.0 | 3.0 | 1274 | $1,800 | $1.41 | 24d | 1 | 0.45mi |
| 40 Candlelight Ln SW Unit A Atlanta, GA | 2.0 | 2.0 | 1098 | $1,500 | $1.37 | 24d | 1 | 0.45mi |
| 4172 Renfrew Ct SW Atlanta, GA | 4.0 | 2.0 | 1136 | $1,200 | $1.06 | 8d | 1 | 0.47mi |
| 350 Fennel Way SW Atlanta, GA | 4.0 | 2.0 | 1450 | $1,500 | $1.03 | 21d | 1 | 0.60mi |
| 586 Oakside Dr SW Unit B Atlanta, GA | 2.0 | 1.0 | 1075 | $1,065 | $0.99 | 15d | 1 | 0.66mi |
| 586 Oakside Dr SW Unit A Atlanta, GA | 3.0 | 1.0 | 1075 | $1,325 | $1.23 | 15d | 1 | 0.66mi |
| 470 Bolton Rd NW Unit D1 Atlanta, GA | 2.0 | 1.5 | 1100 | $1,395 | $1.27 | 24d | 1 | 0.69mi |
| 3915 Basil Way SW Atlanta, GA | 3.0 | 2.0 | 1287 | $2,600 | $2.02 | 24d | 1 | 0.70mi |
| 3919 Wisteria Ln SW Atlanta, GA | 4.0 | 2.0 | 1126 | $1,730 | $1.54 | 14d | 1 | 0.73mi |
| 451 Fairlock Ln NW Atlanta, GA | 3.0 | 1.0 | 1141 | $1,450 | $1.27 | 24d | 1 | 0.81mi |
| 3590 Collier Dr NW Atlanta, GA | 4.0 | 4.0 | 1110 | $1,100 | $0.99 | 11d | 1 | 0.95mi |
| 87 Howell Dr SW Atlanta, GA | 3.0 | 2.5 | 1840 | $2,700 | $1.47 | 24d | 1 | 1.03mi |
| 95 Howell Dr SW Atlanta, GA | 3.0 | 2.5 | 1840 | $1,840 | $1.00 | 14d | 1 | 1.03mi |
| 3774 Clovis Ct NW Atlanta, GA | 3.0 | 1.0 | 1000 | $1,445 | $1.45 | 22d | 1 | 1.07mi |
| 3456 Thompson Dr NW Atlanta, GA | 3.0 | 1.0 | 975 | $1,750 | $1.79 | 24d | 1 | 1.10mi |
| 3466 Fairlane Dr NW Atlanta, GA | 3.0 | 1.0 | 950 | $1,495 | $1.57 | 24d | 1 | 1.16mi |
| 3537 Fairburn Pl NW Atlanta, GA | 2.0 | 1.0 | 1484 | $2,000 | $1.35 | 24d | 1 | 1.19mi |
| 3610 Bolfair Dr NW Atlanta, GA | 3.0 | 1.5 | 1178 | $1,900 | $1.61 | 24d | 1 | 1.33mi |
| 3354 Delmar Ln NW Atlanta, GA | 3.0 | 2.0 | 1170 | $1,700 | $1.45 | 24d | 1 | 1.34mi |
| 415 Fairburn Rd SW Atlanta, GA | 1.0–3.0 | 1.0–2.0 | 890 | $1,490 | $1.67 | 2d | 31 | 1.36mi |
| 3566 Bolfair Dr NW Atlanta, GA | 3.0 | 2.0 | 1192 | $1,595 | $1.34 | 14d | 1 | 1.39mi |
| 841 Ambient Way SW Atlanta, GA | 2.0 | 2.5 | 1344 | $1,895 | $1.41 | 17d | 1 | 1.43mi |
| 494 Plainville Dr SW Atlanta, GA | 3.0 | 2.0 | 1567 | $2,400 | $1.53 | 24d | 1 | 1.44mi |
| 832 Ambient Way SW Atlanta, GA | 2.0 | 2.5 | 1500 | $2,250 | $1.50 | 24d | 1 | 1.45mi |
| 842 Bonneville Ter NW Atlanta, GA | 2.0 | 2.0 | 1100 | $1,855 | $1.69 | 24d | 1 | 1.45mi |
| 900 Society Cir SW Atlanta, GA | 4.0 | 3.5 | 1710 | $2,500 | $1.46 | 24d | 1 | 1.47mi |
| 755 Crestwell Cir SW Atlanta, GA | 2.0 | 2.5 | 1546 | $1,800 | $1.16 | 24d | 1 | 1.47mi |
| 887 Ambient Way SW Atlanta, GA | 2.0 | 2.5 | 1344 | $2,250 | $1.67 | 24d | 1 | 1.49mi |
| 722 Crestwell Cir #722 Atlanta, GA | 2.0 | 3.0 | 1440 | $2,279 | $1.58 | 21d | 1 | 1.50mi |
Listing history 18 events
-
2026-06-13statusdays on market $169,900 Under Contract 97 DOM
-
2026-06-09days on market $169,900 Active 95 DOM
-
2026-06-08days on market $169,900 Active 94 DOM
-
2026-06-07days on market $169,900 Active 93 DOM
-
2026-06-04days on market $169,900 Active 90 DOM
-
2026-06-03days on market $169,900 Active 89 DOM
-
2026-06-02days on market $169,900 Active 88 DOM
-
2026-06-01days on market $169,900 Active 87 DOM
-
2026-05-31days on market $169,900 Active 86 DOM
-
2026-05-19status Back On Market 178-char remark
Show marketing remark (178 chars)
Solid cozy single story all brick ranch home is 1404 sq ft. Has 3 bedrooms, one bath. Open back yard, ready for move in. Come make this your home. Easy to renovate and customize.
-
2026-05-15historical Active Under Contract 178-char remark
Show marketing remark (178 chars)
Solid cozy single story all brick ranch home is 1404 sq ft. Has 3 bedrooms, one bath. Open back yard, ready for move in. Come make this your home. Easy to renovate and customize.
-
2026-05-09price $169,900 178-char remark
Show marketing remark (178 chars)
Solid cozy single story all brick ranch home is 1404 sq ft. Has 3 bedrooms, one bath. Open back yard, ready for move in. Come make this your home. Easy to renovate and customize.
-
2026-04-25price $174,900 178-char remark
Show marketing remark (178 chars)
Solid cozy single story all brick ranch home is 1404 sq ft. Has 3 bedrooms, one bath. Open back yard, ready for move in. Come make this your home. Easy to renovate and customize.
-
2026-04-17price $179,900 178-char remark
Show marketing remark (178 chars)
Solid cozy single story all brick ranch home is 1404 sq ft. Has 3 bedrooms, one bath. Open back yard, ready for move in. Come make this your home. Easy to renovate and customize.
-
2026-03-06$184,900 New 178-char remark
Show marketing remark (178 chars)
Solid cozy single story all brick ranch home is 1404 sq ft. Has 3 bedrooms, one bath. Open back yard, ready for move in. Come make this your home. Easy to renovate and customize.
-
2022-04-27soldstatus $172,000
-
2004-07-19soldstatus $108,000
-
2002-03-19soldstatus $77,500
ⓘ Source: listings_history table (triggers on properties + properties_extension) + one-shot
backfill from property_details.listing_events for pre-trigger history.
Tax reassessment forecast GA · Resets to sale price
- Current annual tax
- $2,891 · $241/mo
- Projected year-2 tax
- $2,891 · $241/mo
- Expected delta
- $0/yr ($0/mo · 0.0%)
ⓘ Screening estimate from a state-policy table — verify with the county assessor before closing.
Climate risk First Street
- Flood 1/10 Low FEMA zone X (unshaded) · 0% chance over 30 yrs
- Wildfire 3/10 Moderate
- Heat 5/10 Major 7 d/yr ≥103°F today · 17 d/yr by 30 yrs out
- Wind 4/10 Moderate 23% chance of damaging wind over 30 yrs
- Air quality 4/10 Moderate 3 unhealthy d/yr today · 5 by 30 yrs out
Nearby sold comps map
Loading sold comps map…
Walkable amenities ~0.75 mi
Loading nearby amenities…
Taxation est. · year 1
- Rental income
- $21,879
- − Mortgage interest
- −$9,517
- − Property taxes
- −$2,891
- − Insurance
- −$850
- − Repairs & maintenance
- −$1,750
- − Management
- −$1,750
- − Depreciation
- −$4,943
- Taxable income
- $178
- Est. tax owed @ 24.0%
- −$43
- After-tax cash flow
- $2,809/yr
For passive investors: Depreciation is non-cash, so a rental often shows a tax loss while cash-flowing — sheltering income. Rental losses are passive: they offset passive income freely, and up to $25,000/yr can offset ordinary (W-2) income if you actively participate and your MAGI is under $100k (phasing out to $0 by $150k); unused losses carry forward. On sale, claimed depreciation is recaptured at up to 25%, and gains may owe capital-gains tax (a 1031 exchange can defer both). Figures are a year-1 estimate at your 24.0% rate — not tax advice; consult a CPA.
Schools (NCES district)
- District
- Atlanta Public Schools
- NCES district ID
- 1300120
- Math proficiency
- 28% ▼ -6.00%
- Reading proficiency
- 35% ▼ -2.00%
- Median HH income
- $48,306
- Composite
- 27.27/100
- National rank
- #7006
- State rank
- #80 of 174 in GA
Livability — Atlanta
- Score
- 83/100
- State rank
- #6
- US rank
- #919
Category grades
Schools grade is shown separately in the Schools card above.
Census & demographics
- Census place
- Atlanta, GA
- County
- Fulton County · 1,094,430 people
- City population
- 629,525
- Metro
- Atlanta-Sandy Springs-Alpharetta, GA
- Population (ZIP)
- 62,567
- Household income
- $62,623
- Rent vs Own
- Severe rent burden
- 3748.0
Population outlook (Fulton County) Hauer SSP2
- Today (2025)
- 1,203,707 people
- By 2030
- 1,299,706 · +8.0%
- By 2040
- 1,488,256 · +23.6%
- By 2050
- 1,664,580 · +38.3%
- By 2075
- 2,036,072 · +69.2%
- By 2100
- 2,222,402 · +84.6%
Race, ethnicity, and origin ACS 2023
- Neighborhood character
- Predominantly Black (94%)
- Race & ethnicity
- Black 94% Two or more races 3% Hispanic / Latino 2%
- Common ancestry
- Hispanic 1%
- Foreign-born
- 4% · Canada
- Languages at home
- 95% English-only · Spanish 1% French/Haitian/Cajun 1%
Political lean MEDSL · Fulton
- 2024 margin
- Solid D (+44.9) · D 71.9% · R 27.0% · Other 1.1%
- 2008→2024 swing
- +9.8pp toward D · 2008: 35.0pp · 2024: 44.9pp
- All cycles
- 2024: D+44.9 2020: D+46.4 2016: D+42.1 2012: D+29.6 2008: D+35.0
Not yet ingested
- Civics
- —
Market trends
- HPI YoY
- ▼ -106.38%
- Current HPI
- 204.5402
- Rent YoY
- ▲ 2.63%
- Metro
- Atlanta-Sandy Springs-Alpharetta, GA
- State GDP YoY
- ▲ 2.66%
- F500 in state
- 28
Industry mix (Fortune 500 HQ in GA)
| Industry | F500 HQs | Revenue |
|---|---|---|
| Paper / Packaging | 2 | $29B |
|
||
| Retail | 1 | $160B |
|
||
| Transportation / Logistics | 1 | $91B |
|
||
| Airlines | 1 | $62B |
|
||
| Consumer Goods | 1 | $47B |
|
||
| Utilities | 1 | $25B |
|
||
Price history
+119.2% since first listed9 events — show timeline
- 2026-05-19 Relisted — GAMLS
- 2026-05-15 Contingent — GAMLS
- 2026-05-09 Price Changed $169,900 GAMLS
- 2026-04-25 Price Changed $174,900 GAMLS
- 2026-04-17 Price Changed $179,900 GAMLS
- 2026-03-06 Listed $184,900 GAMLS
- 2022-04-27 Sold (Public Records) $172,000 Public Records
- 2004-07-19 Sold (Public Records) $108,000 Public Records
- 2002-03-19 Sold (Public Records) $77,500 Public Records
Property tax history
+3.5%/yrLatest (2025): $2,891 · -9.4% YoY. Source: county tax records.
Cash-flow waterfall
monthlySold comps — $/sqft
last 12 mo · ≤1 miLoading sold comps…