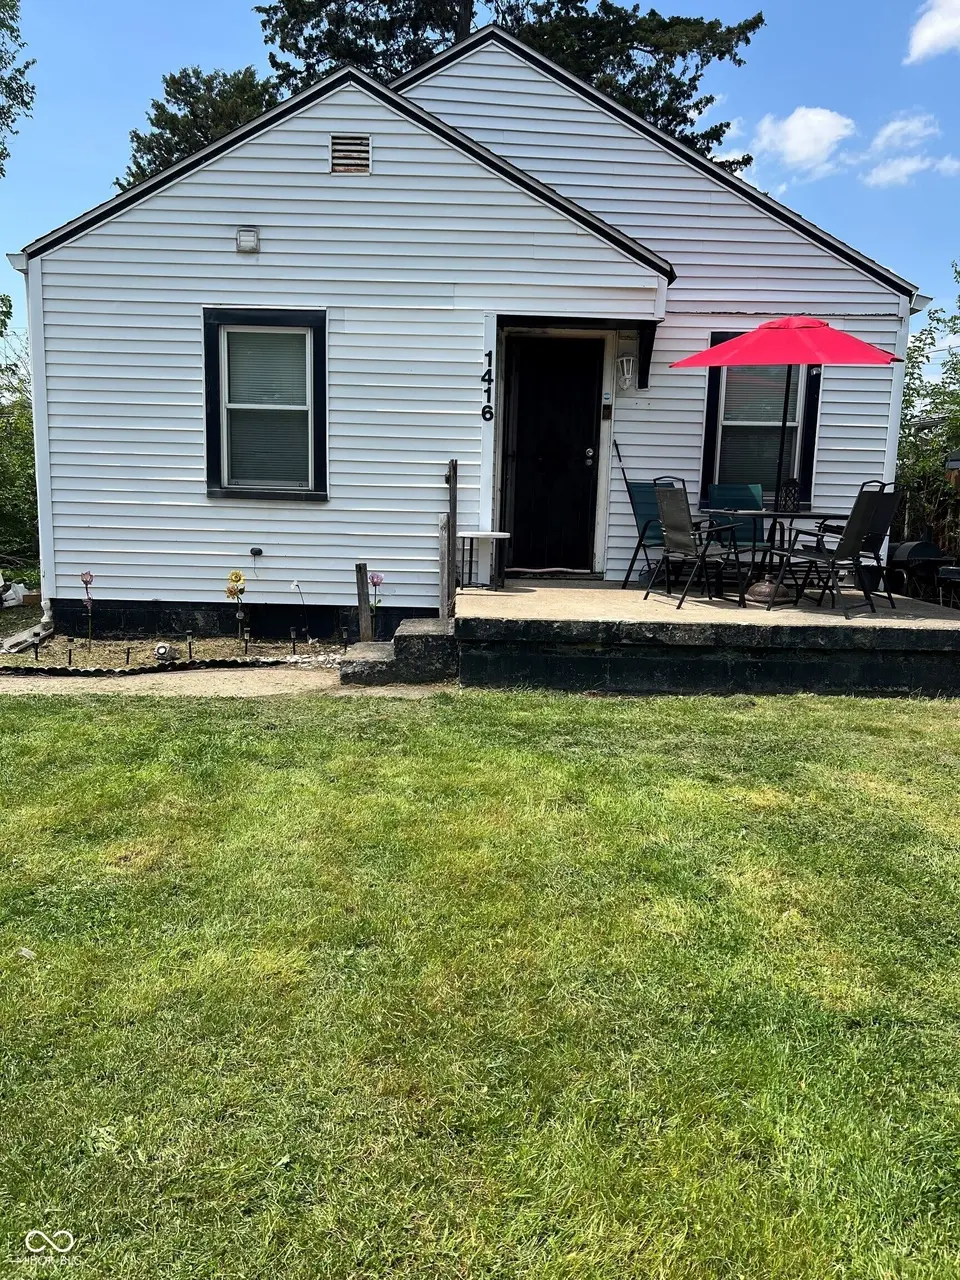
1416 Groff Ave · Indianapolis city (balance), IN
Flood risk 1/10 · Minimal
- FEMA flood zone
- X (unshaded)
- Chance of flooding over 30 yrs
- 0.0%
- Est. flood insurance / yr
- $473 – $860
Fire risk 1/10 · Minimal
- Est. fire insurance / yr
- $717 – $1,331
Heat risk 4/10 · Minor
- Hot days now (above 102°F)
- 7 days/yr
- Hot days in 30 yrs
- 19 days/yr
Wind risk 2/10 · Minimal
- Chance of severe wind over 30 yrs
- 0.0%
Air-quality risk 4/10 · Minor
- Unhealthy air days now
- 5 days/yr
- Unhealthy air days in 30 yrs
- 7 days/yr
Risk factors via First Street. Map © Google.
Why this score? — see what drove the D grade
The composite is a weighted blend of 9 inputs, each scored 0–100. Each bar is that input's sub-score; the figure is the points it added to the 100-point composite (weight × sub-score).
- Cash flow +21.1/30.0
- DSCR +6.7/10.0
- 1% rule +4.5/10.0
- Rent growth +3.1/5.0
- Livability +2.5/5.0
- Condition / age +2.5/5.0
- Schools +1.4/10.0
- ARV discount +0.0/15.0
- Appreciation +0.0/10.0
$115,000
🖨 Deal sheet 📄 Offer letter ✓ Due diligence
Listing remarks MLS
Presenting a compelling opportunity at 1416 Groff Ave. Located on Indianapolis' near west side, this property offers a great opportunity for a buyer looking to build equity or an investor seeking their next project. The location puts you close to downtown, neighborhood parks, and everyday west-side convenience. With redevelopment activity and long-term potential in the surrounding area, this is one worth a look.
Key facts
- 5,532 sq ft lot
- Built 1948
- Listed 57 days
Neighborhood map
What this means for you Summary
Snapshot
- This is a 2-bed/1.0-bath single-family listed at $115k.
Deal economics
- At list price, monthly cash flow is $164 ($2k/yr) — positive.
- The deal already cash-flows at list — no discount required.
- To meet the 1% rule (rent ≥ 1% of price), the offer needs to be $110k (4.8% below list).
- Recommended offer: $110k (4.8% below list) — sets the bar for 1% rule.
- Cap rate 8.0% vs local median 4.4% in Indianapolis city (balance) — top-decile yield for the area; either an underpriced asset or a hidden risk that comps aren't pricing in. Stress-test before assuming the spread holds.
Location & tenants
- Location reads: area grade D — affects rentability + tenant quality, not the cash-flow math above.
- Indianapolis Public Schools (urban): math 14% / reading 20% proficiency, ranked #286 of 301 in IN (top 95%) — low school quality limits family demand, transient renter base, plan for 1-2y turnover; 77% free/reduced lunch — lower-income household profile, screen leases tightly.
- Market conditions: Rents rising (+2.5%/yr); 170 active listings in the ZIP; 11 comparable units currently listed for rent nearby; rentals leasing fast (median 8d on market — plan ~1-2 weeks tenant-placement turnaround); 1,906 units permitted in Marion County in 2024 (621 in 5+ unit buildings).
Forward outlook
- Local home prices are declining (-3.0%/yr); year-one equity from $795 of loan paydown is wiped out by about $3k of value loss. Plan a longer hold.
- Marion County population projected at +18% by 2050 — long-run rental-demand tailwind backs the buy-and-hold thesis.
Negotiation context
- It's been on market 57 days — a 3% lower offer ($112k) is reasonable based on typical stale-listing flexibility.
- 6 sale attempts since 25y ago with the ask held roughly flat each time — persistent listings suggest the price (not the market) is what's stuck; bring a comps-based counter.
- Current owner paid $12k; list at $115k implies a 858% gain — meaningful room to come down on a strong offer.
Risks & watch-outs
- Watch-outs: built in 1948 — expect roof / HVAC / electrical / plumbing capex.
Questions for the listing agent
- It's been on market 57 days. Have you received any prior offers? Is the seller open to a 5% concession, seller financing, or rate buy-down credit?
- Built in 1948 — when were the roof, HVAC, electrical panel, plumbing, and water heater last replaced?
- Is there a deadline driving the sale (1031 exchange, divorce, estate, relocation)? That informs how much negotiation room exists.
- The area grade is low — what's the realistic commute time and amenity access for the typical tenant pool here? Any planned neighborhood developments (good or bad) we should know about?
- What's the average days-on-market for RENTAL listings here right now (not sales)? A rising rental-DOM trend means longer vacancies and softer asking-rent achievability than the comps imply.
- What's the recent tenant-quality profile in this submarket — average credit score on applications, eviction rate, late-payment / NSF rate, and stable-employment percentage? A property-management company in the area should have these aggregated.
- How much new for-sale + rental construction is in the pipeline within 1–3 miles? Heavy new supply typically softens prices + rents 12–24 months out; constrained supply supports both.
Investment metrics
- 1% rule
- 0.95% ✗
- Cap rate
- 8.00%
- Cash-on-cash
- 6.10%
- DSCR
- 1.27
- GRM
- 8.8
CMA / ARV
- ARV (median comp)
- $87,507
- List price
- $115,000
- Delta
- 31.42%
- Verdict
- OVERPRICED
- Comps
- 20 within 1.0 mi
Show comp detail 12 sales within ~0.75 mi
| Address | Dist | Beds/Ba | Sqft | Sold | Price | $/sf | Match |
|---|---|---|---|---|---|---|---|
| 1209 N Centennial St | 0.15mi | 2/1.0 | 732 (-2%) | 3mo | $140,000 | $191 | 88 |
| 1169 N Goodlet Ave | 0.21mi | 2/1.0 | 725 (-3%) | 5mo | $129,000 | $178 | 82 |
| 1248 N Rochester Ave | 0.36mi | 3/1.0 (+1) | 720 (-3%) | 2mo | $66,500 | $92 | 71 |
| 1225 N Somerset Ave | 0.40mi | 2/1.0 | 720 (-3%) | 8mo | $93,000 | $129 | 69 |
| 1143 Sharon Ave | 0.41mi | 2/1.0 | 775 (+4%) | 10mo | $69,000 | $89 | 66 |
| 3335 W 9th St | 0.48mi | 2/1.0 | 720 (-3%) | 9mo | $34,000 | $47 | 64 |
| 2010 N Exeter Ave | 0.59mi | 2/1.0 | 736 (-1%) | 8mo | $140,000 | $190 | 64 |
| 2020 N Alton Ave | 0.54mi | 2/1.0 | 792 (+6%) | 2mo | $85,000 | $107 | 62 |
| 2225 N Centennial St | 0.70mi | 2/1.0 | 725 (-3%) | 2mo | $140,000 | $193 | 62 |
| 1954 N Exeter Ave | 0.55mi | 2/1.0 | 832 (+12%) | 1mo | $72,000 | $87 | 54 |
| 929 Olin Ave | 0.73mi | 3/1.0 (+1) | 720 (-3%) | 7mo | $130,000 | $181 | 50 |
| 2036 N Somerset Ave | 0.68mi | 2/1.0 | 816 (+10%) | 10mo | $139,900 | $171 | 44 |
Match score weights: distance 35% · size 25% · config 20% · recency 20%. Top-matched comps best support the ARV.
Projected returns pro-forma
-3.0% appreciation · 2.46% rent growth · sell at horizon
- IRR
- -7.5%
- Equity multiple
- 0.73×
- Total profit
- $-8,844
- Equity at exit
- $17,147
- IRR
- 1.4%
- Equity multiple
- 1.10×
- Total profit
- $3,152
- Equity at exit
- $9,943
Cash invested: $32,200 (down + closing). Projections, not guarantees.
Landlord ↔ Tenant lean methodology
- Overall (STATE)
- 90 Strongly Landlord-Friendly
- State Indiana
- 90 Strongly Landlord-Friendly · R+11
- County
- — inherits STATE
- City
- — inherits STATE
ZIP-level market 46222
- Home prices YoY
- -16.7%
- Rents YoY
- 2.5%
- Active inventory
- 170
- Price-to-rent
- 8.8×
Monthly cashflow live
- Estimated rent
- $1,095 high interval (Pro) →
- Mortgage (P&I)
- −$603
- Tax from tax record
- −$51 /mo · $607/yr
- Insurance
- −$48
- HOA
- −$0
- Vacancy / Maint / Mgmt
- −$230
- Net cashflow
- $164
Break-even live
UW: 25.0% down · 7.5% · 30yr · 1.5% tax · 5.0% vac · 8.0% maint · 8.0% mgmt
Financing live
Cash to close
- Down payment
- $28,750
- Closing costs
- $3,450
- Reserves months
- —
- Total cash needed
- —
Loan-product check · same deal, 3 products live
Conventional
25% down · 7.5% · 30yr
- Down + closing
- —
- Monthly P&I
- —
- Monthly cashflow
- —
- DSCR
- —
- Eligible?
- —
Personal DTI + credit; lowest rate.
DSCR
20% down · 8.5% · 30yr
- Down + closing
- —
- Monthly P&I
- —
- Monthly cashflow
- —
- DSCR
- —
- Eligible?
- —
No personal income docs; deal must DSCR.
Hard money
10% down · 12.0% · 12mo
- Down + closing
- —
- Monthly P&I
- —
- Monthly cashflow
- —
- DSCR
- —
- Eligible?
- —
Short-term bridge; refi at stabilization.
Rent comps 11 comps
| Address | Beds | Baths | Sqft | Rent | $/sqft | DOM | Units | Dist |
|---|---|---|---|---|---|---|---|---|
| 1165 N Concord St Indianapolis, IN | 1.0 | 1.0 | 695 | $775 | $1.12 | 43d | 1 | 0.28mi |
| 2014 N Exeter Ave Indianapolis, IN | 2.0 | 1.0 | 660 | $1,295 | $1.96 | 7d | 1 | 0.62mi |
| 771 Haugh St Indianapolis, IN | 2.0 | 1.0 | 714 | $1,250 | $1.75 | 19d | 1 | 0.67mi |
| 1411 N Pershing Ave Indianapolis, IN | 1.0 | 1.0 | 700 | $850 | $1.21 | 43d | 1 | 0.83mi |
| 3621 Lawnview Ln Indianapolis, IN | 1.0–4.0 | 1.0–1.5 | 1012 | $1,026 | $1.01 | 1d | 13 | 0.90mi |
| 411 N Centennial St Indianapolis, IN | 2.0 | 1.0 | 750 | $995 | $1.33 | 7d | 1 | 0.93mi |
| 2774 Pixel DR Indianapolis, IN | 1.0 | 1.0 | 750 | $1,100 | $1.47 | 43d | 1 | 0.98mi |
| 2418 N Centennial St Indianapolis, IN | 2.0 | 1.0 | 725 | $1,099 | $1.52 | 43d | 1 | 1.00mi |
| 1150 N White River Pkwy West Dr Indianapolis, IN | 1.0–2.0 | 1.0 | 722 | $1,224 | $1.69 | 1d | 9 | 1.30mi |
| 1545 N Main St Speedway, IN | 1.0–2.0 | 1.0–2.0 | 891 | $1,972 | $2.21 | 7d | 9 | 1.37mi |
| 1510 Stadium Way Unit 220 Indianapolis, IN | 1.0 | 1.0 | 665 | $1,365 | $2.05 | 7d | 1 | 1.38mi |
Listing history 25 events
-
2026-06-18days on market $115,000 Active 57 DOM
-
2026-06-17days on market $115,000 Active 56 DOM
-
2026-06-16days on market $115,000 Active 55 DOM
-
2026-06-15days on market $115,000 Active 54 DOM
-
2026-06-13days on market $115,000 Active 52 DOM
-
2026-06-13days on market $115,000 Active 51 DOM
-
2026-06-09days on market $115,000 Active 48 DOM
-
2026-06-08days on market $115,000 Active 47 DOM
-
2026-06-07days on market $115,000 Active 46 DOM
-
2026-06-03days on market $115,000 Active 42 DOM
-
2026-06-02days on market $115,000 Active 41 DOM
-
2026-06-01days on market $115,000 Active 40 DOM
-
2026-05-31days on market $115,000 Active 39 DOM
-
2026-04-22$115,000 Active 415-char remark
Show marketing remark (415 chars)
Presenting a compelling opportunity at 1416 Groff Ave. Located on Indianapolis' near west side, this property offers a great opportunity for a buyer looking to build equity or an investor seeking their next project. The location puts you close to downtown, neighborhood parks, and everyday west-side convenience. With redevelopment activity and long-term potential in the surrounding area, this is one worth a look.
-
2012-05-04historical 204-char remark
Show marketing remark (204 chars)
Own your own piece of Hollywood right here in Indianapolis! This 3 bedroom, 1 bathroom home is priced to sell. Don't miss out on this opportunity in Wayne township. This is a Fannie Mae Homepath property.
-
2012-05-04soldstatus $12,000 204-char remark
Show marketing remark (204 chars)
Own your own piece of Hollywood right here in Indianapolis! This 3 bedroom, 1 bathroom home is priced to sell. Don't miss out on this opportunity in Wayne township. This is a Fannie Mae Homepath property.
-
2012-03-05$10,300 204-char remark
Show marketing remark (204 chars)
Own your own piece of Hollywood right here in Indianapolis! This 3 bedroom, 1 bathroom home is priced to sell. Don't miss out on this opportunity in Wayne township. This is a Fannie Mae Homepath property.
-
2006-01-06historical
-
2005-09-06$62,900
-
2003-04-22historical
-
2002-10-22$52,900
-
2002-06-24historical
-
2002-02-25$54,900
-
2001-12-11historical
-
2001-06-13$54,900
ⓘ Source: listings_history table (triggers on properties + properties_extension) + one-shot
backfill from property_details.listing_events for pre-trigger history.
Tax reassessment forecast IN · Partial reset (capped growth)
- Current annual tax
- $607 · $51/mo
- Projected year-2 tax
- $792 · $66/mo
- Expected delta
- +$185/yr (+$15/mo · 30.6%)
ⓘ Screening estimate from a state-policy table — verify with the county assessor before closing.
Climate risk First Street
- Flood 1/10 Low FEMA zone X (unshaded) · 0% chance over 30 yrs
- Wildfire 1/10 Low
- Heat 4/10 Moderate 7 d/yr ≥102°F today · 19 d/yr by 30 yrs out
- Wind 2/10 Low 0% chance of damaging wind over 30 yrs
- Air quality 4/10 Moderate 5 unhealthy d/yr today · 7 by 30 yrs out
Nearby sold comps map
Loading sold comps map…
Walkable amenities ~0.75 mi
Loading nearby amenities…
Taxation est. · year 1
- Rental income
- $13,142
- − Mortgage interest
- −$6,442
- − Property taxes
- −$607
- − Insurance
- −$575
- − Repairs & maintenance
- −$1,051
- − Management
- −$1,051
- − Depreciation
- −$3,345
- Taxable income
- $71
- Est. tax owed @ 24.0%
- −$17
- After-tax cash flow
- $1,947/yr
For passive investors: Depreciation is non-cash, so a rental often shows a tax loss while cash-flowing — sheltering income. Rental losses are passive: they offset passive income freely, and up to $25,000/yr can offset ordinary (W-2) income if you actively participate and your MAGI is under $100k (phasing out to $0 by $150k); unused losses carry forward. On sale, claimed depreciation is recaptured at up to 25%, and gains may owe capital-gains tax (a 1031 exchange can defer both). Figures are a year-1 estimate at your 24.0% rate — not tax advice; consult a CPA.
Schools (NCES district)
- District
- Indianapolis Public Schools
- NCES district ID
- 1804770
- Math proficiency
- 14% ▼ -7.00%
- Reading proficiency
- 20% ▼ -3.00%
- Median HH income
- $32,034
- Composite
- 13.69/100
- National rank
- #9499
- State rank
- #286 of 301 in IN
Livability — Indianapolis city (balance)
No livability data for this city. (Only ~50 U.S. cities are tracked.)
Census & demographics
- Census place
- Indianapolis city (balance), IN
- County
- Marion County · 998,460 people
- City population
- 881,119
- Metro
- Indianapolis-Carmel-Anderson, IN
- Population (ZIP)
- 38,887
- Household income
- $50,783
- Rent vs Own
- Severe rent burden
- 1750.0
Population outlook (Marion County) Hauer SSP2
- Today (2025)
- 1,025,572 people
- By 2030
- 1,065,727 · +3.9%
- By 2040
- 1,141,577 · +11.3%
- By 2050
- 1,208,920 · +17.9%
- By 2075
- 1,367,288 · +33.3%
- By 2100
- 1,438,201 · +40.2%
Race, ethnicity, and origin ACS 2023
- Neighborhood character
- Highly diverse neighborhood (Simpson 0.72)
- Race & ethnicity
- White 32% Black 30% Hispanic / Latino 30% Two or more races 12% Asian 2%
- Hispanic origin (detail)
- Mexican 24% Puerto Rican 1%
- Common ancestry
- Lithuanian 1% Iranian 1% Slovak 1%
- Foreign-born
- 21% · Canada, Jamaica
- Languages at home
- 67% English-only · Spanish 25% Other Indo-European 3% Arabic 2%
Political lean MEDSL · Marion
- 2024 margin
- Strong D (+27.7) · D 63.0% · R 35.3% · Other 1.7%
- 2008→2024 swing
- -0.7pp no change · 2008: 28.4pp · 2024: 27.7pp
- All cycles
- 2024: D+27.7 2020: D+29.1 2016: D+22.8 2012: D+22.2 2008: D+28.4
Not yet ingested
- Civics
- —
Market trends
- HPI YoY
- ▼ -75.47%
- Current HPI
- 375.8479
- Rent YoY
- ▲ 2.46%
- Metro
- Indianapolis-Carmel-Anderson, IN
- State GDP YoY
- ▲ 2.90%
- F500 in state
- 18
Industry mix (Fortune 500 HQ in IN)
| Industry | F500 HQs | Revenue |
|---|---|---|
| Industrial Machinery | 2 | $37B |
|
||
| Healthcare | 1 | $177B |
|
||
| Pharmaceuticals | 1 | $45B |
|
||
| Metals / Steel | 1 | $18B |
|
||
| Agriculture | 1 | $17B |
|
||
| Packaging | 1 | $12B |
|
||
Price history
+109.5% since first listed12 events — show timeline
- 2026-04-22 Listed $115,000 MIBOR as Distributed by MLS Grid
- 2012-05-04 Listing Removed — MIBOR as Distributed by MLS Grid
- 2012-05-04 Sold (MLS) $12,000 MIBOR as Distributed by MLS Grid
- 2012-03-05 Listed $10,300 MIBOR as Distributed by MLS Grid
- 2006-01-06 Listing Removed — MIBOR as Distributed by MLS Grid
- 2005-09-06 Listed $62,900 MIBOR as Distributed by MLS Grid
- 2003-04-22 Listing Removed — MIBOR as Distributed by MLS Grid
- 2002-10-22 Listed $52,900 MIBOR as Distributed by MLS Grid
- 2002-06-24 Listing Removed — MIBOR as Distributed by MLS Grid
- 2002-02-25 Listed $54,900 MIBOR as Distributed by MLS Grid
- 2001-12-11 Listing Removed — MIBOR as Distributed by MLS Grid
- 2001-06-13 Listed $54,900 MIBOR as Distributed by MLS Grid
Property tax history
+13.8%/yrLatest (2025): $607 · +14.4% YoY. Source: county tax records.
Cash-flow waterfall
monthlySold comps — $/sqft
last 12 mo · ≤1 miLoading sold comps…