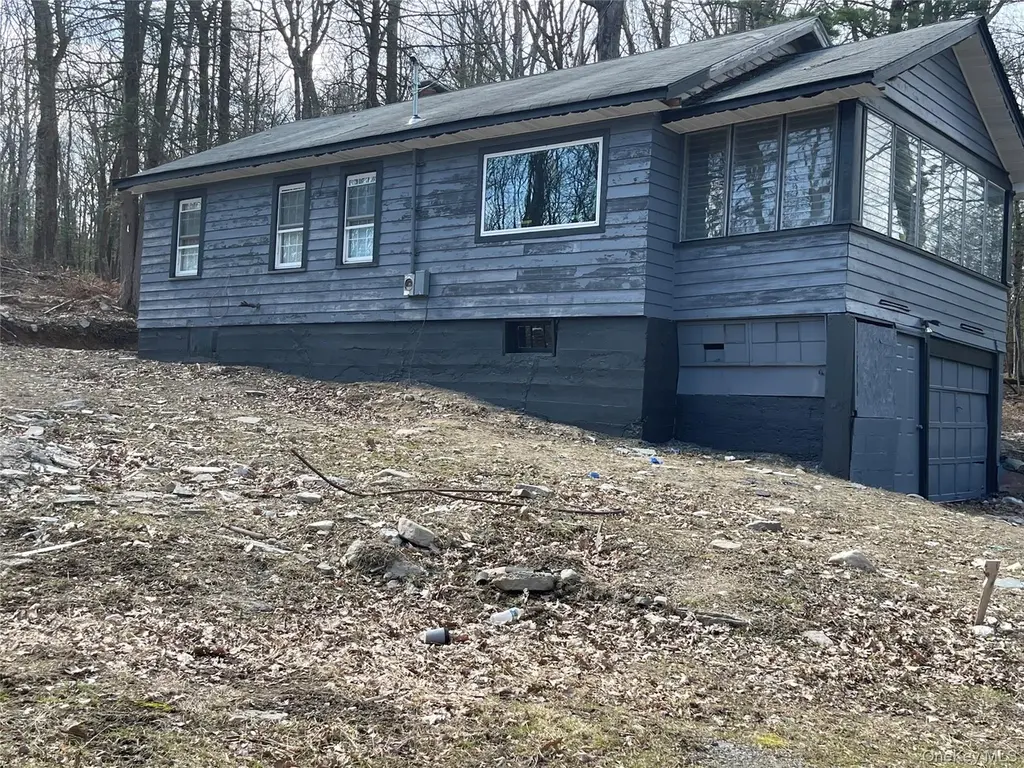
20 Jersey Rd · Rock Hill, NY
Flood risk 1/10 · Minimal
- FEMA flood zone
- X (unshaded)
- Chance of flooding over 30 yrs
- 0.0%
- Est. flood insurance / yr
- $473 – $860
Fire risk 5/10 · Moderate
- Est. fire insurance / yr
- $691 – $1,283
Heat risk 2/10 · Minimal
- Hot days now (above 95°F)
- 7 days/yr
- Hot days in 30 yrs
- 15 days/yr
Wind risk 3/10 · Minor
- Chance of severe wind over 30 yrs
- 7.0%
Air-quality risk 2/10 · Minimal
- Unhealthy air days now
- 1 days/yr
- Unhealthy air days in 30 yrs
- 1 days/yr
Risk factors via First Street. Map © Google.
Why this score? — see what drove the B+ grade
The composite is a weighted blend of 9 inputs, each scored 0–100. Each bar is that input's sub-score; the figure is the points it added to the 100-point composite (weight × sub-score).
- Cash flow +30.0/30.0
- 1% rule +10.0/10.0
- DSCR +10.0/10.0
- Appreciation +10.0/10.0
- ARV discount +7.5/15.0
- Livability +3.5/5.0
- Rent growth +2.5/5.0
- Schools +2.5/10.0
- Condition / age +2.5/5.0
$115,000
🖨 Deal sheet 📄 Offer letter ✓ Due diligence
Listing remarks MLS
Opportunity awaits in Wurtsboro! This property is perfect for investors or buyers looking to complete a project. The seller began renovations but is unable to finish—bring your vision and make it your own. Being sold together with the adjacent lot for added value and potential. Conveniently located near Yankee Lake and just 10 minutes from Main Street shops, dining, and local amenities.
Key facts
- 0.28 acre lot
- Garage
- Built 1920
Neighborhood map
What this means for you Summary
Snapshot
- This is a 3-bed/1.0-bath single-family listed at $115k.
Deal economics
- At list price, monthly cash flow is $603 ($7k/yr) — positive.
- The deal already cash-flows at list — no discount required.
- Meets the 1% rule at list price ($2k rent vs $115k).
- Recommended offer: $108k (6.0% below list) — sets the bar for market timing.
- Cap rate 12.6% vs local median 2.6% in Rock Hill — top-decile yield for the area; either an underpriced asset or a hidden risk that comps aren't pricing in. Stress-test before assuming the spread holds.
Location & tenants
- Location reads 69/100 on livability (#478 in NY) — a middle-class / working-renter tenant base. Strengths: crime A+, employment A+, housing A+; Watch: schools C-, cost of living D+, amenities F.
- Monticello Central School District (town): math 29% / reading 30% proficiency, ranked #577 of 590 in NY (top 98%) — low school quality limits family demand, transient renter base, plan for 1-2y turnover.
- Market conditions: 109 active listings in the ZIP; 739 units permitted in Sullivan County in 2024 (5 in 5+ unit buildings).
Forward outlook
- In year one you build about $12k of equity ($795 loan paydown + $12k appreciation (10.0% local appreciation)).
- Sullivan County population projected at -24% by 2050 — secular population decline; favor cash flow + early exit over multi-decade hold.
- At projected returns (10.0% appreciation + 3.0% rent growth), your $32k cash investment doubles in ~2 years — after that, you're playing with house money.
- By year 3, paydown + projected appreciation supports a ~$31k cash-out refi (75% LTV) — recoverable capital for the next deal without selling this one.
Negotiation context
- It's been on market 77 days — a 6% lower offer ($108k) is reasonable based on typical stale-listing flexibility.
Risks & watch-outs
- Watch-outs: built in 1920 — expect roof / HVAC / electrical / plumbing capex.
- Climate carrying-cost: moderate wildfire risk — expect insurance premiums to compound above CPI over the hold.
Questions for the listing agent
- It's been on market 77 days. Have you received any prior offers? Is the seller open to a 6% concession, seller financing, or rate buy-down credit?
- Built in 1920 — when were the roof, HVAC, electrical panel, plumbing, and water heater last replaced?
- Why hasn't it sold? Are there any deal-killer items the seller is aware of (foundation, flood, title, zoning, code violations)?
- Is there a deadline driving the sale (1031 exchange, divorce, estate, relocation)? That informs how much negotiation room exists.
- What's the average days-on-market for RENTAL listings here right now (not sales)? A rising rental-DOM trend means longer vacancies and softer asking-rent achievability than the comps imply.
- What's the recent tenant-quality profile in this submarket — average credit score on applications, eviction rate, late-payment / NSF rate, and stable-employment percentage? A property-management company in the area should have these aggregated.
- How much new for-sale + rental construction is in the pipeline within 1–3 miles? Heavy new supply typically softens prices + rents 12–24 months out; constrained supply supports both.
Investment metrics
- 1% rule
- 1.51% ✓
- Cap rate
- 12.59%
- Cash-on-cash
- 22.47%
- DSCR
- 2.00
- GRM
- 5.5
CMA / ARV
- ARV (median comp)
- $290,346
- List price
- $115,000
- Delta
- -60.39%
- Verdict
- UNDERPRICED
- Comps
- 6 within 1.0 mi
Show comp detail 2 sales within ~0.75 mi
| Address | Dist | Beds/Ba | Sqft | Sold | Price | $/sf | Match |
|---|---|---|---|---|---|---|---|
| 94 Sickle Rd | 0.17mi | 2/1.0 (-1) | 768 (+7%) | 6mo | $115,000 | $150 | 71 |
| 8 Clipper Dr | 0.66mi | 2/2.0 (-1) | 801 (+11%) | 20mo | $449,000 | $561 | 25 |
Match score weights: distance 35% · size 25% · config 20% · recency 20%. Top-matched comps best support the ARV.
Projected returns pro-forma
10.0% appreciation · 3.0% rent growth · sell at horizon
- IRR
- 41.1%
- Equity multiple
- 4.14×
- Total profit
- $101,049
- Equity at exit
- $103,601
- IRR
- 35.5%
- Equity multiple
- 9.30×
- Total profit
- $267,382
- Equity at exit
- $223,420
Cash invested: $32,200 (down + closing). Projections, not guarantees.
Landlord ↔ Tenant lean methodology
- Overall (STATE)
- 15 Strongly Tenant-Friendly
- State New York
- 15 Strongly Tenant-Friendly · D+10
- County
- — inherits STATE
- City
- — inherits STATE
ZIP-level market 12790
- Home prices YoY
- 26.8%
- Active inventory
- 109
- Price-to-rent
- 5.5×
Monthly cashflow live
- Estimated rent
- $1,731 medium interval (Pro) →
- Mortgage (P&I)
- −$603
- Tax from tax record
- −$113 /mo · $1,362/yr
- Insurance
- −$48
- HOA
- −$0
- Vacancy / Maint / Mgmt
- −$364
- Net cashflow
- $603
Break-even live
UW: 25.0% down · 7.5% · 30yr · 1.5% tax · 5.0% vac · 8.0% maint · 8.0% mgmt
Financing live
Cash to close
- Down payment
- $28,750
- Closing costs
- $3,450
- Reserves months
- —
- Total cash needed
- —
Loan-product check · same deal, 3 products live
Conventional
25% down · 7.5% · 30yr
- Down + closing
- —
- Monthly P&I
- —
- Monthly cashflow
- —
- DSCR
- —
- Eligible?
- —
Personal DTI + credit; lowest rate.
DSCR
20% down · 8.5% · 30yr
- Down + closing
- —
- Monthly P&I
- —
- Monthly cashflow
- —
- DSCR
- —
- Eligible?
- —
No personal income docs; deal must DSCR.
Hard money
10% down · 12.0% · 12mo
- Down + closing
- —
- Monthly P&I
- —
- Monthly cashflow
- —
- DSCR
- —
- Eligible?
- —
Short-term bridge; refi at stabilization.
Listing history 17 events
-
2026-06-18days on market $115,000 Active 77 DOM
-
2026-06-17days on market $115,000 Active 76 DOM
-
2026-06-16days on market $115,000 Active 75 DOM
-
2026-06-15days on market $115,000 Active 74 DOM
-
2026-06-14days on market $115,000 Active 72 DOM
-
2026-06-10days on market $115,000 Active 69 DOM
-
2026-06-09days on market $115,000 Active 68 DOM
-
2026-06-08days on market $115,000 Active 67 DOM
-
2026-06-07days on market $115,000 Active 66 DOM
-
2026-06-03days on market $115,000 Active 62 DOM
-
2026-06-02days on market $115,000 Active 61 DOM
-
2026-06-01days on market $115,000 Active 60 DOM
-
2026-05-31days on market $115,000 Active 59 DOM
-
2026-05-31days on market $115,000 Active 58 DOM
-
2026-05-04price $195,000 395-char remark
Show marketing remark (395 chars)
Opportunity awaits in Wurtsboro! This property is perfect for investors or buyers looking to complete a project. The seller began renovations but is unable to finish—bring your vision and make it your own. Being sold together with the adjacent lot for added value and potential. Conveniently located near Yankee Lake and just 10 minutes from Main Street shops, dining, and local amenities.
-
2026-04-03$210,000 Active 395-char remark
Show marketing remark (395 chars)
Opportunity awaits in Wurtsboro! This property is perfect for investors or buyers looking to complete a project. The seller began renovations but is unable to finish—bring your vision and make it your own. Being sold together with the adjacent lot for added value and potential. Conveniently located near Yankee Lake and just 10 minutes from Main Street shops, dining, and local amenities.
-
2026-03-31historical $210,000 395-char remark
Show marketing remark (395 chars)
Opportunity awaits in Wurtsboro! This property is perfect for investors or buyers looking to complete a project. The seller began renovations but is unable to finish—bring your vision and make it your own. Being sold together with the adjacent lot for added value and potential. Conveniently located near Yankee Lake and just 10 minutes from Main Street shops, dining, and local amenities.
ⓘ Source: listings_history table (triggers on properties + properties_extension) + one-shot
backfill from property_details.listing_events for pre-trigger history.
Tax reassessment forecast NY · Partial reset (capped growth)
- Current annual tax
- $1,362 · $113/mo
- Projected year-2 tax
- $1,653 · $138/mo
- Expected delta
- +$291/yr (+$24/mo · 21.4%)
ⓘ Screening estimate from a state-policy table — verify with the county assessor before closing.
Climate risk First Street
- Flood 1/10 Low FEMA zone X (unshaded) · 0% chance over 30 yrs
- Wildfire 5/10 Major
- Heat 2/10 Low 7 d/yr ≥95°F today · 15 d/yr by 30 yrs out
- Wind 3/10 Moderate 7% chance of damaging wind over 30 yrs
- Air quality 2/10 Low 1 unhealthy d/yr today · 1 by 30 yrs out
Nearby sold comps map
Loading sold comps map…
Walkable amenities ~0.75 mi
Loading nearby amenities…
Taxation est. · year 1
- Rental income
- $20,773
- − Mortgage interest
- −$6,442
- − Property taxes
- −$1,362
- − Insurance
- −$575
- − Repairs & maintenance
- −$1,662
- − Management
- −$1,662
- − Depreciation
- −$3,345
- Taxable income
- $5,725
- Est. tax owed @ 24.0%
- −$1,374
- After-tax cash flow
- $5,863/yr
For passive investors: Depreciation is non-cash, so a rental often shows a tax loss while cash-flowing — sheltering income. Rental losses are passive: they offset passive income freely, and up to $25,000/yr can offset ordinary (W-2) income if you actively participate and your MAGI is under $100k (phasing out to $0 by $150k); unused losses carry forward. On sale, claimed depreciation is recaptured at up to 25%, and gains may owe capital-gains tax (a 1031 exchange can defer both). Figures are a year-1 estimate at your 24.0% rate — not tax advice; consult a CPA.
Schools (NCES district)
- District
- Monticello Central School District
- NCES district ID
- 3619740
- Math proficiency
- 29% ▼ -4.00%
- Reading proficiency
- 30% ▼ -2.00%
- Median HH income
- $44,696
- Composite
- 25.28/100
- National rank
- #7491
- State rank
- #577 of 590 in NY
Livability — Rock Hill
- Score
- 69/100
- State rank
- #478
- US rank
- #8452
Category grades
Schools grade is shown separately in the Schools card above.
Census & demographics
- City population
- 2,661
- Population (ZIP)
- 4,341
Population outlook (Sullivan County) Hauer SSP2
- Today (2025)
- 68,974 people
- By 2030
- 65,609 · -4.9%
- By 2040
- 58,878 · -14.6%
- By 2050
- 52,500 · -23.9%
- By 2075
- 39,941 · -42.1%
- By 2100
- 28,880 · -58.1%
Race, ethnicity, and origin ACS 2023
- Neighborhood character
- Predominantly White (79%)
- Race & ethnicity
- White 79% Two or more races 9% Black 6% Hispanic / Latino 6% Asian 4%
- Hispanic origin (detail)
- Puerto Rican 3%
- Common ancestry
- Russian 7% Slovak 5% Scotch-Irish 4%
- Foreign-born
- 8% · Canada
- Languages at home
- 87% English-only · Spanish 3% Chinese 3% Russian/Polish/Slavic 3%
Political lean MEDSL · Sullivan
- 2024 margin
- R (+16.7) · D 41.6% · R 58.4%
- 2008→2024 swing
- -26.2pp toward R · 2008: 9.5pp · 2024: -16.7pp
- All cycles
- 2024: R+16.7 2020: R+9.2 2016: R+13.7 2012: D+10.4 2008: D+9.5
Not yet ingested
- Civics
- —
Market trends
- HPI YoY
- ▲ 95.79%
- Current HPI
- 452.7233
- Rent YoY
- —
- Metro
- —
- State GDP YoY
- ▲ 2.60%
- F500 in state
- 92
Industry mix (Fortune 500 HQ in NY)
| Industry | F500 HQs | Revenue |
|---|---|---|
| Financial Services | 10 | $950B |
|
||
| Consumer Goods | 9 | $162B |
|
||
| Insurance | 4 | $225B |
|
||
| Telecommunications | 2 | $144B |
|
||
| Pharmaceuticals | 2 | $112B |
|
||
| Media / Entertainment | 2 | $69B |
|
||
Price history
-7.1% since first listed3 events — show timeline
- 2026-05-04 Price Changed $195,000 OneKey® MLS as Distributed by MLS Grid
- 2026-04-03 Listed $210,000 OneKey® MLS as Distributed by MLS Grid
- 2026-03-31 Coming Soon $210,000 OneKey® MLS as Distributed by MLS Grid
Property tax history
-0.5%/yrLatest (2025): $1,362 · -0.6% YoY. Source: county tax records.
Cash-flow waterfall
monthlySold comps — $/sqft
last 12 mo · ≤1 miLoading sold comps…