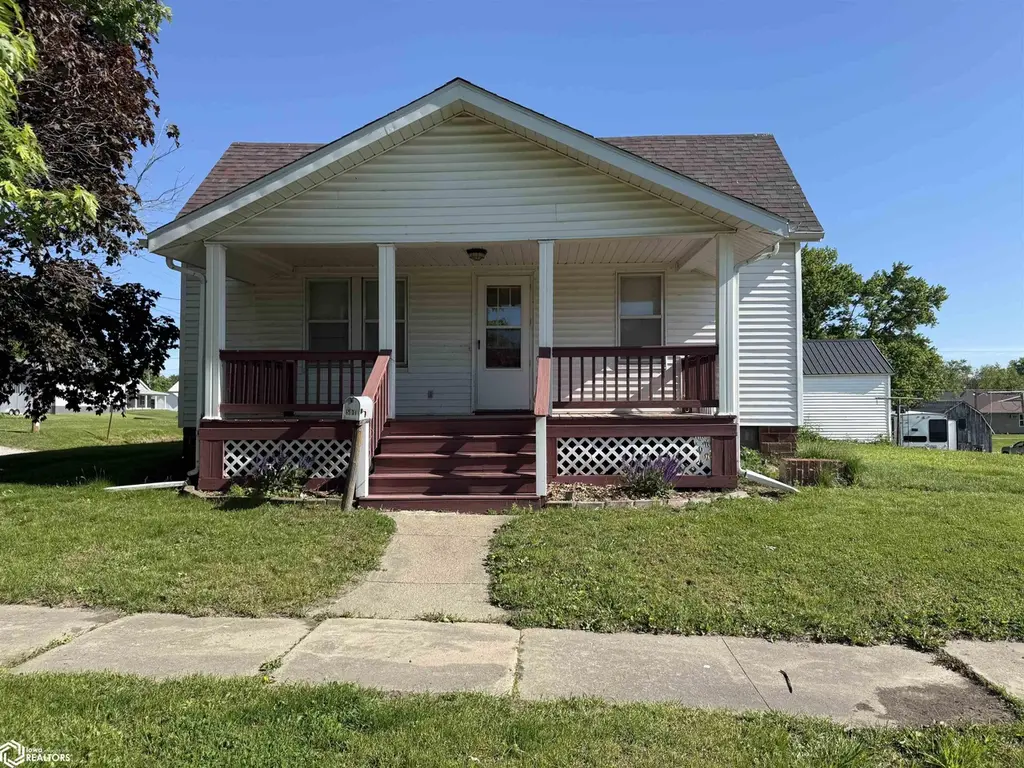
501 E State St · Corydon, IA
Flood risk 1/10 · Minimal
- FEMA flood zone
- X (unshaded)
- Chance of flooding over 30 yrs
- 0.0%
- Est. flood insurance / yr
- $473 – $860
Fire risk 4/10 · Minor
- Est. fire insurance / yr
- $902 – $1,676
Heat risk 3/10 · Minor
- Hot days now (above 103°F)
- 7 days/yr
- Hot days in 30 yrs
- 15 days/yr
Wind risk 2/10 · Minimal
- Chance of severe wind over 30 yrs
- —
Air-quality risk 2/10 · Minimal
- Unhealthy air days now
- 1 days/yr
- Unhealthy air days in 30 yrs
- 3 days/yr
Risk factors via First Street. Map © Google.
Why this score? — see what drove the B- grade
The composite is a weighted blend of 9 inputs, each scored 0–100. Each bar is that input's sub-score; the figure is the points it added to the 100-point composite (weight × sub-score).
- Cash flow +21.9/30.0
- ARV discount +10.3/15.0
- Appreciation +10.0/10.0
- DSCR +7.0/10.0
- Schools +6.0/10.0
- 1% rule +5.3/10.0
- Livability +4.2/5.0
- Rent growth +2.5/5.0
- Condition / age +2.5/5.0
$105,000
🖨 Deal sheet (PDF) 📄 Offer letter ✓ Due diligence
Listing remarks MLS
Updated 3-Bedroom Home on a Corner Lot! This well-maintained 3-bedroom, 1-bath home offers the perfect mix of character, updates, and peace of mind. With major improvements already completed, you can move in knowing the big-ticket items have been taken care of! ? Updates & Features Include: • NEW Roof (2025) with Transferable Warranty • Basement Walls Professionally Anchored (2023) with Transferable Warranty • NEW Furnace (2023) • NEW Water Heater (2023) • Updated Bathroom • Beautiful Hardwood Flooring • Corner Lot • 1-Car Detached Garage • Spacious Outdoor Area Whether you’re a first-time buyer, downsizing, or searching for a move-in-ready home with lasting value, this property is one you’ll want to see. Monthly Electric Average is: $ 200.51 Monthly Gas Average is: $ 45.14
Key facts
- New furnace
- New water heater
- New roof
Tags
Neighborhood map
What this means for you Summary
Snapshot
- This is a 3-bed/1.0-bath single-family listed at $105k.
Deal economics
- At list price, monthly cash flow is $166 ($2k/yr) — positive.
- The deal already cash-flows at list — no discount required.
- Meets the 1% rule at list price ($1k rent vs $105k).
- Recommended offer: $92k (12.0% below list) — sets the bar for market timing.
Location & tenants
- Location reads 83/100 on livability (#33 in IA, #995 nationally) — a professional / high-income tenant draw. Strengths: crime A+, cost of living A+, housing A+; Watch: amenities F, commute F.
- Wayne Community School District (rural): math 69% / reading 74% proficiency, ranked #139 of 289 in IA (top 48%) — strong family-tenant draw, lease renewals of 3-5y typical.
- Market conditions: 13 active listings in the ZIP; 1 comparable units currently listed for rent nearby; 6 units permitted in Wayne County in 2024 (0 in 5+ unit buildings).
Forward outlook
- In year one you build about $11k of equity ($726 loan paydown + $10k appreciation (10.0% local appreciation)).
- Wayne County population projected to shrink 8% by 2050 — rents likely to lag national; underwrite the cash flow, not the appreciation.
- At projected returns (10.0% appreciation + 3.0% rent growth), your $29k cash investment doubles in ~3 years — after that, you're playing with house money.
- By year 4, paydown + projected appreciation supports a ~$40k cash-out refi (75% LTV) — recoverable capital for the next deal without selling this one.
Negotiation context
- It's been on market 138 days — a 12% lower offer ($92k) is reasonable based on typical stale-listing flexibility.
- 2 sale attempts since 2y ago; this cycle's ask has dropped $10k (9%) from the opening price — seller is motivated, your offer sets the floor, not the list.
- Current owner paid $85k; 24% above their basis — modest negotiation headroom, anchor on the comps not their cost.
Risks & watch-outs
- Watch-outs: built in 1950 — expect roof / HVAC / electrical / plumbing capex.
Questions for the listing agent
- It's been on market 138 days. Have you received any prior offers? Is the seller open to a 12% concession, seller financing, or rate buy-down credit?
- Built in 1950 — when were the roof, HVAC, electrical panel, plumbing, and water heater last replaced?
- Why hasn't it sold? Are there any deal-killer items the seller is aware of (foundation, flood, title, zoning, code violations)?
- Is there a deadline driving the sale (1031 exchange, divorce, estate, relocation)? That informs how much negotiation room exists.
- Schools are A-rated — typically a magnet for longer-tenancy family renters. What's the average tenant stay here, and is there a school-zone premium baked into asking?
- What's the average days-on-market for RENTAL listings here right now (not sales)? A rising rental-DOM trend means longer vacancies and softer asking-rent achievability than the comps imply.
- What's the recent tenant-quality profile in this submarket — average credit score on applications, eviction rate, late-payment / NSF rate, and stable-employment percentage? A property-management company in the area should have these aggregated.
- How much new for-sale + rental construction is in the pipeline within 1–3 miles? Heavy new supply typically softens prices + rents 12–24 months out; constrained supply supports both.
Investment metrics
- 1% rule
- 1.03% ✓
- Cap rate
- 8.19%
- Cash-on-cash
- 6.77%
- DSCR
- 1.30
- GRM
- 8.1
CMA / ARV
- ARV (median comp)
- $111,885
- List price
- $105,000
- Delta
- -6.15%
- Verdict
- FAIR
- Comps
- 20 within 1.0 mi
Show comp detail 10 sales within ~0.75 mi
| Address | Dist | Beds/Ba | Sqft | Sold | Price | $/sf | Match |
|---|---|---|---|---|---|---|---|
| 511 E State St | 0.08mi | 3/1.0 | 1,245 (-9%) | 13mo | $88,000 | $71 | 70 |
| 405 S Johnson St | 0.31mi | 3/1.5 | 1,368 (-0%) | 18mo | $182,500 | $133 | 68 |
| 303 W Anthony St | 0.47mi | 3/2.0 | 1,446 (+5%) | 1mo | $130,000 | $90 | 65 |
| 419 E Moore St | 0.33mi | 3/1.0 | 1,392 (+1%) | 22mo | $45,000 | $32 | 64 |
| 405 N Greeley St | 0.61mi | 3/1.0 | 1,400 (+2%) | 6mo | $89,000 | $64 | 63 |
| 403 S Johnson St | 0.29mi | 3/2.0 | 1,218 (-11%) | 18mo | $125,000 | $103 | 48 |
| 414 W Jefferson St | 0.59mi | 2/1.0 (-1) | 1,300 (-5%) | 13mo | $135,000 | $104 | 48 |
| 213 N West St | 0.50mi | 3/2.0 | 1,428 (+4%) | 24mo | $199,000 | $139 | 46 |
| 306 W South St | 0.58mi | 2/1.0 (-1) | 1,264 (-8%) | 11mo | $155,000 | $123 | 46 |
| 740 Lakeview Dr | 0.71mi | 3/3.0 | 1,544 (+12%) | 18mo | $320,000 | $207 | 23 |
Match score weights: distance 35% · size 25% · config 20% · recency 20%. Top-matched comps best support the ARV.
Projected returns pro-forma
10.0% appreciation · 3.0% rent growth · sell at horizon
- IRR
- 29.2%
- Equity multiple
- 3.30×
- Total profit
- $67,739
- Equity at exit
- $94,592
- IRR
- 25.4%
- Equity multiple
- 7.50×
- Total profit
- $191,168
- Equity at exit
- $203,992
Cash invested: $29,400 (down + closing). Projections, not guarantees.
Landlord ↔ Tenant lean methodology
- Overall (STATE)
- 83 Strongly Landlord-Friendly
- State Iowa
- 83 Strongly Landlord-Friendly · R+6
- County
- — inherits STATE
- City
- — inherits STATE
ZIP-level market 50060
- Home prices YoY
- 5.1%
- Active inventory
- 13
- Price-to-rent
- 8.1×
Monthly cashflow live
- Estimated rent
- $1,085 medium interval (Pro) →
- Mortgage (P&I)
- −$551
- Tax from tax record
- −$97 /mo · $1,164/yr
- Insurance
- −$44
- HOA
- −$0
- Vacancy / Maint / Mgmt
- −$228
- Net cashflow
- $166
Break-even live
Sensitivity live
| Price | -10% $225 | -5% $195 | +0% $166 | +5% $136 | +10% $106 |
|---|---|---|---|---|---|
| Rent | -10% $80 | -5% $123 | +0% $166 | +5% $209 | +10% $251 |
| Rate | -1.0pp $219 | -0.5pp $192 | base $166 | +0.5pp $139 | +1.0pp $111 |
UW: 25.0% down · 7.5% · 30yr · 1.5% tax · 5.0% vac · 8.0% maint · 8.0% mgmt
Financing live
Cash to close
- Down payment
- $26,250
- Closing costs
- $3,150
- Reserves months
- —
- Total cash needed
- —
Loan-product check · same deal, 3 products live
Conventional
25% down · 7.5% · 30yr
- Down + closing
- —
- Monthly P&I
- —
- Monthly cashflow
- —
- DSCR
- —
- Eligible?
- —
Personal DTI + credit; lowest rate.
DSCR
20% down · 8.5% · 30yr
- Down + closing
- —
- Monthly P&I
- —
- Monthly cashflow
- —
- DSCR
- —
- Eligible?
- —
No personal income docs; deal must DSCR.
Hard money
10% down · 12.0% · 12mo
- Down + closing
- —
- Monthly P&I
- —
- Monthly cashflow
- —
- DSCR
- —
- Eligible?
- —
Short-term bridge; refi at stabilization.
Rent comps 1 comps
| Address | Beds | Baths | Sqft | Rent | $/sqft | DOM | Units | Dist |
|---|---|---|---|---|---|---|---|---|
| 2218 Newton Rd Corydon, IA | 2.0–3.0 | 1.0–2.0 | 1042 | $1,085 | $1.04 | 44d | 5 | 0.94mi |
Listing history 22 events
-
2026-06-21days on market $105,000 Active 138 DOM
-
2026-06-18days on market $105,000 Active 136 DOM
-
2026-06-17days on market $105,000 Active 135 DOM
-
2026-06-16days on market $105,000 Active 134 DOM
-
2026-06-15days on market $105,000 Active 133 DOM
-
2026-06-13days on market $105,000 Active 131 DOM
-
2026-06-12days on market $105,000 Active 130 DOM
-
2026-06-09days on market $105,000 Active 127 DOM
-
2026-06-08days on market $105,000 Active 126 DOM
-
2026-06-07days on market $105,000 Active 125 DOM
-
2026-06-04days on market $105,000 Active 121 DOM
-
2026-06-02days on market $105,000 Active 120 DOM
-
2026-06-01days on market $105,000 Active 119 DOM
-
2026-05-31days on market $105,000 Active 118 DOM
-
2026-05-31days on market $105,000 Active 117 DOM
-
2026-05-18price $108,000 850-char remark
Show marketing remark (850 chars)
Updated 3-Bedroom Home on a Corner Lot! This well-maintained 3-bedroom, 1-bath home offers the perfect mix of character, updates, and peace of mind. With major improvements already completed, you can move in knowing the big-ticket items have been taken care of! ? Updates & Features Include: • NEW Roof (2025) with Transferable Warranty • Basement Walls Professionally Anchored (2023) with Transferable Warranty • NEW Furnace (2023) • NEW Water Heater (2023) • Updated Bathroom • Beautiful Hardwood Flooring • Corner Lot • 1-Car Detached Garage • Spacious Outdoor Area Whether you’re a first-time buyer, downsizing, or searching for a move-in-ready home with lasting value, this property is one you’ll want to see. Monthly Electric Average is: $ 200.51 Monthly Gas Average is: $ 45.14
-
2026-04-15price $111,000 850-char remark
Show marketing remark (850 chars)
Updated 3-Bedroom Home on a Corner Lot! This well-maintained 3-bedroom, 1-bath home offers the perfect mix of character, updates, and peace of mind. With major improvements already completed, you can move in knowing the big-ticket items have been taken care of! ? Updates & Features Include: • NEW Roof (2025) with Transferable Warranty • Basement Walls Professionally Anchored (2023) with Transferable Warranty • NEW Furnace (2023) • NEW Water Heater (2023) • Updated Bathroom • Beautiful Hardwood Flooring • Corner Lot • 1-Car Detached Garage • Spacious Outdoor Area Whether you’re a first-time buyer, downsizing, or searching for a move-in-ready home with lasting value, this property is one you’ll want to see. Monthly Electric Average is: $ 200.51 Monthly Gas Average is: $ 45.14
-
2026-02-03$115,000 Active 850-char remark
Show marketing remark (850 chars)
Updated 3-Bedroom Home on a Corner Lot! This well-maintained 3-bedroom, 1-bath home offers the perfect mix of character, updates, and peace of mind. With major improvements already completed, you can move in knowing the big-ticket items have been taken care of! ? Updates & Features Include: • NEW Roof (2025) with Transferable Warranty • Basement Walls Professionally Anchored (2023) with Transferable Warranty • NEW Furnace (2023) • NEW Water Heater (2023) • Updated Bathroom • Beautiful Hardwood Flooring • Corner Lot • 1-Car Detached Garage • Spacious Outdoor Area Whether you’re a first-time buyer, downsizing, or searching for a move-in-ready home with lasting value, this property is one you’ll want to see. Monthly Electric Average is: $ 200.51 Monthly Gas Average is: $ 45.14
-
2024-05-21soldstatus $85,000 Closed
-
2024-05-21$85,000 Active
-
2024-04-15soldstatus $85,000
-
2012-12-18soldstatus $31,000
ⓘ Source: listings_history table (triggers on properties + properties_extension) + one-shot
backfill from property_details.listing_events for pre-trigger history.
Tax reassessment forecast IA · Partial reset (capped growth)
- Current annual tax
- $1,164 · $97/mo
- Projected year-2 tax
- $1,406 · $117/mo
- Expected delta
- +$242/yr (+$20/mo · 20.8%)
ⓘ Screening estimate from a state-policy table — verify with the county assessor before closing.
Climate risk First Street
- Flood 1/10 Low FEMA zone X (unshaded) · 0% chance over 30 yrs
- Wildfire 4/10 Moderate
- Heat 3/10 Moderate 7 d/yr ≥103°F today · 15 d/yr by 30 yrs out
- Wind 2/10 Low
- Air quality 2/10 Low 1 unhealthy d/yr today · 3 by 30 yrs out
Nearby sold comps map
Loading sold comps map…
Walkable amenities ~0.75 mi
Loading nearby amenities…
Taxation est. · year 1
- Rental income
- $13,020
- − Mortgage interest
- −$5,882
- − Property taxes
- −$1,164
- − Insurance
- −$525
- − Repairs & maintenance
- −$1,042
- − Management
- −$1,042
- − Depreciation
- −$3,055
- Taxable income
- $312
- Est. tax owed @ 24.0%
- −$75
- After-tax cash flow
- $1,914/yr
For passive investors: Depreciation is non-cash, so a rental often shows a tax loss while cash-flowing — sheltering income. Rental losses are passive: they offset passive income freely, and up to $25,000/yr can offset ordinary (W-2) income if you actively participate and your MAGI is under $100k (phasing out to $0 by $150k); unused losses carry forward. On sale, claimed depreciation is recaptured at up to 25%, and gains may owe capital-gains tax (a 1031 exchange can defer both). Figures are a year-1 estimate at your 24.0% rate — not tax advice; consult a CPA.
Schools (NCES district)
- District
- Wayne Community School District
- NCES district ID
- 1930560
- Math proficiency
- 69% ▼ -7.00%
- Reading proficiency
- 74% ▲ 4.00%
- Median HH income
- $40,872
- Composite
- 59.73/100
- National rank
- #902
- State rank
- #139 of 289 in IA
Livability — Corydon
- Score
- 83/100
- State rank
- #33
- US rank
- #995
Category grades
Schools grade is shown separately in the Schools card above.
Census & demographics
- Census place
- Corydon, IA
- City population
- 2,385
- Population (ZIP)
- 2,385
Population outlook (Wayne County) Hauer SSP2
- Today (2025)
- 6,213 people
- By 2030
- 6,109 · -1.7%
- By 2040
- 5,926 · -4.6%
- By 2050
- 5,716 · -8.0%
- By 2075
- 5,502 · -11.4%
- By 2100
- 4,890 · -21.3%
Race, ethnicity, and origin ACS 2023
- Neighborhood character
- Predominantly White (94%)
- Race & ethnicity
- White 94% Two or more races 2% Hispanic / Latino 1% Asian 1% Black 1%
- Common ancestry
- Iranian 4% Slovak 3% Lithuanian 2%
- Foreign-born
- 2% · China, Canada
- Languages at home
- 98% English-only · Other Indo-European 1% Other Asian/Pacific 1%
Political lean MEDSL · Wayne
- 2024 margin
- Solid R (+57.2) · D 20.6% · R 77.8% · Other 1.6%
- 2008→2024 swing
- -50.2pp toward R · 2008: -7.0pp · 2024: -57.2pp
- All cycles
- 2024: R+57.2 2020: R+51.8 2016: R+46.2 2012: R+11.5 2008: R+7.0
Not yet ingested
- Civics
- —
Market trends
- HPI YoY
- ▲ 12.57%
- Current HPI
- 259.5272
- Rent YoY
- —
- Metro
- —
- State GDP YoY
- ▲ 2.48%
- F500 in state
- 4
Industry mix (Fortune 500 HQ in IA)
| Industry | F500 HQs | Revenue |
|---|---|---|
| Financial Services | 1 | $16B |
|
||
| Retail / Convenience | 1 | $15B |
|
||
Price history
+248.4% since first listed7 events — show timeline
- 2026-05-18 Price Changed $108,000 IAR
- 2026-04-15 Price Changed $111,000 IAR
- 2026-02-03 Listed $115,000 IAR
- 2024-05-21 Listed $85,000 DMMLS
- 2024-05-21 Sold (MLS) $85,000 DMMLS
- 2024-04-15 Sold (Public Records) $85,000 Public Records
- 2012-12-18 Sold (Public Records) $31,000 Public Records
Property tax history
+2.9%/yrLatest (2025): $1,164 · +0.3% YoY. Source: county tax records.
Cash-flow waterfall
monthlySold comps — $/sqft
last 12 mo · ≤1 miLoading sold comps…