 Duplex
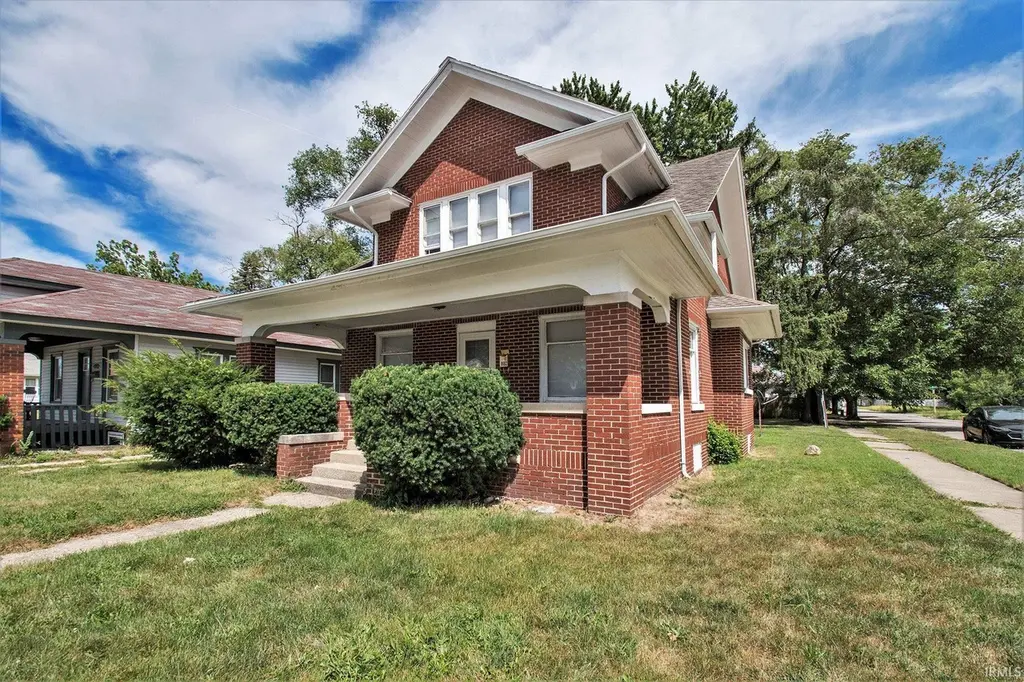
802 N Olive St · South Bend, IN
Flood risk 7/10 · Major
- FEMA flood zone
- X (unshaded)
- Chance of flooding over 30 yrs
- 0.99%
- Est. flood insurance / yr
- $473 – $860
Fire risk 1/10 · Minimal
- Est. fire insurance / yr
- $717 – $1,331
Heat risk 2/10 · Minimal
- Hot days now (above 99°F)
- 7 days/yr
- Hot days in 30 yrs
- 16 days/yr
Wind risk 2/10 · Minimal
- Chance of severe wind over 30 yrs
- —
Air-quality risk 3/10 · Minor
- Unhealthy air days now
- 3 days/yr
- Unhealthy air days in 30 yrs
- 3 days/yr
Risk factors via First Street. Map © Google.
Why this score? — see what drove the C+ grade
The composite is a weighted blend of 9 inputs, each scored 0–100. Each bar is that input's sub-score; the figure is the points it added to the 100-point composite (weight × sub-score).
- Cash flow +30.0/30.0
- DSCR +10.0/10.0
- 1% rule +9.4/10.0
- Rent growth +4.2/5.0
- Livability +3.2/5.0
- Condition / age +2.5/5.0
- Schools +1.4/10.0
- ARV discount +0.0/15.0
- Appreciation +0.0/10.0
$169,900
🖨 Deal sheet 📄 Offer letter ✓ Due diligence
Multi-family units
County records classify this as Multi-Family (2-4 Unit). Listing-text estimate: 2 units. confirmed
Listing remarks MLS
In search of a lucrative income opportunity? This tastefully renovated duplex, with two 2-bedroom/1-bath units, is all brick. One unit boasts elegant hardwood flooring, built-ins, and natural woodwork, while the other features stylish vinyl plank flooring. Both units have white kitchens, spacious living area and neutral decor. See rent amounts. Both units are currently rented
Key facts
- 5,000 sq ft lot
- 2 parking spots
- Built 1922
Neighborhood map
What this means for you Summary
Snapshot
- This is a 2 × 2-bed/1.0-bath units multifamily listed at $170k.
Deal economics
- At list price, monthly cash flow is $823 ($10k/yr) — positive. Per door: $412/mo.
- The deal already cash-flows at list — no discount required.
- Meets the 1% rule at list price ($2k rent vs $170k).
- Recommended offer: $150k (12.0% below list) — sets the bar for market timing.
- Cap rate 12.5% vs local median 4.4% in South Bend — top-decile yield for the area; either an underpriced asset or a hidden risk that comps aren't pricing in. Stress-test before assuming the spread holds.
Location & tenants
- Location reads 64/100 on livability (#365 in IN) — a middle-class / working-renter tenant base. Strengths: cost of living A+, housing A+, health & safety A+; Watch: amenities D, employment D, schools F.
- South Bend Community School Corporation (urban): math 12% / reading 21% proficiency, ranked #284 of 301 in IN (top 94%) — low school quality limits family demand, transient renter base, plan for 1-2y turnover; 66% free/reduced lunch — lower-income household profile, screen leases tightly.
- Market conditions: Rents rising fast (+6.8%/yr); 424 active listings in the ZIP; 10 comparable units currently listed for rent nearby; rentals lingering (median 44d on market — plan ~5-8 weeks vacancy on turnover, expect pricing pressure); 50% of comp listings sitting > 30 days — soft ceiling on asking rent; 754 units permitted in St. Joseph County in 2024 (460 in 5+ unit buildings).
- At $2,454/mo this rent would consume 48% of the median local household income ($62k/yr) (locally 1024% of renters already pay >50% of income on rent) — very limited rent-growth headroom before tenants either downsize or default.
Forward outlook
- Local home prices are declining (-3.0%/yr); year-one equity from $1k of loan paydown is wiped out by about $5k of value loss. Plan a longer hold.
- At projected returns (-3.0% appreciation + 6.8% rent growth), your $48k cash investment doubles in ~5 years — after that, you're playing with house money.
Negotiation context
- It's been on market 674 days — a 12% lower offer ($150k) is reasonable based on typical stale-listing flexibility.
- 6 sale attempts since 24y ago; this cycle's ask has dropped $40k (19%) from the opening price — seller is motivated, your offer sets the floor, not the list.
Risks & watch-outs
- Watch-outs: flood insurance adds $56/mo; built in 1922 — expect roof / HVAC / electrical / plumbing capex.
- Climate carrying-cost: major flood risk — expect insurance premiums to compound above CPI over the hold.
Questions for the listing agent
- It's been on market 674 days. Have you received any prior offers? Is the seller open to a 12% concession, seller financing, or rate buy-down credit?
- Can we see the unit-by-unit rent roll, current vacancy, and any below-market leases? What's the average tenancy length?
- What capital expenditures (roof, boiler, parking lot, exteriors) have been made in the last 5 years, and what's planned in the next 2?
- Built in 1922 — when were the roof, HVAC, electrical panel, plumbing, and water heater last replaced?
- What's the actual annual flood-insurance premium (NFIP or private), and is the property in a SFHA with mandatory coverage?
- Why hasn't it sold? Are there any deal-killer items the seller is aware of (foundation, flood, title, zoning, code violations)?
- Is there a deadline driving the sale (1031 exchange, divorce, estate, relocation)? That informs how much negotiation room exists.
- Schools are F-rated, which usually means shorter tenancies and higher turnover. Who's the typical renter profile here, and what's been the actual vacancy rate?
- Crime grade is F in this area — have there been break-ins, vandalism, or insurance claims at this property in the last 3 years? What carrier currently insures it and at what premium?
- What's the average days-on-market for RENTAL listings here right now (not sales)? A rising rental-DOM trend means longer vacancies and softer asking-rent achievability than the comps imply.
- What's the recent tenant-quality profile in this submarket — average credit score on applications, eviction rate, late-payment / NSF rate, and stable-employment percentage? A property-management company in the area should have these aggregated.
- How much new apartment / multifamily construction is in the pipeline within 1–3 miles? Heavy new supply (>2% of stock underway) typically softens rents 12–24 months out; light construction supports rent growth.
Investment metrics
- 1% rule
- 1.44% ✓
- Cap rate
- 12.50%
- Cash-on-cash
- 22.17%
- DSCR
- 1.99
- GRM
- 5.8
CMA / ARV
- ARV (median comp)
- $117,754
- List price
- $169,900
- Delta
- 44.28%
- Verdict
- OVERPRICED
- Comps
- 7 within 1.0 mi
Show comp detail 1 sale within ~0.75 mi
| Address | Dist | Beds/Ba | Sqft | Sold | Price | $/sf | Match |
|---|---|---|---|---|---|---|---|
| 736 Lawndale Ave | 0.65mi | 5/2.0 (+1) | 2,032 (-3%) | 4mo | $95,000 | $47 | 56 |
Match score weights: distance 35% · size 25% · config 20% · recency 20%. Top-matched comps best support the ARV.
Projected returns pro-forma
-3.0% appreciation · 6.78% rent growth · sell at horizon
- IRR
- 17.2%
- Equity multiple
- 1.73×
- Total profit
- $34,588
- Equity at exit
- $25,333
- IRR
- 28.2%
- Equity multiple
- 3.96×
- Total profit
- $140,609
- Equity at exit
- $14,690
Cash invested: $47,572 (down + closing). Projections, not guarantees.
Landlord ↔ Tenant lean methodology
- Overall (STATE)
- 90 Strongly Landlord-Friendly
- State Indiana
- 90 Strongly Landlord-Friendly · R+11
- County
- — inherits STATE
- City
- — inherits STATE
ZIP-level market 46628
- Rents YoY
- 6.8%
- Active inventory
- 424
- Price-to-rent
- 11.5×
Monthly cashflow live
- Estimated rent
- $2,454 high interval (Pro) →
- Mortgage (P&I)
- −$891
- Tax from tax record
- −$98 /mo · $1,178/yr
- Insurance
- −$71
- Flood insurance flood zone
- −$56 /mo · $666/yr
- HOA
- −$0
- Vacancy / Maint / Mgmt
- −$515
- Net cashflow
- $823
Break-even live
2-unit breakdown (identical units grouped — click to expand)
| Units | Beds | Baths | Est. rent |
|---|---|---|---|
| 2× units | 2 | 1 | $2,454 |
| #1 | 2 | 1 | $1,227 |
| #2 | 2 | 1 | $1,227 |
| Total (2 units) | $2,454 | ||
UW: 25.0% down · 7.5% · 30yr · 1.5% tax · 5.0% vac · 8.0% maint · 8.0% mgmt
Financing live
Cash to close
- Down payment
- $42,475
- Closing costs
- $5,097
- Reserves months
- —
- Total cash needed
- —
Loan-product check · same deal, 3 products live
Conventional
25% down · 7.5% · 30yr
- Down + closing
- —
- Monthly P&I
- —
- Monthly cashflow
- —
- DSCR
- —
- Eligible?
- —
Personal DTI + credit; lowest rate.
DSCR
20% down · 8.5% · 30yr
- Down + closing
- —
- Monthly P&I
- —
- Monthly cashflow
- —
- DSCR
- —
- Eligible?
- —
No personal income docs; deal must DSCR.
Hard money
10% down · 12.0% · 12mo
- Down + closing
- —
- Monthly P&I
- —
- Monthly cashflow
- —
- DSCR
- —
- Eligible?
- —
Short-term bridge; refi at stabilization.
Rent comps 10 comps
| Address | Beds | Baths | Sqft | Rent | $/sqft | DOM | Units | Dist |
|---|---|---|---|---|---|---|---|---|
| 2205 Lincoln Way W South Bend, IN | 4.0 | 2.0 | 1440 | $1,565 | $1.09 | 13d | 1 | 0.15mi |
| 2530 Bonds Ave South Bend, IN | 5.0 | 1.5 | 1866 | $2,000 | $1.07 | 43d | 1 | 0.19mi |
| 1008 O Brien St Unit O South Bend, IN | 3.0 | 1.0 | 1634 | $800 | $0.49 | 21d | 1 | 0.21mi |
| 1210 Johnson St South Bend, IN | 3.0 | 2.0 | 1568 | $1,250 | $0.80 | 21d | 1 | 0.42mi |
| 1032 Allen St South Bend, IN | 3.0 | 2.0 | 1580 | $1,200 | $0.76 | 43d | 1 | 0.90mi |
| 1243 Portage Ave South Bend, IN | 3.0 | 1.0 | 1570 | $1,500 | $0.96 | 43d | 1 | 0.91mi |
| 609 N Scott St South Bend, IN | 5.0 | 1.5 | 1951 | $1,450 | $0.74 | 43d | 1 | 1.20mi |
| 504 W Navarre St South Bend, IN | 3.0 | 1.5 | 1520 | $1,350 | $0.89 | 13d | 1 | 1.36mi |
| 164 S Gladstone Ave South Bend, IN | 4.0 | 1.0 | 1440 | $1,365 | $0.95 | 43d | 1 | 1.44mi |
| 721 S Arnold St South Bend, IN | 4.0 | 2.0 | 2568 | $1,800 | $0.70 | 13d | 1 | 1.49mi |
Listing history 28 events
-
2026-06-18days on market $169,900 Active 674 DOM
-
2026-06-17days on market $169,900 Active 673 DOM
-
2026-06-16days on market $169,900 Active 672 DOM
-
2026-06-15days on market $169,900 Active 671 DOM
-
2026-06-14days on market $169,900 Active 669 DOM
-
2026-06-13days on market $169,900 Active 668 DOM
-
2026-06-10days on market $169,900 Active 666 DOM
-
2026-06-09days on market $169,900 Active 665 DOM
-
2026-06-08days on market $169,900 Active 664 DOM
-
2026-06-07days on market $169,900 Active 663 DOM
-
2026-06-03days on market $169,900 Active 659 DOM
-
2026-06-02days on market $169,900 Active 658 DOM
-
2026-06-01days on market $169,900 Active 657 DOM
-
2026-05-31days on market $169,900 Active 656 DOM
-
2026-05-07price $169,900 378-char remark
Show marketing remark (378 chars)
In search of a lucrative income opportunity? This tastefully renovated duplex, with two 2-bedroom/1-bath units, is all brick. One unit boasts elegant hardwood flooring, built-ins, and natural woodwork, while the other features stylish vinyl plank flooring. Both units have white kitchens, spacious living area and neutral decor. See rent amounts. Both units are currently rented
-
2026-02-13price $199,900 378-char remark
Show marketing remark (378 chars)
In search of a lucrative income opportunity? This tastefully renovated duplex, with two 2-bedroom/1-bath units, is all brick. One unit boasts elegant hardwood flooring, built-ins, and natural woodwork, while the other features stylish vinyl plank flooring. Both units have white kitchens, spacious living area and neutral decor. See rent amounts. Both units are currently rented
-
2025-01-14status Active 378-char remark
Show marketing remark (378 chars)
In search of a lucrative income opportunity? This tastefully renovated duplex, with two 2-bedroom/1-bath units, is all brick. One unit boasts elegant hardwood flooring, built-ins, and natural woodwork, while the other features stylish vinyl plank flooring. Both units have white kitchens, spacious living area and neutral decor. See rent amounts. Both units are currently rented
-
2024-12-16historical Active Under Contract 378-char remark
Show marketing remark (378 chars)
In search of a lucrative income opportunity? This tastefully renovated duplex, with two 2-bedroom/1-bath units, is all brick. One unit boasts elegant hardwood flooring, built-ins, and natural woodwork, while the other features stylish vinyl plank flooring. Both units have white kitchens, spacious living area and neutral decor. See rent amounts. Both units are currently rented
-
2024-08-13$209,900 Active 378-char remark
Show marketing remark (378 chars)
In search of a lucrative income opportunity? This tastefully renovated duplex, with two 2-bedroom/1-bath units, is all brick. One unit boasts elegant hardwood flooring, built-ins, and natural woodwork, while the other features stylish vinyl plank flooring. Both units have white kitchens, spacious living area and neutral decor. See rent amounts. Both units are currently rented
-
2024-03-14historical $1,100
-
2023-12-08price $1,100
-
2023-12-07$1,000
-
2023-04-11soldstatus $180,000
-
2014-05-13$29,900
-
2014-05-12$29,900
-
2012-11-08soldstatus $52,000
-
2003-07-08historical
-
2002-08-08$40,000
ⓘ Source: listings_history table (triggers on properties + properties_extension) + one-shot
backfill from property_details.listing_events for pre-trigger history.
Tax reassessment forecast IN · Partial reset (capped growth)
- Current annual tax
- $1,178 · $98/mo
- Projected year-2 tax
- $1,311 · $109/mo
- Expected delta
- +$133/yr (+$11/mo · 11.3%)
ⓘ Screening estimate from a state-policy table — verify with the county assessor before closing.
Climate risk First Street
- Flood 7/10 Severe FEMA zone X (unshaded) · 99% chance over 30 yrs
- Wildfire 1/10 Low
- Heat 2/10 Low 7 d/yr ≥99°F today · 16 d/yr by 30 yrs out
- Wind 2/10 Low
- Air quality 3/10 Moderate 3 unhealthy d/yr today · 3 by 30 yrs out
Nearby sold comps map
Loading sold comps map…
Walkable amenities ~0.75 mi
Loading nearby amenities…
Taxation est. · year 1
- Rental income
- $29,448
- − Mortgage interest
- −$9,517
- − Property taxes
- −$1,178
- − Insurance
- −$1,516
- − Repairs & maintenance
- −$2,356
- − Management
- −$2,356
- − Depreciation
- −$4,943
- Taxable income
- $7,583
- Est. tax owed @ 24.0%
- −$1,820
- After-tax cash flow
- $8,059/yr
For passive investors: Depreciation is non-cash, so a rental often shows a tax loss while cash-flowing — sheltering income. Rental losses are passive: they offset passive income freely, and up to $25,000/yr can offset ordinary (W-2) income if you actively participate and your MAGI is under $100k (phasing out to $0 by $150k); unused losses carry forward. On sale, claimed depreciation is recaptured at up to 25%, and gains may owe capital-gains tax (a 1031 exchange can defer both). Figures are a year-1 estimate at your 24.0% rate — not tax advice; consult a CPA.
Schools (NCES district)
- District
- South Bend Community School Corporation
- NCES district ID
- 1810290
- Math proficiency
- 12% ▼ -10.00%
- Reading proficiency
- 21% ▼ -6.00%
- Median HH income
- $41,935
- Composite
- 14.21/100
- National rank
- #9452
- State rank
- #284 of 301 in IN
Livability — South Bend
- Score
- 64/100
- State rank
- #365
- US rank
- #13730
Category grades
Schools grade is shown separately in the Schools card above.
Census & demographics
- Census place
- South Bend, IN
- County
- Saint Joseph County · 189,048 people
- City population
- 99,767
- Metro
- South Bend-Mishawaka, IN-MI
- Population (ZIP)
- 27,685
- Household income
- $61,759
- Rent vs Own
- Severe rent burden
- 1024.0
Population outlook (St. Joseph County) Hauer SSP2
- Today (2025)
- 273,186 people
- By 2030
- 273,594 · +0.1%
- By 2040
- 271,641 · -0.6%
- By 2050
- 269,187 · -1.5%
- By 2075
- 263,136 · -3.7%
- By 2100
- 245,659 · -10.1%
Race, ethnicity, and origin ACS 2023
- Neighborhood character
- Diverse neighborhood (Simpson 0.60)
- Race & ethnicity
- White 55% Black 30% Hispanic / Latino 10% Two or more races 8%
- Hispanic origin (detail)
- Mexican 8%
- Common ancestry
- Romanian 12% Lithuanian 1% Slovak 1%
- Foreign-born
- 7% · Canada, China
- Languages at home
- 89% English-only · Spanish 7% Russian/Polish/Slavic 1%
Political lean MEDSL · St. Joseph
- 2024 margin
- Toss-up / Even · D 50.0% · R 48.5% · Other 1.5%
- 2008→2024 swing
- -15.6pp toward R · 2008: 17.1pp · 2024: 1.5pp
- All cycles
- 2024: D+1.5 2020: D+5.8 2016: D+0.2 2012: D+3.5 2008: D+17.1
Not yet ingested
- Civics
- —
Market trends
- HPI YoY
- ▼ -130.47%
- Current HPI
- 202.112
- Rent YoY
- ▲ 6.78%
- Metro
- South Bend-Mishawaka, IN-MI
- State GDP YoY
- ▲ 2.90%
- F500 in state
- 18
Industry mix (Fortune 500 HQ in IN)
| Industry | F500 HQs | Revenue |
|---|---|---|
| Industrial Machinery | 2 | $37B |
|
||
| Healthcare | 1 | $177B |
|
||
| Pharmaceuticals | 1 | $45B |
|
||
| Metals / Steel | 1 | $18B |
|
||
| Agriculture | 1 | $17B |
|
||
| Packaging | 1 | $12B |
|
||
Price history
+324.8% since first listed14 events — show timeline
- 2026-05-07 Price Changed $169,900 IRMLS
- 2026-02-13 Price Changed $199,900 IRMLS
- 2025-01-14 Relisted — IRMLS
- 2024-12-16 Contingent — IRMLS
- 2024-08-13 Listed $209,900 IRMLS
- 2024-03-14 Rental Removed $1,100 APPFOLIO
- 2023-12-08 Price Changed $1,100 APPFOLIO
- 2023-12-07 Listed for Rent $1,000 APPFOLIO
- 2023-04-11 Sold (Public Records) $180,000 Public Records
- 2014-05-13 Listed $29,900 IRMLS
- 2014-05-12 Listed $29,900 IRMLS
- 2012-11-08 Sold (Public Records) $52,000 Public Records
- 2003-07-08 Listing Removed — NIRA MLS as Distributed by MLS Grid
- 2002-08-08 Listed $40,000 NIRA MLS as Distributed by MLS Grid
Property tax history
+1.3%/yrLatest (2023): $1,178 · +11.5% YoY. Source: county tax records.
Cash-flow waterfall
monthlySold comps — $/sqft
last 12 mo · ≤1 miLoading sold comps…