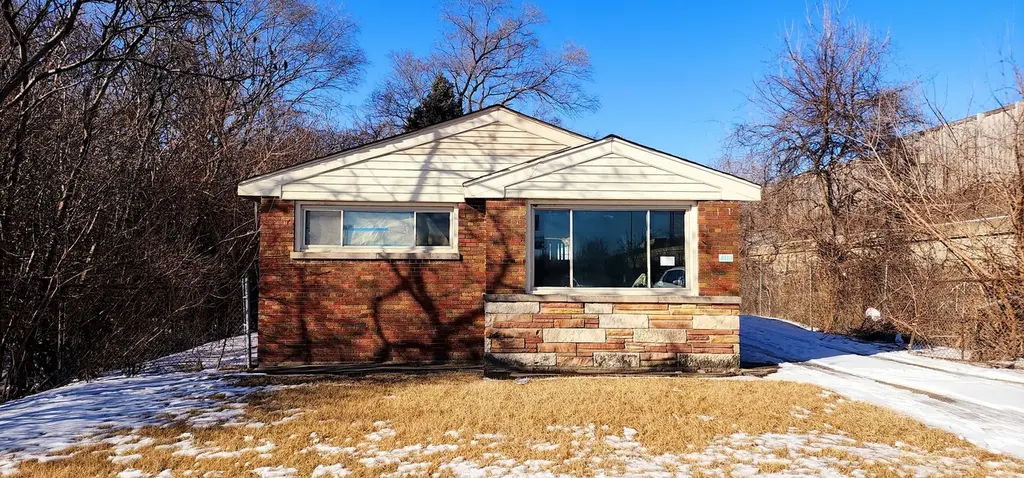
4118 W Midlothian Ave · Robbins, IL
Flood risk 3/10 · Minor
- FEMA flood zone
- X (unshaded)
- Chance of flooding over 30 yrs
- 0.2%
- Est. flood insurance / yr
- $473 – $860
Fire risk 1/10 · Minimal
- Est. fire insurance / yr
- $804 – $1,492
Heat risk 3/10 · Minor
- Hot days now (above 102°F)
- 7 days/yr
- Hot days in 30 yrs
- 14 days/yr
Wind risk 2/10 · Minimal
- Chance of severe wind over 30 yrs
- —
Air-quality risk 3/10 · Minor
- Unhealthy air days now
- 4 days/yr
- Unhealthy air days in 30 yrs
- 4 days/yr
Risk factors via First Street. Map © Google.
Why this score? — see what drove the A- grade
The composite is a weighted blend of 9 inputs, each scored 0–100. Each bar is that input's sub-score; the figure is the points it added to the 100-point composite (weight × sub-score).
- Cash flow +30.0/30.0
- ARV discount +15.0/15.0
- 1% rule +10.0/10.0
- DSCR +10.0/10.0
- Appreciation +10.0/10.0
- Livability +3.3/5.0
- Rent growth +2.5/5.0
- Condition / age +2.5/5.0
- Schools +1.6/10.0
$94,900
🖨 Deal sheet (PDF) 📄 Offer letter ✓ Due diligence
Listing remarks MLS
Charming GUTTED Single-Family Home on Spacious Double Lot - Sold As-Is! Nestled in a highly private location, this unique property offers endless potential. Situated on a generous double lot, the home provides plenty of space for expansion, outdoor enjoyment, or future development. Featuring 3 bedrooms and 1 bath, this home is ready for your vision and creativity. Whether you're an investor or a buyer looking for a secluded retreat, this is a rare opportunity to make it your own. Sold as-is. Don't miss out-schedule a showing today! 2 LOTS on this property PROPERTY IS GUTTED.
Key facts
- Secluded retreat
- Double lot
- Outdoor enjoyment
Tags
Neighborhood map
What this means for you Summary
Snapshot
- This is a 2-bed/1.0-bath single-family listed at $95k.
Deal economics
- At list price, monthly cash flow is $714 ($9k/yr) — positive.
- The deal already cash-flows at list — no discount required.
- Meets the 1% rule at list price ($2k rent vs $95k).
- Recommended offer: $86k (9.0% below list) — sets the bar for market timing.
Location & tenants
- Location reads 66/100 on livability (#583 in IL) — a middle-class / working-renter tenant base. Strengths: commute A+, cost of living A+, housing A+; Watch: crime D+, amenities F, employment F.
- Chsd 218 (suburban): math 14% / reading 20% proficiency, ranked #454 of 620 in IL (top 73%) — low school quality limits family demand, transient renter base, plan for 1-2y turnover.
- Zoned schools: Kolmar Elem School (math 4% / reading 9%, grade F, #1,723 of 2,056 statewide, top 84%, 541 students, 0% FRL); Dd Eisenhower High Sch (Campus) (math 10% / reading 13%, grade F, #520 of 693 statewide, top 75%, 1,841 students, 0% FRL).
- Market conditions: 28 active listings in the ZIP; 9 comparable units currently listed for rent nearby; rentals leasing fast (median 7d on market — plan ~1-2 weeks tenant-placement turnaround); 6,272 units permitted in Cook County in 2024 (4,658 in 5+ unit buildings).
Forward outlook
- In year one you build about $10k of equity ($656 loan paydown + $9k appreciation (10.0% local appreciation)).
- At projected returns (10.0% appreciation + 3.0% rent growth), your $27k cash investment doubles in ~2 years — after that, you're playing with house money.
- By year 4, paydown + projected appreciation supports a ~$36k cash-out refi (75% LTV) — recoverable capital for the next deal without selling this one.
Negotiation context
- It's been on market 110 days — a 9% lower offer ($86k) is reasonable based on typical stale-listing flexibility.
- 3 sale attempts since 5y ago with the ask held roughly flat each time — persistent listings suggest the price (not the market) is what's stuck; bring a comps-based counter.
Risks & watch-outs
- Watch-outs: built in 1957 — expect roof / HVAC / electrical / plumbing capex.
Questions for the listing agent
- It's been on market 110 days. Have you received any prior offers? Is the seller open to a 9% concession, seller financing, or rate buy-down credit?
- Built in 1957 — when were the roof, HVAC, electrical panel, plumbing, and water heater last replaced?
- Why hasn't it sold? Are there any deal-killer items the seller is aware of (foundation, flood, title, zoning, code violations)?
- Is there a deadline driving the sale (1031 exchange, divorce, estate, relocation)? That informs how much negotiation room exists.
- Schools are F-rated, which usually means shorter tenancies and higher turnover. Who's the typical renter profile here, and what's been the actual vacancy rate?
- Crime grade is D in this area — have there been break-ins, vandalism, or insurance claims at this property in the last 3 years? What carrier currently insures it and at what premium?
- What's the average days-on-market for RENTAL listings here right now (not sales)? A rising rental-DOM trend means longer vacancies and softer asking-rent achievability than the comps imply.
- What's the recent tenant-quality profile in this submarket — average credit score on applications, eviction rate, late-payment / NSF rate, and stable-employment percentage? A property-management company in the area should have these aggregated.
- How much new for-sale + rental construction is in the pipeline within 1–3 miles? Heavy new supply typically softens prices + rents 12–24 months out; constrained supply supports both.
Investment metrics
- 1% rule
- 1.75% ✓
- Cap rate
- 15.32%
- Cash-on-cash
- 32.24%
- DSCR
- 2.43
- GRM
- 4.8
CMA / ARV
- ARV (median comp)
- $115,559
- List price
- $94,900
- Delta
- -17.88%
- Verdict
- UNDERPRICED
- Comps
- 20 within 1.0 mi
Show comp detail 12 sales within ~0.75 mi
| Address | Dist | Beds/Ba | Sqft | Sold | Price | $/sf | Match |
|---|---|---|---|---|---|---|---|
| 13625 S Keeler Ave | 0.26mi | 3/1.0 (+1) | 997 (+1%) | 12mo | $70,000 | $70 | 71 |
| 4117 W 138th St | 0.04mi | 3/1.5 (+1) | 912 (-7%) | 14mo | $82,000 | $90 | 67 |
| 4124 W 136th Pl | 0.25mi | 3/1.0 (+1) | 912 (-7%) | 9mo | $122,000 | $134 | 64 |
| 13417 S Komenski Ave | 0.47mi | 3/1.5 (+1) | 1,000 (+2%) | 14mo | $130,000 | $130 | 57 |
| 3714 W 140th Pl | 0.55mi | 3/1.0 (+1) | 1,000 (+2%) | 17mo | $60,000 | $60 | 53 |
| 14330 Keeler Ave | 0.68mi | 3/1.0 (+1) | 960 (-2%) | 13mo | $238,000 | $248 | 48 |
| 14244 Kostner Ave | 0.69mi | 3/1.0 (+1) | 900 (-9%) | 0mo | $246,000 | $273 | 48 |
| 13604 S Monticello Ave | 0.60mi | 2/1.0 | 873 (-11%) | 6mo | $24,900 | $29 | 48 |
| 13411 S Kolin Ave | 0.57mi | 3/2.5 (+1) | 972 (-1%) | 17mo | $202,000 | $208 | 46 |
| 14340 Keeler Ave | 0.69mi | 3/1.5 (+1) | 1,040 (+6%) | 11mo | $218,000 | $210 | 43 |
| 14305 Kostner Ave | 0.72mi | 3/1.0 (+1) | 1,093 (+11%) | 5mo | $194,000 | $177 | 39 |
| 4240 143rd St | 0.62mi | 3/2.0 (+1) | 1,116 (+13%) | 2mo | $303,500 | $272 | 38 |
Match score weights: distance 35% · size 25% · config 20% · recency 20%. Top-matched comps best support the ARV.
Projected returns pro-forma
10.0% appreciation · 3.0% rent growth · sell at horizon
- IRR
- 48.9%
- Equity multiple
- 4.66×
- Total profit
- $97,145
- Equity at exit
- $85,493
- IRR
- 42.6%
- Equity multiple
- 10.42×
- Total profit
- $250,293
- Equity at exit
- $184,370
Cash invested: $26,572 (down + closing). Projections, not guarantees.
Landlord ↔ Tenant lean methodology
- Overall (STATE)
- 43 Moderately Tenant-Leaning
- State Illinois
- 43 Moderately Tenant-Leaning · D+7
- County
- — inherits STATE
- City
- — inherits STATE
ZIP-level market 60472
- Home prices YoY
- 3.5%
- Active inventory
- 28
- Price-to-rent
- 4.8×
Monthly cashflow live
- Estimated rent
- $1,657 high interval (Pro) →
- Mortgage (P&I)
- −$498
- Tax from tax record
- −$57 /mo · $690/yr
- Insurance
- −$40
- HOA
- −$0
- Vacancy / Maint / Mgmt
- −$348
- Net cashflow
- $714
Break-even live
Sensitivity live
| Price | -10% $768 | -5% $741 | +0% $714 | +5% $687 | +10% $660 |
|---|---|---|---|---|---|
| Rent | -10% $583 | -5% $649 | +0% $714 | +5% $779 | +10% $845 |
| Rate | -1.0pp $762 | -0.5pp $738 | base $714 | +0.5pp $689 | +1.0pp $664 |
UW: 25.0% down · 7.5% · 30yr · 1.5% tax · 5.0% vac · 8.0% maint · 8.0% mgmt
Financing live
Cash to close
- Down payment
- $23,725
- Closing costs
- $2,847
- Reserves months
- —
- Total cash needed
- —
Loan-product check · same deal, 3 products live
Conventional
25% down · 7.5% · 30yr
- Down + closing
- —
- Monthly P&I
- —
- Monthly cashflow
- —
- DSCR
- —
- Eligible?
- —
Personal DTI + credit; lowest rate.
DSCR
20% down · 8.5% · 30yr
- Down + closing
- —
- Monthly P&I
- —
- Monthly cashflow
- —
- DSCR
- —
- Eligible?
- —
No personal income docs; deal must DSCR.
Hard money
10% down · 12.0% · 12mo
- Down + closing
- —
- Monthly P&I
- —
- Monthly cashflow
- —
- DSCR
- —
- Eligible?
- —
Short-term bridge; refi at stabilization.
Rent comps 9 comps
| Address | Beds | Baths | Sqft | Rent | $/sqft | DOM | Units | Dist |
|---|---|---|---|---|---|---|---|---|
| 13906 Central Park Ave Unit 2N Robbins, IL | 3.0 | 2.0 | 900 | $2,000 | $2.22 | 0d | 1 | 0.63mi |
| 14547 Keystone Ave #12 Midlothian, IL | 2.0 | 1.0 | 1000 | $1,600 | $1.60 | 0d | 1 | 0.93mi |
| 14601 Keystone Ave Unit B1 Midlothian, IL | 1.0 | 1.0 | 600 | $1,200 | $2.00 | 18d | 1 | 0.97mi |
| 14633 Keystone Ave Unit 3A Midlothian, IL | 1.0 | 1.0 | 750 | $1,200 | $1.60 | 3d | 1 | 1.01mi |
| 13615 Royal Ct #309 Crestwood, IL | 2.0 | 2.0 | 1000 | $1,850 | $1.85 | 4d | 1 | 1.02mi |
| 3542 147th St Midlothian, IL | 2.0 | 1.0 | 817 | $1,500 | $1.84 | 8d | 2 | 1.25mi |
| 14033 Laramie Ave #408 Crestwood, IL | 2.0 | 2.0 | 1100 | $2,100 | $1.91 | 9d | 1 | 1.37mi |
| 14643 Lamon Ave Unit 2B Midlothian, IL | 2.0 | 1.5 | 990 | $1,525 | $1.54 | 26d | 1 | 1.41mi |
| 3349 147th St Unit 3240 06 Midlothian, IL | 2.0 | 1.0 | 817 | $1,500 | $1.84 | 6d | 1 | 1.44mi |
Listing history 23 events
-
2026-06-21days on market $94,900 Active 110 DOM
-
2026-06-18days on market $94,900 Active 107 DOM
-
2026-06-17days on market $94,900 Active 106 DOM
-
2026-06-16days on market $94,900 Active 105 DOM
-
2026-06-15days on market $94,900 Active 104 DOM
-
2026-06-13days on market $94,900 Active 102 DOM
-
2026-06-09days on market $94,900 Active 98 DOM
-
2026-06-08days on market $94,900 Active 97 DOM
-
2026-06-07days on market $94,900 Active 96 DOM
-
2026-06-04days on market $94,900 Active 93 DOM
-
2026-06-03days on market $94,900 Active 92 DOM
-
2026-06-02days on market $94,900 Active 91 DOM
-
2026-06-01days on market $94,900 Active 90 DOM
-
2026-05-31days on market $94,900 Active 89 DOM
-
2026-03-03$94,900 Active 587-char remark
Show marketing remark (587 chars)
Charming GUTTED Single-Family Home on Spacious Double Lot - Sold As-Is! Nestled in a highly private location, this unique property offers endless potential. Situated on a generous double lot, the home provides plenty of space for expansion, outdoor enjoyment, or future development. Featuring 3 bedrooms and 1 bath, this home is ready for your vision and creativity. Whether you're an investor or a buyer looking for a secluded retreat, this is a rare opportunity to make it your own. Sold as-is. Don't miss out-schedule a showing today! 2 LOTS on this property PROPERTY IS GUTTED.
-
2026-02-17historical
-
2025-02-18Active
-
2022-07-13soldstatus $85,000 Closed
-
2022-04-03status Pending
-
2021-11-13$89,000 Active
-
2019-05-30soldstatus $56,000
-
2005-12-22soldstatus $39,000
-
1997-11-10soldstatus $47,000
ⓘ Source: listings_history table (triggers on properties + properties_extension) + one-shot
backfill from property_details.listing_events for pre-trigger history.
Tax reassessment forecast IL · Partial reset (capped growth)
- Current annual tax
- $690 · $57/mo
- Projected year-2 tax
- $1,422 · $118/mo
- Expected delta
- +$732/yr (+$61/mo · 106.2%)
ⓘ Screening estimate from a state-policy table — verify with the county assessor before closing.
Climate risk First Street
- Flood 3/10 Moderate FEMA zone X (unshaded) · 20% chance over 30 yrs
- Wildfire 1/10 Low
- Heat 3/10 Moderate 7 d/yr ≥102°F today · 14 d/yr by 30 yrs out
- Wind 2/10 Low
- Air quality 3/10 Moderate 4 unhealthy d/yr today · 4 by 30 yrs out
Nearby sold comps map
Loading sold comps map…
Walkable amenities ~0.75 mi
Loading nearby amenities…
Taxation est. · year 1
- Rental income
- $19,878
- − Mortgage interest
- −$5,316
- − Property taxes
- −$690
- − Insurance
- −$474
- − Repairs & maintenance
- −$1,590
- − Management
- −$1,590
- − Depreciation
- −$2,761
- Taxable income
- $7,457
- Est. tax owed @ 24.0%
- −$1,790
- After-tax cash flow
- $6,778/yr
For passive investors: Depreciation is non-cash, so a rental often shows a tax loss while cash-flowing — sheltering income. Rental losses are passive: they offset passive income freely, and up to $25,000/yr can offset ordinary (W-2) income if you actively participate and your MAGI is under $100k (phasing out to $0 by $150k); unused losses carry forward. On sale, claimed depreciation is recaptured at up to 25%, and gains may owe capital-gains tax (a 1031 exchange can defer both). Figures are a year-1 estimate at your 24.0% rate — not tax advice; consult a CPA.
Schools (NCES district)
- District
- Chsd 218
- NCES district ID
- 1706540
- Math proficiency
- 14% ▼ -4.00%
- Reading proficiency
- 20% ▼ -1.00%
- Median HH income
- $57,166
- Composite
- 16.09/100
- National rank
- #9235
- State rank
- #454 of 620 in IL
Livability — Robbins
- Score
- 66/100
- State rank
- #583
- US rank
- #12161
Category grades
Schools grade is shown separately in the Schools card above.
Census & demographics
- Census place
- Robbins, IL
- City population
- 4,961
- Population (ZIP)
- 4,961
Population outlook (Cook County) Hauer SSP2
- Today (2025)
- 5,347,519 people
- By 2030
- 5,357,703 · +0.2%
- By 2040
- 5,324,924 · -0.4%
- By 2050
- 5,230,762 · -2.2%
- By 2075
- 4,785,735 · -10.5%
- By 2100
- 4,188,836 · -21.7%
Race, ethnicity, and origin ACS 2023
- Neighborhood character
- Predominantly Black (85%)
- Race & ethnicity
- Black 85% Hispanic / Latino 9% White 4% Two or more races 3%
- Hispanic origin (detail)
- Mexican 8%
- Common ancestry
- Hispanic 4%
- Foreign-born
- 4% · Canada
- Languages at home
- 92% English-only · Spanish 7%
Political lean MEDSL · Cook
- 2024 margin
- Solid D (+42.0) · D 70.4% · R 28.4% · Other 1.2%
- 2008→2024 swing
- -11.4pp toward R · 2008: 53.4pp · 2024: 42.0pp
- All cycles
- 2024: D+42.0 2020: D+50.3 2016: D+53.0 2012: D+49.4 2008: D+53.4
Not yet ingested
- Civics
- —
Market trends
- HPI YoY
- ▲ 16.74%
- Current HPI
- 494.1622
- Rent YoY
- —
- Metro
- —
- State GDP YoY
- ▲ 1.59%
- F500 in state
- 60
Industry mix (Fortune 500 HQ in IL)
| Industry | F500 HQs | Revenue |
|---|---|---|
| Insurance | 4 | $201B |
|
||
| Consumer Goods | 4 | $87B |
|
||
| Industrial Machinery | 3 | $64B |
|
||
| Healthcare | 2 | $55B |
|
||
| Retail / Pharmacy | 1 | $148B |
|
||
| Agriculture / Food | 1 | $86B |
|
||
Price history
+101.9% since first listed9 events — show timeline
- 2026-03-03 Listed $94,900 MRED as Distributed by MLS Grid
- 2026-02-17 Listing Removed — MRED as Distributed by MLS Grid
- 2025-02-18 Listed — MRED as Distributed by MLS Grid
- 2022-07-13 Sold (MLS) $85,000 MRED as Distributed by MLS Grid
- 2022-04-03 Pending — MRED as Distributed by MLS Grid
- 2021-11-13 Listed $89,000 MRED as Distributed by MLS Grid
- 2019-05-30 Sold (Public Records) $56,000 Public Records
- 2005-12-22 Sold (Public Records) $39,000 Public Records
- 1997-11-10 Sold (Public Records) $47,000 Public Records
Property tax history
+5.9%/yrLatest (2023): $690 · +8.0% YoY. Source: county tax records.
Cash-flow waterfall
monthlySold comps — $/sqft
last 12 mo · ≤1 miLoading sold comps…