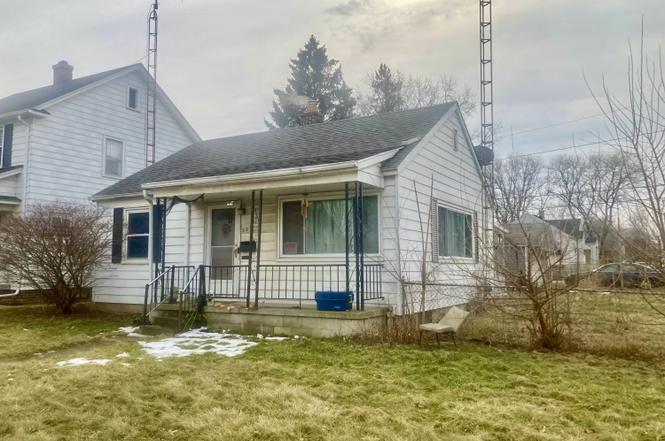
223 W Capistrano Ave · Toledo, OH
Flood risk 1/10 · Minimal
- FEMA flood zone
- X (unshaded)
- Chance of flooding over 30 yrs
- 0.0%
- Est. flood insurance / yr
- $473 – $860
Fire risk 1/10 · Minimal
- Est. fire insurance / yr
- $713 – $1,323
Heat risk 3/10 · Minor
- Hot days now (above 100°F)
- 7 days/yr
- Hot days in 30 yrs
- 16 days/yr
Wind risk 2/10 · Minimal
- Chance of severe wind over 30 yrs
- —
Air-quality risk 2/10 · Minimal
- Unhealthy air days now
- 1 days/yr
- Unhealthy air days in 30 yrs
- 3 days/yr
Risk factors via First Street. Map © Google.
Why this score? — see what drove the B+ grade
The composite is a weighted blend of 9 inputs, each scored 0–100. Each bar is that input's sub-score; the figure is the points it added to the 100-point composite (weight × sub-score).
- Cash flow +30.0/30.0
- ARV discount +15.0/15.0
- 1% rule +10.0/10.0
- DSCR +10.0/10.0
- Rent growth +4.0/5.0
- Schools +3.5/10.0
- Livability +3.3/5.0
- Condition / age +2.5/5.0
- Appreciation +0.0/10.0
$60,000
🖨 Deal sheet 📄 Offer letter ✓ Due diligence
Listing remarks MLS
Charming home w/a fenced in yard & a heated 2 car garage. Finished basement w/dry bar & a second full bathroom gives you extra living space not included in sq. footage. Basement was waterproofed by Seagate. Relaxing enclosed 240 sq. ft. porch on the back of the house also not in sq. footage. Hardwood flrs under the carpet. All appliances included.
Key facts
- Heated garage
- Dry bar
- Finished basement
Tags
Property features AI
Exterior
- Parking: Detached garage (approximately 2.5 car capacity)
- Utilities: Cable available; Electricity available (circuit breakers); Natural gas available; Public water; Public sewer (connected)
- Home design: Single-family detached house; One story
- Construction: Aluminum siding; Block foundation
- Exterior features: Shingle roof; Level lot; City street frontage; Asphalt road
Interior
- Kitchen: Kitchen on main level (approx. 13 x 10); Water heater
- Bedrooms: Primary bedroom on main level (approx. 13 x 11) with ceiling fan; Second bedroom on main level (approx. 11 x 9) with ceiling fan; Third bedroom on main level (approx. 9 x 8) with ceiling fan
- Flooring: Carpet; Hardwood
- Bathrooms: 2 full bathrooms
- Heating & cooling: Forced air heating (natural gas); Central air conditioning
- Interior features: Ceiling fans throughout; Finished basement; 7 total rooms
- Laundry & utility: Laundry located in basement
Neighborhood map
What this means for you Summary
Snapshot
- This is a 3-bed/1.5-bath single-family listed at $60k.
Deal economics
- At list price, monthly cash flow is $381 ($5k/yr) — positive.
- The deal already cash-flows at list — no discount required.
- Meets the 1% rule at list price ($1k rent vs $60k).
- Recommended offer: $56k (6.0% below list) — sets the bar for market timing.
- Cap rate 13.9% vs local median 7.6% in Toledo — top-decile yield for the area; either an underpriced asset or a hidden risk that comps aren't pricing in. Stress-test before assuming the spread holds.
Location & tenants
- Location reads 66/100 on livability (#645 in OH) — a middle-class / working-renter tenant base. Strengths: cost of living A+, housing A+, health & safety A+; Watch: amenities C-, crime F, commute F.
- Washington Local (urban): math 37% / reading 47% proficiency, ranked #528 of 656 in OH (top 80%) — families likely to look elsewhere, expect single-tenant / working-renter base with shorter leases.
- Zoned schools: Greenwood Elementary School (math 34% / reading 41%, grade F, #1,083 of 1,584 statewide, top 69%, 526 students, 66% FRL); Whitmer High School (math 38% / reading 48%, grade F, #494 of 781 statewide, top 63%, 2,247 students, 42% FRL).
- Market conditions: Rents rising fast (+6.0%/yr); 92 active listings in the ZIP; 19 comparable units currently listed for rent nearby; rentals at typical pace (median 23d on market — plan ~3-4 weeks tenant-placement turnaround); 415 units permitted in Lucas County in 2024 (122 in 5+ unit buildings).
Forward outlook
- Local home prices are declining (-3.0%/yr); year-one equity from $415 of loan paydown is wiped out by about $2k of value loss. Plan a longer hold.
- Lucas County population projected at -16% by 2050 — secular population decline; favor cash flow + early exit over multi-decade hold.
- At projected returns (-3.0% appreciation + 6.0% rent growth), your $17k cash investment doubles in ~4 years — after that, you're playing with house money.
Negotiation context
- It's been on market 66 days — a 6% lower offer ($56k) is reasonable based on typical stale-listing flexibility.
- 4 sale attempts since 19y ago with the ask held roughly flat each time — persistent listings suggest the price (not the market) is what's stuck; bring a comps-based counter.
Risks & watch-outs
- Watch-outs: property tax is 3.9% of price; built in 1947 — expect roof / HVAC / electrical / plumbing capex.
Questions for the listing agent
- It's been on market 66 days. Have you received any prior offers? Is the seller open to a 6% concession, seller financing, or rate buy-down credit?
- Built in 1947 — when were the roof, HVAC, electrical panel, plumbing, and water heater last replaced?
- Property tax is high relative to price — has the assessment been appealed recently, and will the sale trigger a re-assessment?
- Why hasn't it sold? Are there any deal-killer items the seller is aware of (foundation, flood, title, zoning, code violations)?
- Is there a deadline driving the sale (1031 exchange, divorce, estate, relocation)? That informs how much negotiation room exists.
- Schools are D-rated, which usually means shorter tenancies and higher turnover. Who's the typical renter profile here, and what's been the actual vacancy rate?
- Crime grade is F in this area — have there been break-ins, vandalism, or insurance claims at this property in the last 3 years? What carrier currently insures it and at what premium?
- What's the average days-on-market for RENTAL listings here right now (not sales)? A rising rental-DOM trend means longer vacancies and softer asking-rent achievability than the comps imply.
- What's the recent tenant-quality profile in this submarket — average credit score on applications, eviction rate, late-payment / NSF rate, and stable-employment percentage? A property-management company in the area should have these aggregated.
- How much new for-sale + rental construction is in the pipeline within 1–3 miles? Heavy new supply typically softens prices + rents 12–24 months out; constrained supply supports both.
Investment metrics
- 1% rule
- 1.93% ✓
- Cap rate
- 13.92%
- Cash-on-cash
- 27.24%
- DSCR
- 2.21
- GRM
- 4.3
CMA / ARV
- ARV (on-the-fly)
- $106,848
- Comps found
- 12
Show comp detail 12 sales within ~0.75 mi
| Address | Dist | Beds/Ba | Sqft | Sold | Price | $/sf | Match |
|---|---|---|---|---|---|---|---|
| 323 W Crawford Ave | 0.12mi | 3/2.0 | 1,008 (0%) | 2mo | $147,500 | $146 | 91 |
| 718 W Capistrano Ave | 0.51mi | 3/1.0 | 945 (-6%) | 1mo | $120,000 | $127 | 63 |
| 706 W Gramercy Ave | 0.50mi | 2/1.0 (-1) | 966 (-4%) | 2mo | $99,000 | $102 | 61 |
| 904 Annabelle Dr | 0.66mi | 3/1.0 | 972 (-4%) | 2mo | $102,000 | $105 | 60 |
| 802 W Capistrano Ave | 0.60mi | 3/1.0 | 1,102 (+9%) | 1mo | $150,000 | $136 | 54 |
| 520 Waggoner Blvd | 0.43mi | 2/1.0 (-1) | 896 (-11%) | 2mo | $110,000 | $123 | 53 |
| 610 Dryden Dr | 0.70mi | 3/1.5 | 1,087 (+8%) | 2mo | $71,500 | $66 | 53 |
| 4352 Packard Rd | 0.58mi | 2/1.5 (-1) | 926 (-8%) | 2mo | $56,650 | $61 | 53 |
| 803 Mayfair Blvd | 0.69mi | 3/1.0 | 1,123 (+11%) | 1mo | $169,000 | $150 | 46 |
| 4449 Burnham Ave | 0.58mi | 3/1.0 | 1,150 (+14%) | 2mo | $119,900 | $104 | 45 |
| 4406 Asbury Dr | 0.71mi | 4/2.0 (+1) | 1,089 (+8%) | 2mo | $115,000 | $106 | 45 |
| 826 W Gramercy Ave | 0.63mi | 3/1.0 | 1,143 (+13%) | 2mo | $103,000 | $90 | 45 |
Match score weights: distance 35% · size 25% · config 20% · recency 20%. Top-matched comps best support the ARV.
Projected returns pro-forma
-3.0% appreciation · 6.01% rent growth · sell at horizon
- IRR
- 25.2%
- Equity multiple
- 2.09×
- Total profit
- $18,278
- Equity at exit
- $8,946
- IRR
- 35.0%
- Equity multiple
- 4.77×
- Total profit
- $63,370
- Equity at exit
- $5,188
Cash invested: $16,800 (down + closing). Projections, not guarantees.
Landlord ↔ Tenant lean methodology
- Overall (STATE)
- 73 Landlord-Friendly
- State Ohio
- 73 Landlord-Friendly · R+6
- County
- — inherits STATE
- City
- — inherits STATE
ZIP-level market 43612
- Home prices YoY
- -17.5%
- Rents YoY
- 6.0%
- Active inventory
- 92
- Price-to-rent
- 4.3×
Monthly cashflow live
- Estimated rent
- $1,161 high interval (Pro) →
- Mortgage (P&I)
- −$315
- Tax from tax record
- −$196 /mo · $2,351/yr
- Insurance
- −$25
- HOA
- −$0
- Vacancy / Maint / Mgmt
- −$244
- Net cashflow
- $381
Break-even live
UW: 25.0% down · 7.5% · 30yr · 1.5% tax · 5.0% vac · 8.0% maint · 8.0% mgmt
Financing live
Cash to close
- Down payment
- $15,000
- Closing costs
- $1,800
- Reserves months
- —
- Total cash needed
- —
Loan-product check · same deal, 3 products live
Conventional
25% down · 7.5% · 30yr
- Down + closing
- —
- Monthly P&I
- —
- Monthly cashflow
- —
- DSCR
- —
- Eligible?
- —
Personal DTI + credit; lowest rate.
DSCR
20% down · 8.5% · 30yr
- Down + closing
- —
- Monthly P&I
- —
- Monthly cashflow
- —
- DSCR
- —
- Eligible?
- —
No personal income docs; deal must DSCR.
Hard money
10% down · 12.0% · 12mo
- Down + closing
- —
- Monthly P&I
- —
- Monthly cashflow
- —
- DSCR
- —
- Eligible?
- —
Short-term bridge; refi at stabilization.
Rent comps 19 comps
| Address | Beds | Baths | Sqft | Rent | $/sqft | DOM | Units | Dist |
|---|---|---|---|---|---|---|---|---|
| 244 Sunset Blvd Toledo, OH | 2.0 | 1.0 | 726 | $1,045 | $1.44 | 21d | 1 | 0.29mi |
| 5207 Bennett Rd Toledo, OH | 2.0 | 2.0 | 1109 | $1,200 | $1.08 | 13d | 1 | 0.47mi |
| 823 Custer Dr Unit Upstairs Toledo, OH | 2.0 | 1.0 | 700 | $925 | $1.32 | 13d | 1 | 0.64mi |
| 4406 Asbury Dr Toledo, OH | 4.0 | 2.0 | 1089 | $1,550 | $1.42 | 13d | 1 | 0.74mi |
| 4220 Caroline Ave Toledo, OH | 3.0 | 1.0 | 944 | $1,095 | $1.16 | 43d | 1 | 0.77mi |
| 4140 Caroline Ave Toledo, OH | 3.0 | 1.5 | 1378 | $1,650 | $1.20 | 23d | 1 | 0.82mi |
| 4124 Vermaas Ave Toledo, OH | 2.0 | 1.0 | 1245 | $997 | $0.80 | 43d | 1 | 0.91mi |
| 4129 Vermaas Ave Toledo, OH | 3.0 | 1.5 | 1385 | $1,250 | $0.90 | 43d | 1 | 0.92mi |
| 927 W Northgate Pkwy Toledo, OH | 2.0 | 1.0 | 896 | $1,100 | $1.23 | 13d | 1 | 0.92mi |
| 4039 Vermaas Ave Toledo, OH | 2.0 | 1.0 | 900 | $900 | $1.00 | 23d | 1 | 0.97mi |
| 3950 Woodhaven Dr Toledo, OH | 2.0 | 1.0 | 1072 | $745 | $0.69 | 23d | 1 | 1.03mi |
| 4459 N Haven Ave Toledo, OH | 3.0 | 1.0 | 1416 | $1,200 | $0.85 | 13d | 1 | 1.04mi |
| 4158 Mayfield Dr Toledo, OH | 2.0 | 1.0 | 960 | $850 | $0.89 | 13d | 1 | 1.13mi |
| 1016 Mallett St Unit 1 Toledo, OH | 2.0 | 1.0 | 1300 | $900 | $0.69 | 43d | 1 | 1.15mi |
| 540 W Alexis Rd Toledo, OH | 1.0–2.0 | 1.0 | 725 | $944 | $1.30 | 13d | 14 | 1.18mi |
| 1338 Crestwood Rd Toledo, OH | 3.0 | 1.0 | 1000 | $1,250 | $1.25 | 13d | 1 | 1.22mi |
| 4138 N Lockwood Ave Toledo, OH | 2.0 | 1.0 | 1300 | $1,050 | $0.81 | 23d | 1 | 1.25mi |
| 1014 Berdan Ave Toledo, OH | 3.0 | 1.0 | 1215 | $1,200 | $0.99 | 43d | 1 | 1.40mi |
| 4223 Birchall Rd Toledo, OH | 3.0 | 1.0 | 1338 | $1,395 | $1.04 | 23d | 1 | 1.49mi |
Listing history 10 events
-
2026-04-24status Pending
-
2026-02-17$60,000 Active
-
2025-10-13price $59,000 357-char remark
Show marketing remark (357 chars)
Charming home w/a fenced in yard & a heated 2 car garage. Finished basement w/dry bar & a second full bathroom gives you extra living space not included in sq. footage. Basement was waterproofed by Seagate. Relaxing enclosed 240 sq. ft. porch on the back of the house also not in sq. footage. Hardwood flrs under the carpet. All appliances included.
-
2009-11-06soldstatus $59,000
-
2009-10-30soldstatus $59,000 357-char remark
Show marketing remark (357 chars)
Charming home w/a fenced in yard & a heated 2 car garage. Finished basement w/dry bar & a second full bathroom gives you extra living space not included in sq. footage. Basement was waterproofed by Seagate. Relaxing enclosed 240 sq. ft. porch on the back of the house also not in sq. footage. Hardwood flrs under the carpet. All appliances included.
-
2009-08-25$64,900 357-char remark
Show marketing remark (357 chars)
Charming home w/a fenced in yard & a heated 2 car garage. Finished basement w/dry bar & a second full bathroom gives you extra living space not included in sq. footage. Basement was waterproofed by Seagate. Relaxing enclosed 240 sq. ft. porch on the back of the house also not in sq. footage. Hardwood flrs under the carpet. All appliances included.
-
2009-08-04historical
-
2008-06-25$69,900
-
2008-06-24historical
-
2007-10-26$79,900
ⓘ Source: listings_history table (triggers on properties + properties_extension) + one-shot
backfill from property_details.listing_events for pre-trigger history.
Tax reassessment forecast OH · Partial reset (capped growth)
- Current annual tax
- $2,351 · $196/mo
- Projected year-2 tax
- $2,351 · $196/mo
- Expected delta
- $0/yr ($0/mo · 0.0%)
ⓘ Screening estimate from a state-policy table — verify with the county assessor before closing.
Climate risk First Street
- Flood 1/10 Low FEMA zone X (unshaded) · 0% chance over 30 yrs
- Wildfire 1/10 Low
- Heat 3/10 Moderate 7 d/yr ≥100°F today · 16 d/yr by 30 yrs out
- Wind 2/10 Low
- Air quality 2/10 Low 1 unhealthy d/yr today · 3 by 30 yrs out
Nearby sold comps map
Loading sold comps map…
Walkable amenities ~0.75 mi
Loading nearby amenities…
Taxation est. · year 1
- Rental income
- $13,927
- − Mortgage interest
- −$3,361
- − Property taxes
- −$2,351
- − Insurance
- −$300
- − Repairs & maintenance
- −$1,114
- − Management
- −$1,114
- − Depreciation
- −$1,745
- Taxable income
- $3,942
- Est. tax owed @ 24.0%
- −$946
- After-tax cash flow
- $3,630/yr
For passive investors: Depreciation is non-cash, so a rental often shows a tax loss while cash-flowing — sheltering income. Rental losses are passive: they offset passive income freely, and up to $25,000/yr can offset ordinary (W-2) income if you actively participate and your MAGI is under $100k (phasing out to $0 by $150k); unused losses carry forward. On sale, claimed depreciation is recaptured at up to 25%, and gains may owe capital-gains tax (a 1031 exchange can defer both). Figures are a year-1 estimate at your 24.0% rate — not tax advice; consult a CPA.
Schools (NCES district)
- District
- Washington Local
- NCES district ID
- 3904823
- Math proficiency
- 37% ▼ -20.00%
- Reading proficiency
- 47% ▼ -11.00%
- Median HH income
- $42,105
- Composite
- 35.36/100
- National rank
- #4957
- State rank
- #528 of 656 in OH
Livability — Toledo
- Score
- 66/100
- State rank
- #645
- US rank
- #11442
Category grades
Schools grade is shown separately in the Schools card above.
Census & demographics
- Census place
- Toledo, OH
- County
- Lucas County · 380,724 people
- City population
- 280,811
- Metro
- Toledo, OH
- Population (ZIP)
- 28,480
- Household income
- $50,728
- Rent vs Own
- Severe rent burden
- 1203.0
Population outlook (Lucas County) Hauer SSP2
- Today (2025)
- 420,751 people
- By 2030
- 410,187 · -2.5%
- By 2040
- 384,019 · -8.7%
- By 2050
- 355,125 · -15.6%
- By 2075
- 291,683 · -30.7%
- By 2100
- 233,670 · -44.5%
Race, ethnicity, and origin ACS 2023
- Neighborhood character
- Majority White (63%)
- Race & ethnicity
- White 63% Black 23% Two or more races 10% Hispanic / Latino 9%
- Hispanic origin (detail)
- Mexican 6% Puerto Rican 2%
- Common ancestry
- Romanian 9% Lithuanian 3% Italian 1%
- Foreign-born
- 2% · Canada
- Languages at home
- 96% English-only · Spanish 2% French/Haitian/Cajun 1%
Political lean MEDSL · Lucas
- 2024 margin
- D (+12.6) · D 55.8% · R 43.2%
- 2008→2024 swing
- -18.9pp toward R · 2008: 31.4pp · 2024: 12.6pp
- All cycles
- 2024: D+12.6 2020: D+16.8 2016: D+17.4 2012: D+30.4 2008: D+31.4
Not yet ingested
- Civics
- —
Market trends
- HPI YoY
- ▼ -50.05%
- Current HPI
- 235.5389
- Rent YoY
- ▲ 6.01%
- Metro
- Toledo, OH
- State GDP YoY
- ▲ 1.98%
- F500 in state
- 48
Industry mix (Fortune 500 HQ in OH)
| Industry | F500 HQs | Revenue |
|---|---|---|
| Insurance | 3 | $145B |
|
||
| Industrial Machinery | 3 | $49B |
|
||
| Financial Services | 3 | $24B |
|
||
| Consumer Goods | 2 | $93B |
|
||
| Aerospace / Defense | 2 | $47B |
|
||
| Utilities | 2 | $33B |
|
||
Price history
-24.9% since first listed10 events — show timeline
- 2026-04-24 Pending — NORIS
- 2026-02-17 Listed $60,000 NORIS
- 2025-10-13 Price Changed $59,000 NORIS
- 2009-11-06 Sold (Public Records) $59,000 Public Records
- 2009-10-30 Sold (MLS) $59,000 NORIS
- 2009-08-25 Listed $64,900 NORIS
- 2009-08-04 Listing Removed — NORIS
- 2008-06-25 Listed $69,900 NORIS
- 2008-06-24 Listing Removed — NORIS
- 2007-10-26 Listed $79,900 NORIS
Property tax history
+3.5%/yrLatest (2025): $2,351 · +8.8% YoY. Source: county tax records.
Cash-flow waterfall
monthlySold comps — $/sqft
last 12 mo · ≤1 miLoading sold comps…