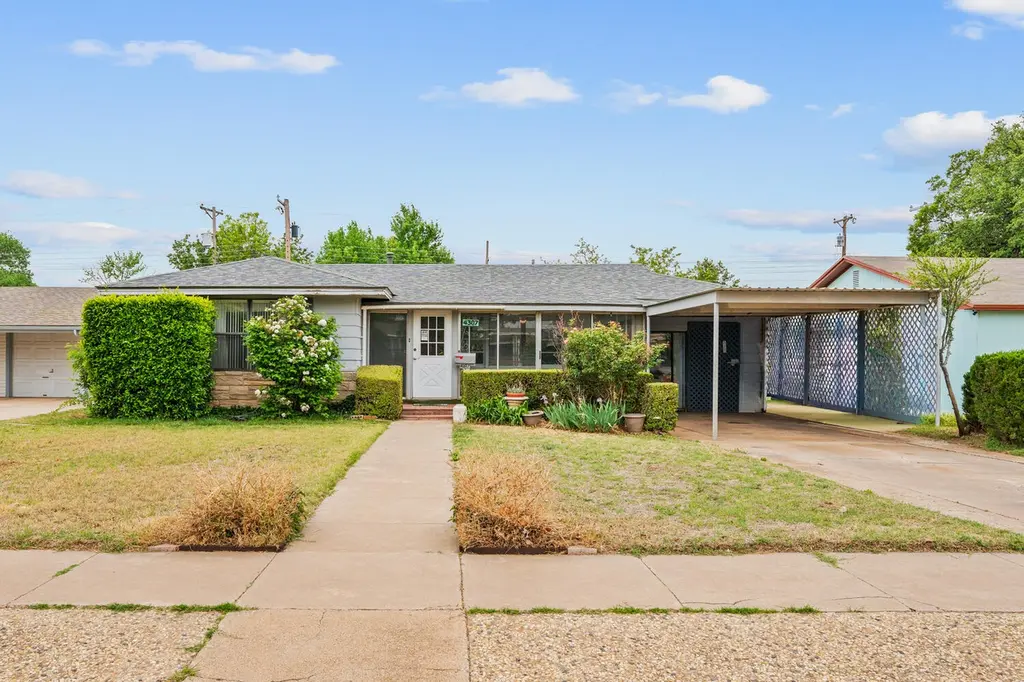
4307 41st St · Lubbock, TX
Flood risk 1/10 · Minimal
- FEMA flood zone
- X (unshaded)
- Chance of flooding over 30 yrs
- 0.0%
- Est. flood insurance / yr
- $507 – $1,088
Fire risk 1/10 · Minimal
- Est. fire insurance / yr
- $1,222 – $2,270
Heat risk 5/10 · Moderate
- Hot days now (above 99°F)
- 7 days/yr
- Hot days in 30 yrs
- 21 days/yr
Wind risk 2/10 · Minimal
- Chance of severe wind over 30 yrs
- —
Air-quality risk 2/10 · Minimal
- Unhealthy air days now
- 1 days/yr
- Unhealthy air days in 30 yrs
- 1 days/yr
Risk factors via First Street. Map © Google.
Why this score? — see what drove the C- grade
The composite is a weighted blend of 9 inputs, each scored 0–100. Each bar is that input's sub-score; the figure is the points it added to the 100-point composite (weight × sub-score).
- Cash flow +16.8/30.0
- ARV discount +15.0/15.0
- DSCR +5.2/10.0
- 1% rule +5.0/10.0
- Livability +4.0/5.0
- Schools +3.1/10.0
- Rent growth +3.0/5.0
- Condition / age +2.5/5.0
- Appreciation +0.0/10.0
$160,000
🖨 Deal sheet 📄 Offer letter ✓ Due diligence
Listing remarks
Owned by the same family for decades, this home has been loved and cared for. Located in a well established Lubbock neighborhood, it offers generous space throughout to give you the flexibility to live comfortably. The living and dining areas flow seamlessly into additional living spaces, creating a layout that's both open and functional. Offering three bedrooms and two bathrooms, along with a converted garage that provides an additional flex space. Enjoy time on the covered patio, perfect for morning coffee or winding down in the evenings. The backyard also features a work shed, offering additional space for storage, tools, or weekend projects. With close proximity to parks, restaurants, t
Key facts
- Covered patio
- Work shed
- 7,500 sq ft lot
Tags
Property features AI
Finance
- HOA & community: Playground in the community
Exterior
- Parking: Carport (1 space); Converted garage
- Utilities: Standard utilities (water, sewer, power not specified)
- Home design: Single family residence; Residential property
- Construction: Stone and wood siding construction; Pillar/post/pier foundation; Composition roof; Built on 1 story (above grade finished area 1,891)
- Exterior features: Enclosed patio/porch; Fenced backyard; No additional exterior features listed
Interior
- Kitchen: Range; Free-standing range; Gas water heater
- Flooring: Carpet
- Bathrooms: 2 full bathrooms
- Heating & cooling: Central heating; Central air conditioning
- Interior features: Other interior features
- Laundry & utility: Laundry located in the kitchen
Neighborhood map
What this means for you Summary
Snapshot
- This is a 3-bed/2.0-bath single-family listed at $160k.
Deal economics
- At list price, monthly cash flow is $103 ($1k/yr) — positive.
- The deal already cash-flows at list — no discount required.
- To meet the 1% rule (rent ≥ 1% of price), the offer needs to be $160k (0.2% below list).
- Recommended offer: $155k (3.0% below list) — sets the bar for market timing.
Location & tenants
- Location reads 80/100 on livability (#37 in TX, #1,749 nationally) — a professional / high-income tenant draw. Strengths: commute A+, cost of living A+, housing A+; Watch: employment C-, crime F.
- Lubbock ISD (urban): math 36% / reading 39% proficiency, ranked #481 of 826 in TX (top 58%) — families likely to look elsewhere, expect single-tenant / working-renter base with shorter leases; 60% free/reduced lunch — lower-income household profile, screen leases tightly.
- Zoned schools: Maedgen El (math 37% / reading 27%, grade F, #2,268 of 4,322 statewide, top 55%, 323 students, 91% FRL); Hutchinson Middle (math 57% / reading 63%, grade B, #158 of 1,662 statewide, top 10%, 833 students, 49% FRL); Monterey H S (math 28% / reading 37%, grade F, #1,029 of 1,632 statewide, top 64%, 2,114 students, 72% FRL).
- Market conditions: Rents rising (+1.9%/yr); 183 active listings in the ZIP; 40 comparable units currently listed for rent nearby; rentals lingering (median 44d on market — plan ~5-8 weeks vacancy on turnover, expect pricing pressure); 52% of comp listings sitting > 30 days — soft ceiling on asking rent; 2,219 units permitted in Lubbock County in 2024 (252 in 5+ unit buildings).
Forward outlook
- Local home prices are declining (-3.0%/yr); year-one equity from $1k of loan paydown is wiped out by about $5k of value loss. Plan a longer hold.
- Lubbock County population projected at +39% by 2050 — long-run rental-demand tailwind backs the buy-and-hold thesis.
Negotiation context
- It's been on market 53 days — a 3% lower offer ($155k) is reasonable based on typical stale-listing flexibility.
- 2 sale attempts; this cycle's ask has dropped $10k (6%) from the opening price — seller is motivated, your offer sets the floor, not the list.
Risks & watch-outs
- Watch-outs: built in 1952 — expect roof / HVAC / electrical / plumbing capex.
- Climate carrying-cost: extreme-heat days projected 7→21/yr by 2055 (HVAC capex compounding) — expect insurance premiums to compound above CPI over the hold.
Questions for the listing agent
- It's been on market 53 days. Have you received any prior offers? Is the seller open to a 3% concession, seller financing, or rate buy-down credit?
- Built in 1952 — when were the roof, HVAC, electrical panel, plumbing, and water heater last replaced?
- Is there a deadline driving the sale (1031 exchange, divorce, estate, relocation)? That informs how much negotiation room exists.
- Schools are D-rated, which usually means shorter tenancies and higher turnover. Who's the typical renter profile here, and what's been the actual vacancy rate?
- Crime grade is F in this area — have there been break-ins, vandalism, or insurance claims at this property in the last 3 years? What carrier currently insures it and at what premium?
- What's the average days-on-market for RENTAL listings here right now (not sales)? A rising rental-DOM trend means longer vacancies and softer asking-rent achievability than the comps imply.
- What's the recent tenant-quality profile in this submarket — average credit score on applications, eviction rate, late-payment / NSF rate, and stable-employment percentage? A property-management company in the area should have these aggregated.
- How much new for-sale + rental construction is in the pipeline within 1–3 miles? Heavy new supply typically softens prices + rents 12–24 months out; constrained supply supports both.
Investment metrics
- 1% rule
- 1.00% ✗
- Cap rate
- 7.07%
- Cash-on-cash
- 2.77%
- DSCR
- 1.12
- GRM
- 8.4
CMA / ARV
- ARV (median comp)
- $209,025
- List price
- $160,000
- Delta
- -23.45%
- Verdict
- UNDERPRICED
- Comps
- 3 within 1.0 mi
Show comp detail 1 sale within ~0.75 mi
| Address | Dist | Beds/Ba | Sqft | Sold | Price | $/sf | Match |
|---|---|---|---|---|---|---|---|
| 4203 38th St | 0.21mi | 4/3.0 (+1) | 2,151 (+9%) | 11mo | $174,999 | $81 | 58 |
Match score weights: distance 35% · size 25% · config 20% · recency 20%. Top-matched comps best support the ARV.
Projected returns pro-forma
-3.0% appreciation · 1.94% rent growth · sell at horizon
- IRR
- -13.1%
- Equity multiple
- 0.53×
- Total profit
- $-20,965
- Equity at exit
- $23,857
- IRR
- -5.9%
- Equity multiple
- 0.64×
- Total profit
- $-16,310
- Equity at exit
- $13,834
Cash invested: $44,800 (down + closing). Projections, not guarantees.
Landlord ↔ Tenant lean methodology
- Overall (STATE)
- 87 Strongly Landlord-Friendly
- State Texas
- 87 Strongly Landlord-Friendly · R+5
- County
- — inherits STATE
- City
- — inherits STATE
ZIP-level market 79413
- Rents YoY
- 1.9%
- Active inventory
- 183
- Price-to-rent
- 8.4×
Monthly cashflow live
- Estimated rent
- $1,596 high interval (Pro) →
- Mortgage (P&I)
- −$839
- Tax from tax record
- −$252 /mo · $3,024/yr
- Insurance
- −$67
- HOA
- −$0
- Vacancy / Maint / Mgmt
- −$335
- Net cashflow
- $103
Break-even live
UW: 25.0% down · 7.5% · 30yr · 1.5% tax · 5.0% vac · 8.0% maint · 8.0% mgmt
Financing live
Cash to close
- Down payment
- $40,000
- Closing costs
- $4,800
- Reserves months
- —
- Total cash needed
- —
Loan-product check · same deal, 3 products live
Conventional
25% down · 7.5% · 30yr
- Down + closing
- —
- Monthly P&I
- —
- Monthly cashflow
- —
- DSCR
- —
- Eligible?
- —
Personal DTI + credit; lowest rate.
DSCR
20% down · 8.5% · 30yr
- Down + closing
- —
- Monthly P&I
- —
- Monthly cashflow
- —
- DSCR
- —
- Eligible?
- —
No personal income docs; deal must DSCR.
Hard money
10% down · 12.0% · 12mo
- Down + closing
- —
- Monthly P&I
- —
- Monthly cashflow
- —
- DSCR
- —
- Eligible?
- —
Short-term bridge; refi at stabilization.
Rent comps 40 comps
| Address | Beds | Baths | Sqft | Rent | $/sqft | DOM | Units | Dist |
|---|---|---|---|---|---|---|---|---|
| 4211 41st St Lubbock, TX | 4.0 | 2.0 | 1960 | $1,599 | $0.82 | 44d | 1 | 0.06mi |
| 4310 42nd St Lubbock, TX | 3.0 | 2.0 | 1754 | $1,700 | $0.97 | 44d | 1 | 0.06mi |
| 4315 41st St Lubbock, TX | 3.0 | 2.0 | 1558 | $1,450 | $0.93 | 21d | 1 | 0.08mi |
| 3812 36th St Unit A Lubbock, TX | 3.0 | 2.0 | 1458 | $1,500 | $1.03 | 21d | 1 | 0.44mi |
| 3712 37th St Lubbock, TX | 4.0 | 2.0 | 1672 | $2,100 | $1.26 | 44d | 1 | 0.50mi |
| 4619 43rd St Lubbock, TX | 3.0 | 1.0 | 1404 | $1,500 | $1.07 | 44d | 1 | 0.50mi |
| 3708 46th St Lubbock, TX | 3.0 | 2.0 | 2378 | $1,750 | $0.74 | 13d | 1 | 0.54mi |
| 4708 43rd St Lubbock, TX | 3.0 | 1.5 | 1249 | $1,350 | $1.08 | 44d | 1 | 0.54mi |
| 4606 35th St Lubbock, TX | 4.0 | 2.0 | 1684 | $1,800 | $1.07 | 44d | 1 | 0.56mi |
| 3712 47th St Lubbock, TX | 3.0 | 2.0 | 1767 | $1,400 | $0.79 | 21d | 1 | 0.56mi |
| 3612 44th St Lubbock, TX | 3.0 | 2.0 | 1675 | $1,850 | $1.10 | 44d | 1 | 0.58mi |
| 4428 33rd St Lubbock, TX | 3.0 | 1.5 | 1685 | $1,375 | $0.82 | 44d | 1 | 0.60mi |
| 4430 33rd St Lubbock, TX | 3.0 | 2.0 | 1402 | $1,100 | $0.78 | 44d | 1 | 0.60mi |
| 4602 50th St Lubbock, TX | 1.0–3.0 | 1.0–2.5 | 1080 | $1,368 | $1.27 | 13d | 9 | 0.63mi |
| 4803 43rd St Lubbock, TX | 3.0 | 2.0 | 1412 | $1,200 | $0.85 | 21d | 1 | 0.66mi |
| 4210 52nd St Lubbock, TX | 3.0 | 2.0 | 1715 | $1,575 | $0.92 | 13d | 1 | 0.68mi |
| 4314 52nd St Unit A Lubbock, TX | 3.0 | 2.0 | 1863 | $1,400 | $0.75 | 21d | 1 | 0.68mi |
| 4103 30th St Lubbock, TX | 3.0 | 1.0 | 1323 | $1,250 | $0.94 | 44d | 1 | 0.68mi |
| 4801 36th St Lubbock, TX | 3.0 | 2.0 | 1424 | $1,275 | $0.90 | 21d | 1 | 0.70mi |
| 4817 40th St Lubbock, TX | 3.0 | 2.0 | 1254 | $1,300 | $1.04 | 13d | 1 | 0.73mi |
| 4815 43rd St Lubbock, TX | 3.0 | 2.0 | 1282 | $1,500 | $1.17 | 21d | 1 | 0.74mi |
| 4819 44th St Lubbock, TX | 3.0 | 2.0 | 1412 | $1,300 | $0.92 | 44d | 1 | 0.77mi |
| 4313 53rd St Unit B Lubbock, TX | 2.0 | 1.5 | 1368 | $1,200 | $0.88 | 44d | 1 | 0.77mi |
| 4818 36th St Lubbock, TX | 3.0 | 2.0 | 1285 | $1,400 | $1.09 | 21d | 1 | 0.78mi |
| 3505 46th St Lubbock, TX | 2.0 | 2.0 | 1686 | $1,550 | $0.92 | 44d | 1 | 0.79mi |
| 4702 31st St Lubbock, TX | 3.0 | 2.0 | 1600 | $1,450 | $0.91 | 44d | 1 | 0.82mi |
| 4213 54th St Lubbock, TX | 3.0 | 2.0 | 1680 | $1,550 | $0.92 | 13d | 1 | 0.83mi |
| 3408 38th St Lubbock, TX | 3.0 | 2.0 | 1927 | $1,895 | $0.98 | 44d | 1 | 0.85mi |
| 3404 42nd St Lubbock, TX | 3.0 | 2.0 | 1475 | $1,500 | $1.02 | 44d | 1 | 0.85mi |
| 3417 47th St Lubbock, TX | 3.0 | 2.0 | 1450 | $1,550 | $1.07 | 44d | 1 | 0.86mi |
| 5018 Kenosha Ave Lubbock, TX | 2.0 | 1.5 | 1245 | $1,275 | $1.02 | 13d | 1 | 0.86mi |
| 4916 46th St Lubbock, TX | 3.0 | 2.0 | 1377 | $1,450 | $1.05 | 13d | 1 | 0.89mi |
| 4423 27th St Lubbock, TX | 3.0 | 2.0 | 1268 | $1,600 | $1.26 | 21d | 1 | 0.90mi |
| 5202 Kenosha Ave Lubbock, TX | 2.0 | 1.0–1.5 | 1082 | $1,022 | $0.94 | 21d | 1 | 0.91mi |
| 4324 56th St Lubbock, TX | 4.0 | 2.0 | 2014 | $2,000 | $0.99 | 44d | 1 | 0.93mi |
| 5002 46th St Lubbock, TX | 3.0 | 2.0 | 1369 | $1,450 | $1.06 | 44d | 1 | 0.93mi |
| 3415 49th St Unit B Lubbock, TX | 3.0 | 2.0 | 1410 | $1,350 | $0.96 | 44d | 1 | 0.94mi |
| 4926 48th St Lubbock, TX | 3.0 | 2.0 | 1354 | $1,500 | $1.11 | 21d | 1 | 0.94mi |
| 5302 Kenosha Ave Unit 5324 Kenosha Lubbock, TX | 2.0 | 1.5 | 1300 | $950 | $0.73 | 13d | 1 | 0.94mi |
| 5302 Kenosha Ave Unit 5330 Lubbock, TX | 2.0 | 1.5 | 1300 | $1,050 | $0.81 | 44d | 1 | 0.94mi |
Listing history 17 events
-
2026-06-19status $160,000 Active 53 DOM
-
2026-06-15status $160,000 Pending 53 DOM
-
2026-06-15days on market $160,000 Active 53 DOM
-
2026-06-14days on market $160,000 Active 51 DOM
-
2026-06-13days on market $160,000 Active 50 DOM
-
2026-06-10days on market $160,000 Active 48 DOM
-
2026-06-09days on market $160,000 Active 47 DOM
-
2026-06-08days on market $160,000 Active 46 DOM
-
2026-06-07days on market $160,000 Active 45 DOM
-
2026-06-05days on market $160,000 Active 42 DOM
-
2026-06-03days on market $160,000 Active 41 DOM
-
2026-06-02days on market $160,000 Active 40 DOM
-
2026-06-01pricedays on market $160,000 Active 39 DOM
-
2026-05-31days on market $165,000 Active 38 DOM
-
2026-05-30days on market $165,000 Active 37 DOM
-
2026-05-07price $165,000 885-char remark
-
2026-04-23$170,000 Active 885-char remark
ⓘ Source: listings_history table (triggers on properties + properties_extension) + one-shot
backfill from property_details.listing_events for pre-trigger history.
Tax reassessment forecast TX · Resets to sale price
- Current annual tax
- $3,024 · $252/mo
- Projected year-2 tax
- $3,024 · $252/mo
- Expected delta
- $0/yr ($0/mo · 0.0%)
ⓘ Screening estimate from a state-policy table — verify with the county assessor before closing.
Climate risk First Street
- Flood 1/10 Low FEMA zone X (unshaded) · 0% chance over 30 yrs
- Wildfire 1/10 Low
- Heat 5/10 Major 7 d/yr ≥99°F today · 21 d/yr by 30 yrs out
- Wind 2/10 Low
- Air quality 2/10 Low 1 unhealthy d/yr today · 1 by 30 yrs out
Nearby sold comps map
Loading sold comps map…
Walkable amenities ~0.75 mi
Loading nearby amenities…
Taxation est. · year 1
- Rental income
- $19,158
- − Mortgage interest
- −$8,962
- − Property taxes
- −$3,024
- − Insurance
- −$800
- − Repairs & maintenance
- −$1,533
- − Management
- −$1,533
- − Depreciation
- −$4,655
- Taxable loss
- −$1,349
- Est. tax savings @ 24.0%
- +$324
- After-tax cash flow
- $1,565/yr
For passive investors: Depreciation is non-cash, so a rental often shows a tax loss while cash-flowing — sheltering income. Rental losses are passive: they offset passive income freely, and up to $25,000/yr can offset ordinary (W-2) income if you actively participate and your MAGI is under $100k (phasing out to $0 by $150k); unused losses carry forward. On sale, claimed depreciation is recaptured at up to 25%, and gains may owe capital-gains tax (a 1031 exchange can defer both). Figures are a year-1 estimate at your 24.0% rate — not tax advice; consult a CPA.
Schools (NCES district)
- District
- Lubbock ISD
- NCES district ID
- 4828500
- Math proficiency
- 36% ▼ -8.00%
- Reading proficiency
- 39% ▼ -1.00%
- Median HH income
- $39,820
- Composite
- 31.44/100
- National rank
- #5984
- State rank
- #481 of 826 in TX
Livability — Lubbock
- Score
- 80/100
- State rank
- #37
- US rank
- #1749
Category grades
Schools grade is shown separately in the Schools card above.
Census & demographics
- Census place
- Lubbock, TX
- County
- Lubbock County · 293,542 people
- City population
- 283,030
- Metro
- Lubbock, TX
- Population (ZIP)
- 23,343
- Household income
- $69,400
- Rent vs Own
- Severe rent burden
- 1211.0
Population outlook (Lubbock County) Hauer SSP2
- Today (2025)
- 345,960 people
- By 2030
- 371,449 · +7.4%
- By 2040
- 424,539 · +22.7%
- By 2050
- 481,150 · +39.1%
- By 2075
- 633,467 · +83.1%
- By 2100
- 746,853 · +115.9%
Race, ethnicity, and origin ACS 2023
- Neighborhood character
- Diverse neighborhood (Simpson 0.59)
- Race & ethnicity
- White 54% Hispanic / Latino 34% Two or more races 18% Black 6%
- Hispanic origin (detail)
- Mexican 25%
- Common ancestry
- Slovak 2% Italian 2% Serbian 1%
- Foreign-born
- 3% · Canada, China
- Languages at home
- 88% English-only · Spanish 10% Chinese 1%
Political lean MEDSL · Lubbock
- 2024 margin
- Solid R (+39.5) · D 29.7% · R 69.2% · Other 1.0%
- 2008→2024 swing
- -2.8pp toward R · 2008: -36.7pp · 2024: -39.5pp
- All cycles
- 2024: R+39.5 2020: R+32.2 2016: R+38.4 2012: R+40.9 2008: R+36.7
Not yet ingested
- Civics
- —
Market trends
- HPI YoY
- ▼ -145.52%
- Current HPI
- 239.8854
- Rent YoY
- ▲ 1.94%
- Metro
- Lubbock, TX
- State GDP YoY
- ▲ 3.95%
- F500 in state
- 110
Industry mix (Fortune 500 HQ in TX)
| Industry | F500 HQs | Revenue |
|---|---|---|
| Energy | 16 | $1,198B |
|
||
| Technology | 5 | $198B |
|
||
| Engineering / Construction | 4 | $72B |
|
||
| Energy Services | 3 | $60B |
|
||
| Utilities | 3 | $41B |
|
||
| Healthcare | 2 | $330B |
|
||
Price history
-5.9% since first listed5 events — show timeline
- 2026-06-18 Relisted — LARMLS
- 2026-06-15 Pending — LARMLS
- 2026-06-01 Price Changed $160,000 LARMLS
- 2026-05-07 Price Changed $165,000 LARMLS
- 2026-04-23 Listed $170,000 LARMLS
Property tax history
+3.8%/yrLatest (2025): $3,024 · +4.1% YoY. Source: county tax records.
Cash-flow waterfall
monthlySold comps — $/sqft
last 12 mo · ≤1 miLoading sold comps…