 🏗️ New Construction
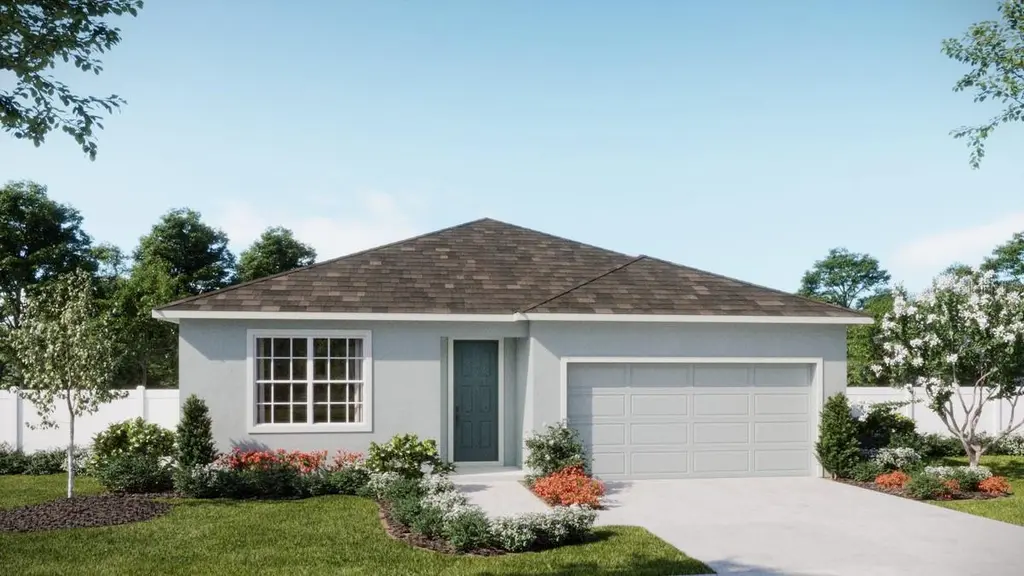
6146 Success Way · St. Cloud, FL
Flood risk 1/10 · Minimal
- FEMA flood zone
- X (unshaded)
- Chance of flooding over 30 yrs
- 0.0%
- Est. flood insurance / yr
- $507 – $1,088
Fire risk 6/10 · Moderate
- Est. fire insurance / yr
- $947 – $1,759
Heat risk 8/10 · Major
- Hot days now (above 108°F)
- 7 days/yr
- Hot days in 30 yrs
- 22 days/yr
Wind risk 10/10 · Severe
- Chance of severe wind over 30 yrs
- 99.0%
Air-quality risk 2/10 · Minimal
- Unhealthy air days now
- 1 days/yr
- Unhealthy air days in 30 yrs
- 1 days/yr
Risk factors via First Street. Map © Google.
Why this score? — see what drove the F grade
The composite is a weighted blend of 9 inputs, each scored 0–100. Each bar is that input's sub-score; the figure is the points it added to the 100-point composite (weight × sub-score).
- Cash flow +7.8/30.0
- ARV discount +7.5/15.0
- Schools +3.6/10.0
- Rent growth +3.3/5.0
- Livability +2.5/5.0
- Condition / age +2.5/5.0
- 1% rule +1.9/10.0
- DSCR +1.9/10.0
- Appreciation +0.0/10.0
$397,990
🖨 Deal sheet (PDF) 📄 Offer letter ✓ Due diligence
Listing remarks
Under Construction. Welcome to the Haven plan – a beautifully designed new home that blends modern elegance with everyday comfort, and the closest available 1-story home to the Community entrance, with no rear neighbors! This spacious 4-bedroom, 2-bath home features an open-concept layout, while stylish tile flooring enhances the main living areas. The well-appointed kitchen comes complete with beautiful cabinetry, granite countertops, a center island, pantry closet, and stainless steel appliances. Ideal for entertaining, the spacious Family Room flows effortlessly from the Dining area. The private Primary Suite offers a quiet retreat with a luxurious ensuite bath featuring dual sinks
Key facts
- No rear neighbors
- 1 story home
- Tile flooring
Tags
Property features AI
Finance
- Other: Total lot approximately 0.13 acre (50 x 115); Canal frontage 50 feet
- Financial info: CDD present
- HOA & community: HOA managed by Real Manage / Ryan Fernandes; Monthly HOA $70 (includes pool); Community pool and playground; Deed restrictions; Irrigation with reclaimed water; No Truck/RV/Motorcycle parking; Sidewalks and street lights; Pets allowed
Exterior
- Parking: Attached 2-car garage (18 x 21); Driveway
- Security: Smoke detectors
- Utilities: Public water; Public sewer; Electricity connected; Water connected; Sewer connected; Cable available; Underground utilities; Sprinkler with recycled water
- Home design: Single family residence; Under construction (projected completion July 2026); One-story; Northwest facing
- Construction: Block and stucco construction; Shingle roof; Slab foundation; New construction by Risewell Homes (model: Haven)
- Exterior features: Patio; Sidewalk; Sliding doors; Paved road access
Interior
- Kitchen: Dishwasher; Disposal; Microwave; Range
- Bedrooms: 4 bedrooms
- Flooring: Carpet; Ceramic tile
- Bathrooms: 2 full bathrooms
- Heating & cooling: Central heating (electric); Central air conditioning
- Interior features: Open floorplan with kitchen/family room combo; Split bedroom layout; Stone counters; Thermostat; Walk-in closets; Double pane insulated windows
- Laundry & utility: Indoor laundry room; Inside utility / great room access
Neighborhood map
What this means for you Summary
Snapshot
- This is a 4-bed/2.0-bath land listed at $398k.
Deal economics
- At list price, monthly cash flow is $-437 ($-5k/yr) — negative.
- To cash-flow at today's rent, offer at most $321k (19.4% below list).
- To meet the 1% rule (rent ≥ 1% of price), the offer needs to be $273k (31.4% below list).
- Recommended offer: $273k (31.4% below list) — sets the bar for 1% rule.
- Cap rate 5.0% vs local median 4.0% in St. Cloud — meaningfully above typical; check what's discounted (condition, days-on-market, listing class) to confirm the premium yield is real.
Location & tenants
- Location reads: area grade F — affects rentability + tenant quality, not the cash-flow math above.
- Osceola (suburban): math 39% / reading 45% proficiency, ranked #60 of 73 in FL (top 82%) — families likely to look elsewhere, expect single-tenant / working-renter base with shorter leases; 60% free/reduced lunch — lower-income household profile, screen leases tightly.
- Zoned schools: Hickory Tree Elementary School (math 64% / reading 59%, grade B, #634 of 2,144 statewide, top 30%, 795 students, 48% FRL); Narcoossee Middle School (math 55% / reading 57%, grade B-, #175 of 571 statewide, top 31%, 1,371 students, 46% FRL); Harmony High School (math 40% / reading 46%, grade F, #255 of 667 statewide, top 39%, 2,822 students, 42% FRL).
- Market conditions: Rents rising (+3.0%/yr); 1396 active listings in the ZIP; 14 comparable units currently listed for rent nearby; rentals at typical pace (median 17d on market — plan ~3-4 weeks tenant-placement turnaround); solid renter incomes; 8,813 units permitted in Osceola County in 2024 (3,072 in 5+ unit buildings).
- This rent runs 34% of the median local income ($97k/yr) — at the standard rent-burdened threshold; future hikes will face affordability resistance.
Forward outlook
- Local home prices are declining (-3.0%/yr); year-one equity from $3k of loan paydown is wiped out by about $12k of value loss. Plan a longer hold.
- Osceola County population projected at +73% by 2050 — long-run rental-demand tailwind backs the buy-and-hold thesis.
Negotiation context
- It's been on market 44 days — a 3% lower offer ($386k) is reasonable based on typical stale-listing flexibility.
Risks & watch-outs
- Climate carrying-cost: severe wind risk, 99% chance of damaging wind over 30y; major wildfire risk; extreme-heat days projected 7→22/yr by 2055 (HVAC capex compounding) — expect insurance premiums to compound above CPI over the hold.
Questions for the listing agent
- What do current leases actually rent for vs. the listed asking? Can we see a recent rent roll and the last 12 months of T-12 income?
- It's been on market 44 days. Have you received any prior offers? Is the seller open to a 31% concession, seller financing, or rate buy-down credit?
- What does the HOA fee cover, when was the last increase, and are there any pending special assessments or reserve-fund shortfalls?
- Is there a deadline driving the sale (1031 exchange, divorce, estate, relocation)? That informs how much negotiation room exists.
- The area grade is low — what's the realistic commute time and amenity access for the typical tenant pool here? Any planned neighborhood developments (good or bad) we should know about?
- What's the average days-on-market for RENTAL listings here right now (not sales)? A rising rental-DOM trend means longer vacancies and softer asking-rent achievability than the comps imply.
- What's the recent tenant-quality profile in this submarket — average credit score on applications, eviction rate, late-payment / NSF rate, and stable-employment percentage? A property-management company in the area should have these aggregated.
- How much new for-sale + rental construction is in the pipeline within 1–3 miles? Heavy new supply typically softens prices + rents 12–24 months out; constrained supply supports both.
Investment metrics
- 1% rule
- 0.69% ✗
- Cap rate
- 4.98%
- Cash-on-cash
- -4.70%
- DSCR
- 0.79
- GRM
- 12.1
CMA / ARV
No comps found within radius.
Projected returns pro-forma
-3.0% appreciation · 3.02% rent growth · sell at horizon
- IRR
- -24.3%
- Equity multiple
- 0.17×
- Total profit
- $-92,308
- Equity at exit
- $59,342
- IRR
- -19.6%
- Equity multiple
- -0.04×
- Total profit
- $-116,194
- Equity at exit
- $34,411
Cash invested: $111,437 (down + closing). Projections, not guarantees.
Landlord ↔ Tenant lean methodology
- Overall (STATE)
- 87 Strongly Landlord-Friendly
- State Florida
- 87 Strongly Landlord-Friendly · R+3
- County
- — inherits STATE
- City
- — inherits STATE
ZIP-level market 34771
- Home prices YoY
- -30.0%
- Rents YoY
- 3.0%
- Active inventory
- 1396
- Price-to-rent
- 12.1×
Monthly cashflow live
- Estimated rent
- $2,732 high interval (Pro) →
- Mortgage (P&I)
- −$2,087
- Tax from tax record
- −$272 /mo · $3,262/yr
- Insurance
- −$166
- HOA
- −$70
- Vacancy / Maint / Mgmt
- −$574
- Net cashflow
- $-437
Break-even live
Sensitivity live
| Price | -10% $-211 | -5% $-324 | +0% $-437 | +5% $-549 | +10% $-662 |
|---|---|---|---|---|---|
| Rent | -10% $-653 | -5% $-545 | +0% $-437 | +5% $-329 | +10% $-221 |
| Rate | -1.0pp $-236 | -0.5pp $-336 | base $-437 | +0.5pp $-540 | +1.0pp $-645 |
UW: 25.0% down · 7.5% · 30yr · 1.5% tax · 5.0% vac · 8.0% maint · 8.0% mgmt
Financing live
Cash to close
- Down payment
- $99,498
- Closing costs
- $11,940
- Reserves months
- —
- Total cash needed
- —
Loan-product check · same deal, 3 products live
Conventional
25% down · 7.5% · 30yr
- Down + closing
- —
- Monthly P&I
- —
- Monthly cashflow
- —
- DSCR
- —
- Eligible?
- —
Personal DTI + credit; lowest rate.
DSCR
20% down · 8.5% · 30yr
- Down + closing
- —
- Monthly P&I
- —
- Monthly cashflow
- —
- DSCR
- —
- Eligible?
- —
No personal income docs; deal must DSCR.
Hard money
10% down · 12.0% · 12mo
- Down + closing
- —
- Monthly P&I
- —
- Monthly cashflow
- —
- DSCR
- —
- Eligible?
- —
Short-term bridge; refi at stabilization.
Rent comps 14 comps
| Address | Beds | Baths | Sqft | Rent | $/sqft | DOM | Units | Dist |
|---|---|---|---|---|---|---|---|---|
| 1978 Education St Saint Cloud, FL | 3.0 | 2.5 | 1728 | $2,400 | $1.39 | 19d | 1 | 0.17mi |
| 6008 Vision Rd Saint Cloud, FL | 4.0 | 2.0 | 2103 | $2,450 | $1.17 | 16d | 1 | 0.25mi |
| 1874 Crooked Creek St Saint Cloud, FL | 3.0–5.0 | 2.0–3.0 | 2046 | $2,648 | $1.29 | 25d | 1 | 0.27mi |
| 2042 Iorio St Saint Cloud, FL | 4.0 | 2.0 | 1862 | $2,600 | $1.40 | 25d | 1 | 0.29mi |
| 6107 Wooded Brush Aly Saint Cloud, FL | 5.0 | 3.0 | 2603 | $2,600 | $1.00 | 5d | 1 | 0.42mi |
| 6107 Wooded Brush Aly Saint Cloud, FL | 5.0 | 3.0 | 2603 | $2,600 | $1.00 | 0d | 1 | 0.42mi |
| 6090 Windy Leaf Aly Saint Cloud, FL | 5.0 | 3.0 | 2603 | $2,475 | $0.95 | 0d | 1 | 0.49mi |
| 6090 Windy Leaf Aly Saint Cloud, FL | 5.0 | 3.0 | 2603 | $2,475 | $0.95 | 9d | 1 | 0.49mi |
| 1679 Bay Breeze Dr Saint Cloud, FL | 4.0 | 2.0 | 1856 | $2,195 | $1.18 | 4d | 1 | 0.91mi |
| 5684 Western Sun Dr Saint Cloud, FL | 3.0 | 2.0 | 1678 | $2,500 | $1.49 | 25d | 1 | 0.98mi |
| 5574 Bakewell Pl Saint Cloud, FL | 4.0 | 2.0 | 1957 | $2,350 | $1.20 | 23d | 1 | 1.09mi |
| 5642 Western Sun Dr Saint Cloud, FL | 3.0 | 2.0 | 1672 | $1,995 | $1.19 | 4d | 1 | 1.19mi |
| 6254 Alligator Lake Shr E Saint Cloud, FL | 3.0 | 2.0 | 2145 | $2,500 | $1.17 | 25d | 1 | 1.29mi |
| 5476 Angel Way Saint Cloud, FL | 1.0–3.0 | 1.0–2.0 | 984 | $2,136 | $2.17 | 0d | 34 | 1.46mi |
HOA detail
- Monthly dues
- $70 · $840/yr
Listing history 4 events
-
2026-05-18status Pending
-
2026-04-16price $397,990
-
2026-04-03$387,990 Active
-
2025-07-08soldstatus $1,837,700
ⓘ Source: listings_history table (triggers on properties + properties_extension) + one-shot
backfill from property_details.listing_events for pre-trigger history.
Tax reassessment forecast FL · Resets to sale price
- Current annual tax
- $3,262 · $272/mo
- Projected year-2 tax
- $3,303 · $275/mo
- Expected delta
- +$41/yr (+$3/mo · 1.3%)
ⓘ Screening estimate from a state-policy table — verify with the county assessor before closing.
Climate risk First Street
- Flood 1/10 Low FEMA zone X (unshaded) · 0% chance over 30 yrs
- Wildfire 6/10 Major
- Heat 8/10 Severe 7 d/yr ≥108°F today · 22 d/yr by 30 yrs out
- Wind 10/10 Extreme 99% chance of damaging wind over 30 yrs
- Air quality 2/10 Low 1 unhealthy d/yr today · 1 by 30 yrs out
Nearby sold comps map
Loading sold comps map…
Walkable amenities ~0.75 mi
Loading nearby amenities…
Taxation est. · year 1
- Rental income
- $32,780
- − Mortgage interest
- −$22,294
- − Property taxes
- −$3,262
- − Insurance
- −$1,990
- − Repairs & maintenance
- −$2,622
- − Management
- −$2,622
- − HOA
- −$840
- − Depreciation
- −$11,578
- Taxable loss
- −$12,428
- Est. tax savings @ 24.0%
- +$2,983
- After-tax cash flow
- $-2,258/yr
For passive investors: Depreciation is non-cash, so a rental often shows a tax loss while cash-flowing — sheltering income. Rental losses are passive: they offset passive income freely, and up to $25,000/yr can offset ordinary (W-2) income if you actively participate and your MAGI is under $100k (phasing out to $0 by $150k); unused losses carry forward. On sale, claimed depreciation is recaptured at up to 25%, and gains may owe capital-gains tax (a 1031 exchange can defer both). Figures are a year-1 estimate at your 24.0% rate — not tax advice; consult a CPA.
Schools (NCES district)
- District
- Osceola
- NCES district ID
- 1201470
- Math proficiency
- 39% ▼ -9.00%
- Reading proficiency
- 45% ▼ -4.00%
- Median HH income
- $45,528
- Composite
- 35.7/100
- National rank
- #4865
- State rank
- #60 of 73 in FL
Livability — St. Cloud
No livability data for this city. (Only ~50 U.S. cities are tracked.)
Census & demographics
- County
- Osceola County · 410,217 people
- City population
- 29,247
- Metro
- Orlando-Kissimmee-Sanford, FL
- Population (ZIP)
- 35,257
- Household income
- $97,415
- Rent vs Own
- Severe rent burden
- 338.0
Population outlook (Osceola County) Hauer SSP2
- Today (2025)
- 447,624 people
- By 2030
- 511,823 · +14.3%
- By 2040
- 642,986 · +43.6%
- By 2050
- 774,552 · +73.0%
- By 2075
- 1,078,144 · +140.9%
- By 2100
- 1,269,660 · +183.6%
Race, ethnicity, and origin ACS 2023
- Neighborhood character
- Diverse neighborhood (Simpson 0.62)
- Race & ethnicity
- White 45% Hispanic / Latino 41% Two or more races 20% Black 9% Asian 2%
- Hispanic origin (detail)
- Mexican 3% Puerto Rican 26% Cuban 2% Dominican 4%
- Common ancestry
- Slovak 2% Romanian 2% Lithuanian 1%
- Foreign-born
- 14% · Canada, Jamaica
- Languages at home
- 64% English-only · Spanish 33% Other Indo-European 3%
Political lean MEDSL · Osceola
- 2024 margin
- Toss-up / Even · D 48.7% · R 50.2% · Other 1.1%
- 2008→2024 swing
- -21.2pp toward R · 2008: 19.7pp · 2024: -1.4pp
- All cycles
- 2024: R+1.4 2020: D+13.8 2016: D+25.0 2012: D+24.5 2008: D+19.7
Not yet ingested
- Civics
- —
Market trends
- HPI YoY
- ▼ -124.44%
- Current HPI
- 290.3095
- Rent YoY
- ▲ 3.02%
- Metro
- Orlando-Kissimmee-Sanford, FL
- State GDP YoY
- ▲ 3.28%
- F500 in state
- 36
Industry mix (Fortune 500 HQ in FL)
| Industry | F500 HQs | Revenue |
|---|---|---|
| Industrial Technology | 2 | $29B |
|
||
| Insurance | 2 | $17B |
|
||
| Retail | 1 | $60B |
|
||
| Technology Distribution | 1 | $58B |
|
||
| Homebuilding | 1 | $35B |
|
||
| Technology Manufacturing | 1 | $35B |
|
||
Price history
-78.3% since first listed4 events — show timeline
- 2026-05-18 Pending — Stellar MLS as Distributed by MLS Grid
- 2026-04-16 Price Changed $397,990 Stellar MLS as Distributed by MLS Grid
- 2026-04-03 Listed $387,990 Stellar MLS as Distributed by MLS Grid
- 2025-07-08 Sold (Public Records) $1,837,700 Public Records
Property tax history
+8.8%/yrLatest (2025): $3,262 · +5.6% YoY. Source: county tax records.
Cash-flow waterfall
monthlySold comps — $/sqft
last 12 mo · ≤1 miLoading sold comps…