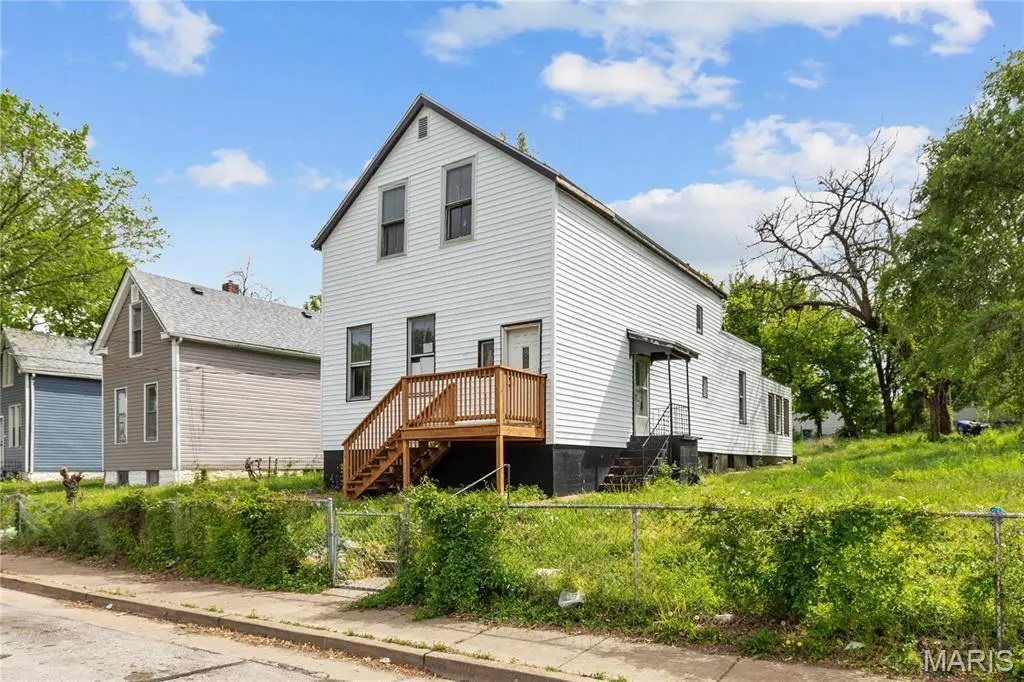
108 Horn Ave · Lemay, MO
Flood risk 1/10 · Minimal
- FEMA flood zone
- X (unshaded)
- Chance of flooding over 30 yrs
- 0.0%
- Est. flood insurance / yr
- $473 – $860
Fire risk 1/10 · Minimal
- Est. fire insurance / yr
- $1,054 – $1,958
Heat risk 5/10 · Moderate
- Hot days now (above 108°F)
- 7 days/yr
- Hot days in 30 yrs
- 21 days/yr
Wind risk 2/10 · Minimal
- Chance of severe wind over 30 yrs
- 1.0%
Air-quality risk 3/10 · Minor
- Unhealthy air days now
- 2 days/yr
- Unhealthy air days in 30 yrs
- 3 days/yr
Risk factors via First Street. Map © Google.
Why this score? — see what drove the B- grade
The composite is a weighted blend of 9 inputs, each scored 0–100. Each bar is that input's sub-score; the figure is the points it added to the 100-point composite (weight × sub-score).
- Cash flow +30.0/30.0
- 1% rule +10.0/10.0
- DSCR +10.0/10.0
- ARV discount +7.5/15.0
- Livability +3.4/5.0
- Schools +2.7/10.0
- Rent growth +2.5/5.0
- Condition / age +2.5/5.0
- Appreciation +0.0/10.0
$40,000
🖨 Deal sheet (PDF) 📄 Offer letter ✓ Due diligence
Listing remarks
Investor special! Being sold as-is. Large 2 story home, with large lot. This is a fixer upper and being sold in it's present condition. Newer roof and siding. No utilities on.
Key facts
- Newer roof
- Large lot
- Newer siding
Tags
Property features AI
Finance
- Other: No other applicable amenities provided
- Financial info: No additional financial details provided
- HOA & community: No HOA details provided
Exterior
- Parking: Off-street parking
- Security: No security details provided
- Utilities: Public water; Public sewer; Electric service by Ameren; Electricity available
- Home design: Single-family residence; Two levels
- Construction: Vinyl siding
- Exterior features: City lot
Interior
- Kitchen: No kitchen appliance details provided
- Bedrooms: 2 bedrooms (both on upper level)
- Flooring: No flooring details provided
- Bathrooms: 2 full bathrooms (one on main level, one on upper level)
- Heating & cooling: Other heating; Other cooling
- Interior features: Gas water heater; Full unfinished basement; Two decorative fireplaces
- Laundry & utility: No laundry details provided
Neighborhood map
What this means for you Summary
Snapshot
- This is a 2-bed/1.5-bath single-family listed at $40k.
Deal economics
- At list price, monthly cash flow is $973 ($12k/yr) — positive.
- The deal already cash-flows at list — no discount required.
- Meets the 1% rule at list price ($2k rent vs $40k).
- Cap rate 35.5% vs local median 5.2% in Lemay — top-decile yield for the area; either an underpriced asset or a hidden risk that comps aren't pricing in. Stress-test before assuming the spread holds.
Location & tenants
- Location reads 67/100 on livability (#213 in MO) — a middle-class / working-renter tenant base. Strengths: cost of living A+, housing A+; Watch: employment C-, health & safety C-, crime F.
- Hancock Place (suburban): math 30% / reading 34% proficiency, ranked #251 of 324 in MO (top 78%) — families likely to look elsewhere, expect single-tenant / working-renter base with shorter leases.
- Zoned schools: Hancock Place Elem. (math 34% / reading 34%, grade F, #739 of 1,115 statewide, top 67%, 616 students, 74% FRL); Hancock Sr. High (math 22% / reading 47%, grade F, #321 of 521 statewide, top 67%, 389 students, 91% FRL) — zoned schools average 83% FRL vs 57% district-wide (26 pts higher); higher-poverty schools than district average — tighter screening recommended.
- Market conditions: 148 active listings in the ZIP; 13 comparable units currently listed for rent nearby; rentals at typical pace (median 16d on market — plan ~3-4 weeks tenant-placement turnaround); 920 units permitted in St. Louis County in 2024 (250 in 5+ unit buildings).
- This rent runs 31% of the median local income ($62k/yr) — at the standard rent-burdened threshold; future hikes will face affordability resistance.
Forward outlook
- Local home prices are declining (-3.0%/yr); year-one equity from $277 of loan paydown is wiped out by about $1k of value loss. Plan a longer hold.
- At projected returns (-3.0% appreciation + 3.0% rent growth), your $11k cash investment doubles in ~2 years — after that, you're playing with house money.
Negotiation context
- Only 1 days on market — expect competitive offers; lowballing is unlikely to land.
- 6 sale attempts since 4y ago with the ask held roughly flat each time — persistent listings suggest the price (not the market) is what's stuck; bring a comps-based counter.
Risks & watch-outs
- Watch-outs: built in 1895 — expect roof / HVAC / electrical / plumbing capex.
- Climate carrying-cost: extreme-heat days projected 7→21/yr by 2055 (HVAC capex compounding) — expect insurance premiums to compound above CPI over the hold.
Questions for the listing agent
- Built in 1895 — when were the roof, HVAC, electrical panel, plumbing, and water heater last replaced?
- Is there a deadline driving the sale (1031 exchange, divorce, estate, relocation)? That informs how much negotiation room exists.
- Schools are D-rated, which usually means shorter tenancies and higher turnover. Who's the typical renter profile here, and what's been the actual vacancy rate?
- Crime grade is F in this area — have there been break-ins, vandalism, or insurance claims at this property in the last 3 years? What carrier currently insures it and at what premium?
- What's the average days-on-market for RENTAL listings here right now (not sales)? A rising rental-DOM trend means longer vacancies and softer asking-rent achievability than the comps imply.
- What's the recent tenant-quality profile in this submarket — average credit score on applications, eviction rate, late-payment / NSF rate, and stable-employment percentage? A property-management company in the area should have these aggregated.
- How much new for-sale + rental construction is in the pipeline within 1–3 miles? Heavy new supply typically softens prices + rents 12–24 months out; constrained supply supports both.
Investment metrics
- 1% rule
- 3.95% ✓
- Cap rate
- 35.49%
- Cash-on-cash
- 104.27%
- DSCR
- 5.64
- GRM
- 2.1
CMA / ARV
- ARV (on-the-fly)
- $205,202
- Comps found
- 12
Show comp detail 12 sales within ~0.75 mi
| Address | Dist | Beds/Ba | Sqft | Sold | Price | $/sf | Match |
|---|---|---|---|---|---|---|---|
| 108 Horn Ave | 0.00mi | 2/2.0 | 1,739 (0%) | 1mo | $40,000 | $23 | 98 |
| 437 Hoffmeister Ave | 0.38mi | 3/2.0 (+1) | 1,735 (-0%) | 6mo | $245,000 | $141 | 70 |
| 312 Waller Ave | 0.31mi | 3/1.0 (+1) | 1,700 (-2%) | 9mo | $199,999 | $118 | 68 |
| 329 Goetz Ave | 0.29mi | 3/1.0 (+1) | 1,497 (-14%) | 2mo | $35,000 | $23 | 54 |
| 212 Espenschied St | 0.54mi | 3/1.5 (+1) | 1,562 (-10%) | 5mo | $119,900 | $77 | 49 |
| 9533 Gentry Ave | 0.45mi | 3/1.0 (+1) | 1,491 (-14%) | 2mo | $165,000 | $111 | 46 |
| 720 Erskine Ave | 0.40mi | 1/1.0 (-1) | 1,504 (-14%) | 8mo | $49,900 | $33 | 45 |
| 631 Waller Ave | 0.47mi | 3/1.5 (+1) | 1,514 (-13%) | 11mo | $179,900 | $119 | 42 |
| 614 Horn Ave | 0.40mi | 3/2.5 (+1) | 1,488 (-14%) | 10mo | $200,000 | $134 | 40 |
| 600 Horn Ave | 0.36mi | 3/2.0 (+1) | 1,480 (-15%) | 14mo | $239,900 | $162 | 40 |
| 522 Hurck St | 0.71mi | 2/1.0 | 1,916 (+10%) | 13mo | $179,000 | $93 | 38 |
| 416 W Holden Ave | 0.72mi | 3/2.5 (+1) | 1,664 (-4%) | 17mo | $232,500 | $140 | 36 |
Match score weights: distance 35% · size 25% · config 20% · recency 20%. Top-matched comps best support the ARV.
Projected returns pro-forma
-3.0% appreciation · 3.0% rent growth · sell at horizon
- IRR
- —
- Equity multiple
- 5.96×
- Total profit
- $55,523
- Equity at exit
- $5,964
- IRR
- —
- Equity multiple
- 12.45×
- Total profit
- $128,255
- Equity at exit
- $3,458
Cash invested: $11,200 (down + closing). Projections, not guarantees.
Landlord ↔ Tenant lean methodology
- Overall (STATE)
- 81 Strongly Landlord-Friendly
- State Missouri
- 81 Strongly Landlord-Friendly · R+10
- County
- — inherits STATE
- City
- — inherits STATE
ZIP-level market 63125
- Active inventory
- 148
- Price-to-rent
- 2.1×
Monthly cashflow live
- Estimated rent
- $1,582 high interval (Pro) →
- Mortgage (P&I)
- −$210
- Tax est. 1.5%
- −$50 /mo · $600/yr
- Insurance
- −$17
- HOA
- −$0
- Vacancy / Maint / Mgmt
- −$332
- Net cashflow
- $973
Break-even live
Sensitivity live
| Price | -10% $1,001 | -5% $987 | +0% $973 | +5% $959 | +10% $946 |
|---|---|---|---|---|---|
| Rent | -10% $848 | -5% $911 | +0% $973 | +5% $1,036 | +10% $1,098 |
| Rate | -1.0pp $993 | -0.5pp $983 | base $973 | +0.5pp $963 | +1.0pp $952 |
UW: 25.0% down · 7.5% · 30yr · 1.5% tax · 5.0% vac · 8.0% maint · 8.0% mgmt
Financing live
Cash to close
- Down payment
- $10,000
- Closing costs
- $1,200
- Reserves months
- —
- Total cash needed
- —
Loan-product check · same deal, 3 products live
Conventional
25% down · 7.5% · 30yr
- Down + closing
- —
- Monthly P&I
- —
- Monthly cashflow
- —
- DSCR
- —
- Eligible?
- —
Personal DTI + credit; lowest rate.
DSCR
20% down · 8.5% · 30yr
- Down + closing
- —
- Monthly P&I
- —
- Monthly cashflow
- —
- DSCR
- —
- Eligible?
- —
No personal income docs; deal must DSCR.
Hard money
10% down · 12.0% · 12mo
- Down + closing
- —
- Monthly P&I
- —
- Monthly cashflow
- —
- DSCR
- —
- Eligible?
- —
Short-term bridge; refi at stabilization.
Rent comps 13 comps
| Address | Beds | Baths | Sqft | Rent | $/sqft | DOM | Units | Dist |
|---|---|---|---|---|---|---|---|---|
| 229 Horn Ave Saint Louis, MO | 2.0 | 1.5 | 1301 | $1,871 | $1.44 | 2d | 1 | 0.14mi |
| 304 Bayless Ave Saint Louis, MO | 3.0 | 1.0 | 1104 | $1,950 | $1.77 | 2d | 1 | 0.21mi |
| 336 Lagro Ave Saint Louis, MO | 2.0 | 2.0 | 1340 | $1,250 | $0.93 | 44d | 1 | 0.24mi |
| 349 Lagro Ave Saint Louis, MO | 3.0 | 1.0 | 1184 | $1,500 | $1.27 | 44d | 1 | 0.28mi |
| 8215 Pennsylvania Ave Saint Louis, MO | 1.0 | 2.0 | 1252 | $1,650 | $1.32 | 18d | 1 | 0.70mi |
| 9809 S Broadway Saint Louis, MO | 1.0 | 1.0 | 1288 | $1,450 | $1.13 | 45d | 1 | 0.72mi |
| 7924 Michigan Ave Unit 2F St. Louis, MO | 3.0 | 2.0 | 1250 | $1,195 | $0.96 | 4d | 1 | 0.88mi |
| 9954 Meadow Ave Saint Louis, MO | 2.0 | 1.0 | 1100 | $1,050 | $0.95 | 5d | 1 | 1.04mi |
| 9963 Meadow Ave Saint Louis, MO | 3.0 | 2.0 | 1628 | $1,701 | $1.04 | 44d | 1 | 1.08mi |
| 7417 Vermont Ave Unit 103 St. Louis, MO | 2.0 | 2.0 | 1069 | $1,500 | $1.40 | 15d | 1 | 1.25mi |
| 7417 Vermont Ave St. Louis, MO | 1.0–2.0 | 1.0–2.0 | 1144 | $1,600 | $1.40 | 2d | 8 | 1.25mi |
| 3945 Crosby Dr Saint Louis, MO | 2.0 | 1.0 | 1100 | $2,083 | $1.89 | 2d | 1 | 1.35mi |
| 7024 Pennsylvania Ave Unit F St. Louis, MO | 2.0 | 1.0 | 1081 | $930 | $0.86 | 17d | 1 | 1.48mi |
Listing history 24 events
-
2026-05-21status Pending
-
2026-05-21$40,000 Active
-
2025-06-10$80,000 Active
-
2025-05-16price $80,000
-
2025-04-16price $85,000
-
2025-02-17price $100,000
-
2024-12-09price $110,000
-
2024-12-05$125,000 Active
-
2023-09-22historical
-
2023-09-15price $65,000
-
2023-09-04price $75,000
-
2023-08-22status Active
-
2023-08-04status Pending
-
2023-07-20price $80,000
-
2023-06-29price $85,000
-
2023-05-31price $90,000
-
2023-05-18$95,000 Active
-
2023-04-26historical
-
2023-04-04price $95,000
-
2022-11-18$100,000 Active
-
1997-06-20soldstatus $45,000
-
1994-10-24soldstatus
-
1994-10-24soldstatus
-
1994-10-24soldstatus
ⓘ Source: listings_history table (triggers on properties + properties_extension) + one-shot
backfill from property_details.listing_events for pre-trigger history.
Climate risk First Street
- Flood 1/10 Low FEMA zone X (unshaded) · 0% chance over 30 yrs
- Wildfire 1/10 Low
- Heat 5/10 Major 7 d/yr ≥108°F today · 21 d/yr by 30 yrs out
- Wind 2/10 Low 100% chance of damaging wind over 30 yrs
- Air quality 3/10 Moderate 2 unhealthy d/yr today · 3 by 30 yrs out
Nearby sold comps map
Loading sold comps map…
Walkable amenities ~0.75 mi
Loading nearby amenities…
Taxation est. · year 1
- Rental income
- $18,981
- − Mortgage interest
- −$2,241
- − Property taxes
- −$600
- − Insurance
- −$200
- − Repairs & maintenance
- −$1,518
- − Management
- −$1,518
- − Depreciation
- −$1,164
- Taxable income
- $11,740
- Est. tax owed @ 24.0%
- −$2,818
- After-tax cash flow
- $8,860/yr
For passive investors: Depreciation is non-cash, so a rental often shows a tax loss while cash-flowing — sheltering income. Rental losses are passive: they offset passive income freely, and up to $25,000/yr can offset ordinary (W-2) income if you actively participate and your MAGI is under $100k (phasing out to $0 by $150k); unused losses carry forward. On sale, claimed depreciation is recaptured at up to 25%, and gains may owe capital-gains tax (a 1031 exchange can defer both). Figures are a year-1 estimate at your 24.0% rate — not tax advice; consult a CPA.
Schools (NCES district)
- District
- Hancock Place
- NCES district ID
- 2913620
- Math proficiency
- 30% ▼ -16.00%
- Reading proficiency
- 34% ▼ -11.00%
- Median HH income
- $41,890
- Composite
- 27.08/100
- National rank
- #7048
- State rank
- #251 of 324 in MO
Livability — Lemay
- Score
- 67/100
- State rank
- #213
- US rank
- #10652
Category grades
Schools grade is shown separately in the Schools card above.
Census & demographics
- Census place
- Lemay, MO
- County
- Saint Louis County · 888,823 people
- City population
- 33,294
- Metro
- St. Louis, MO-IL
- Population (ZIP)
- 33,294
- Household income
- $61,624
- Rent vs Own
- Severe rent burden
- 631.0
Population outlook (St. Louis County) Hauer SSP2
- Today (2025)
- 1,025,227 people
- By 2030
- 1,028,023 · +0.3%
- By 2040
- 1,020,940 · -0.4%
- By 2050
- 1,007,280 · -1.8%
- By 2075
- 987,277 · -3.7%
- By 2100
- 921,984 · -10.1%
Race, ethnicity, and origin ACS 2023
- Neighborhood character
- Predominantly White (86%)
- Race & ethnicity
- White 86% Two or more races 5% Black 4% Hispanic / Latino 4% Asian 2%
- Common ancestry
- American 9% Romanian 3% Lithuanian 3%
- Foreign-born
- 14% · Canada, Vietnam
- Languages at home
- 83% English-only · Russian/Polish/Slavic 11% Spanish 3% Vietnamese 1%
Political lean MEDSL · St. Louis
- 2024 margin
- Strong D (+23.4) · D 60.8% · R 37.4% · Other 1.7%
- 2008→2024 swing
- +3.5pp toward D · 2008: 19.9pp · 2024: 23.4pp
- All cycles
- 2024: D+23.4 2020: D+24.0 2016: D+16.2 2012: D+13.7 2008: D+19.9
Not yet ingested
- Civics
- —
Market trends
- HPI YoY
- ▼ -173.27%
- Current HPI
- 234.3792
- Rent YoY
- —
- Metro
- St. Louis, MO-IL
- State GDP YoY
- ▲ 1.84%
- F500 in state
- 20
Industry mix (Fortune 500 HQ in MO)
| Industry | F500 HQs | Revenue |
|---|---|---|
| Healthcare | 1 | $163B |
|
||
| Insurance | 1 | $21B |
|
||
| Industrial Technology | 1 | $17B |
|
||
| Retail | 1 | $16B |
|
||
| Industrial Distribution | 1 | $10B |
|
||
| Utilities | 1 | $9B |
|
||
Price history
-11.1% since first listed24 events — show timeline
- 2026-05-21 Pending — MARIS as Distributed by MLS Grid
- 2026-05-21 Listed $40,000 MARIS as Distributed by MLS Grid
- 2025-06-10 Listed $80,000 MARIS as Distributed by MLS Grid
- 2025-05-16 Price Changed $80,000 MARIS as Distributed by MLS Grid
- 2025-04-16 Price Changed $85,000 MARIS as Distributed by MLS Grid
- 2025-02-17 Price Changed $100,000 MARIS as Distributed by MLS Grid
- 2024-12-09 Price Changed $110,000 MARIS as Distributed by MLS Grid
- 2024-12-05 Listed $125,000 MARIS as Distributed by MLS Grid
- 2023-09-22 Delisted — MARIS as Distributed by MLS Grid
- 2023-09-15 Price Changed $65,000 MARIS as Distributed by MLS Grid
- 2023-09-04 Price Changed $75,000 MARIS as Distributed by MLS Grid
- 2023-08-22 Relisted — MARIS as Distributed by MLS Grid
- 2023-08-04 Pending — MARIS as Distributed by MLS Grid
- 2023-07-20 Price Changed $80,000 MARIS as Distributed by MLS Grid
- 2023-06-29 Price Changed $85,000 MARIS as Distributed by MLS Grid
- 2023-05-31 Price Changed $90,000 MARIS as Distributed by MLS Grid
- 2023-05-18 Listed $95,000 MARIS as Distributed by MLS Grid
- 2023-04-26 Delisted — MARIS as Distributed by MLS Grid
- 2023-04-04 Price Changed $95,000 MARIS as Distributed by MLS Grid
- 2022-11-18 Listed $100,000 MARIS as Distributed by MLS Grid
- 1997-06-20 Sold (Public Records) $45,000 Public Records
- 1994-10-24 Sold (Public Records) — Public Records
- 1994-10-24 Sold (Public Records) — Public Records
- 1994-10-24 Sold (Public Records) — Public Records
Property tax history
+5.7%/yrLatest (2022): $2,035 · +1.8% YoY. Source: county tax records.
Cash-flow waterfall
monthlySold comps — $/sqft
last 12 mo · ≤1 miLoading sold comps…