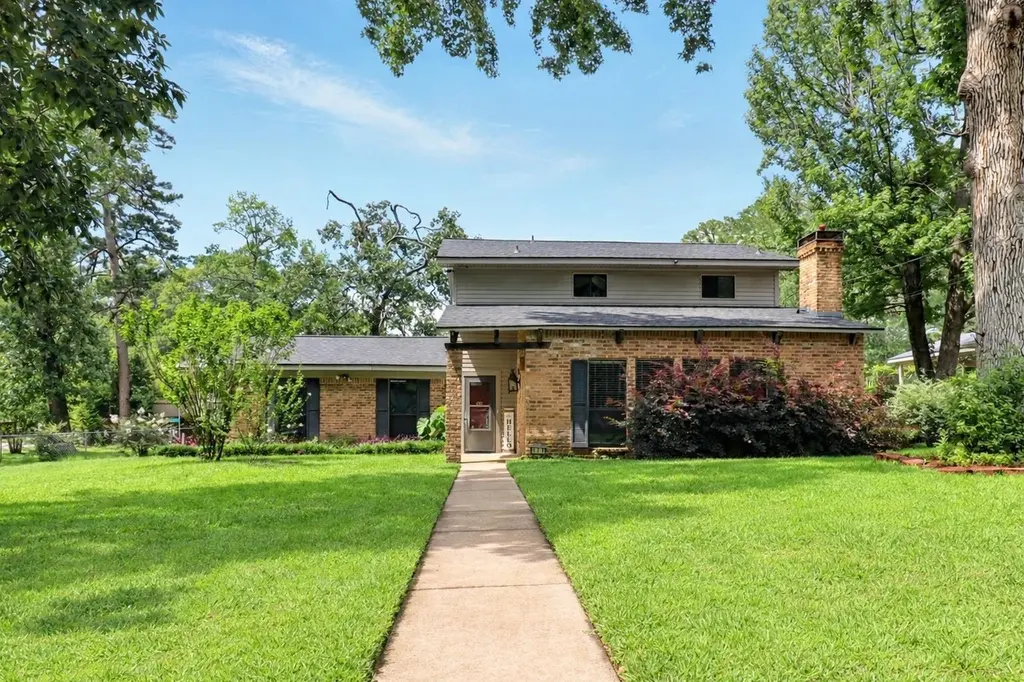
111 Bison Trl · Longview, TX
Flood risk 1/10 · Minimal
- FEMA flood zone
- X (unshaded)
- Chance of flooding over 30 yrs
- 0.0%
- Est. flood insurance / yr
- $507 – $1,088
Fire risk 4/10 · Minor
- Est. fire insurance / yr
- $1,222 – $2,270
Heat risk 7/10 · Major
- Hot days now (above 111°F)
- 7 days/yr
- Hot days in 30 yrs
- 23 days/yr
Wind risk 6/10 · Moderate
- Chance of severe wind over 30 yrs
- 57.0%
Air-quality risk 2/10 · Minimal
- Unhealthy air days now
- 1 days/yr
- Unhealthy air days in 30 yrs
- 1 days/yr
Risk factors via First Street. Map © Google.
Why this score? — see what drove the D grade
The composite is a weighted blend of 9 inputs, each scored 0–100. Each bar is that input's sub-score; the figure is the points it added to the 100-point composite (weight × sub-score).
- ARV discount +15.0/15.0
- Cash flow +9.5/30.0
- Livability +3.7/5.0
- Schools +3.1/10.0
- Rent growth +2.9/5.0
- DSCR +2.7/10.0
- Condition / age +2.5/5.0
- 1% rule +2.4/10.0
- Appreciation +0.0/10.0
$285,000
🖨 Deal sheet (PDF) 📄 Offer letter ✓ Due diligence
Listing remarks
Welcome to 111 Bison Trail in Hallsville ISD! Positioned on a picturesque corner lot in the sought-after Heights Park Addition - just moments from the new West Elementary—this two-story brick home offers the space, flexibility, and features buyers are actively searching for in Hallsville ISD. The curb appeal sets the tone with lush green grass, mature shade trees, and a fully fenced backyard designed for both everyday living and weekend enjoyment. A convenient side gate and extended space allow for boat or RV parking - an increasingly rare find in this price range. Inside, the layout delivers versatility and function. Upstairs features 3 spacious bedrooms and 2 full baths, while the
Key facts
- Third full bathroom
- Boat or rv parking
- Soaring ceiling
Tags
Property features AI
Exterior
- Parking: 2-car garage with side-facing garage
- Utilities: Private water source; Public sewer; Natural gas available
- Home design: Single-family residence; Two stories
- Construction: Brick, aluminum siding, and vinyl siding exterior; Composition roof; Slab foundation; Built on a 0.42-acre lot
- Exterior features: Landscaped yard; Chain link and wood fencing; Storage structure on property; Asphalt road access; Spa / hot tub
Interior
- Bathrooms: 3 full bathrooms
- Heating & cooling: Central heating (natural gas); Central air conditioning
- Interior features: Wood-burning fireplace; Gas water heater; 10 total rooms
Neighborhood map
What this means for you Summary
Snapshot
- This is a 4-bed/3.0-bath single-family listed at $285k.
Deal economics
- At list price, monthly cash flow is $-200 ($-2k/yr) — negative.
- To cash-flow at today's rent, offer at most $250k (12.4% below list).
- To meet the 1% rule (rent ≥ 1% of price), the offer needs to be $211k (26.0% below list).
- Recommended offer: $211k (26.0% below list) — sets the bar for 1% rule.
- Cap rate 5.5% vs local median 3.0% in Longview — top-decile yield for the area; either an underpriced asset or a hidden risk that comps aren't pricing in. Stress-test before assuming the spread holds.
Location & tenants
- Location reads 73/100 on livability (#213 in TX) — a middle-class / working-renter tenant base. Strengths: cost of living A+, housing A+, health & safety A+; Watch: employment C-, crime D+, amenities F.
- Hallsville ISD (town): math 30% / reading 40% proficiency, ranked #490 of 826 in TX (top 59%) — families likely to look elsewhere, expect single-tenant / working-renter base with shorter leases.
- Zoned schools: Hallsville H S (math 66% / reading 70%, grade B, #150 of 1,632 statewide, top 10%, 1,456 students, 40% FRL) — zoned schools at 40% FRL track the district average.
- Zoned-school proficiency averages 68% at this address vs 35% district-wide (+33 pts) — the actual schools serving this property are materially stronger than the Hallsville ISD average implies; a family-tenant draw the district grade alone would hide.
- Market conditions: Rents rising (+1.5%/yr); 314 active listings in the ZIP; 6 comparable units currently listed for rent nearby; rentals at typical pace (median 23d on market — plan ~3-4 weeks tenant-placement turnaround); 85 units permitted in Harrison County in 2024 (15 in 5+ unit buildings).
- This rent runs 35% of the median local income ($73k/yr) — at the standard rent-burdened threshold; future hikes will face affordability resistance.
Forward outlook
- Local home prices are declining (-3.0%/yr); year-one equity from $2k of loan paydown is wiped out by about $9k of value loss. Plan a longer hold.
Negotiation context
- It's been on market 54 days — a 3% lower offer ($276k) is reasonable based on typical stale-listing flexibility.
- 3 sale attempts with the ask held roughly flat each time — persistent listings suggest the price (not the market) is what's stuck; bring a comps-based counter.
Risks & watch-outs
- Climate carrying-cost: major wind risk, 57% chance of damaging wind over 30y; extreme-heat days projected 7→23/yr by 2055 (HVAC capex compounding) — expect insurance premiums to compound above CPI over the hold.
Questions for the listing agent
- What do current leases actually rent for vs. the listed asking? Can we see a recent rent roll and the last 12 months of T-12 income?
- It's been on market 54 days. Have you received any prior offers? Is the seller open to a 26% concession, seller financing, or rate buy-down credit?
- Built in 1977 — when were the roof, HVAC, electrical panel, plumbing, and water heater last replaced?
- Is there a deadline driving the sale (1031 exchange, divorce, estate, relocation)? That informs how much negotiation room exists.
- Schools are D-rated, which usually means shorter tenancies and higher turnover. Who's the typical renter profile here, and what's been the actual vacancy rate?
- Crime grade is D in this area — have there been break-ins, vandalism, or insurance claims at this property in the last 3 years? What carrier currently insures it and at what premium?
- The area grade is low — what's the realistic commute time and amenity access for the typical tenant pool here? Any planned neighborhood developments (good or bad) we should know about?
- What's the average days-on-market for RENTAL listings here right now (not sales)? A rising rental-DOM trend means longer vacancies and softer asking-rent achievability than the comps imply.
- What's the recent tenant-quality profile in this submarket — average credit score on applications, eviction rate, late-payment / NSF rate, and stable-employment percentage? A property-management company in the area should have these aggregated.
- How much new for-sale + rental construction is in the pipeline within 1–3 miles? Heavy new supply typically softens prices + rents 12–24 months out; constrained supply supports both.
Investment metrics
- 1% rule
- 0.74% ✗
- Cap rate
- 5.45%
- Cash-on-cash
- -3.00%
- DSCR
- 0.87
- GRM
- 11.3
CMA / ARV
- ARV (median comp)
- $397,032
- List price
- $285,000
- Delta
- -28.22%
- Verdict
- UNDERPRICED
- Comps
- 4 within 1.0 mi
Show comp detail 1 sale within ~0.75 mi
| Address | Dist | Beds/Ba | Sqft | Sold | Price | $/sf | Match |
|---|---|---|---|---|---|---|---|
| 134 Park Dr | 0.27mi | 3/2.0 (-1) | 1,812 (+7%) | 1mo | $249,900 | $138 | 66 |
Match score weights: distance 35% · size 25% · config 20% · recency 20%. Top-matched comps best support the ARV.
Projected returns pro-forma
-3.0% appreciation · 1.48% rent growth · sell at horizon
- IRR
- -22.9%
- Equity multiple
- 0.22×
- Total profit
- $-62,112
- Equity at exit
- $42,494
- IRR
- -21.6%
- Equity multiple
- -0.04×
- Total profit
- $-83,240
- Equity at exit
- $24,642
Cash invested: $79,800 (down + closing). Projections, not guarantees.
Landlord ↔ Tenant lean methodology
- Overall (STATE)
- 87 Strongly Landlord-Friendly
- State Texas
- 87 Strongly Landlord-Friendly · R+5
- County
- — inherits STATE
- City
- — inherits STATE
ZIP-level market 75605
- Rents YoY
- 1.5%
- Active inventory
- 314
- Price-to-rent
- 11.3×
Monthly cashflow live
- Estimated rent
- $2,109 high interval (Pro) →
- Mortgage (P&I)
- −$1,495
- Tax from tax record
- −$252 /mo · $3,026/yr
- Insurance
- −$119
- HOA
- −$0
- Vacancy / Maint / Mgmt
- −$443
- Net cashflow
- $-200
Break-even live
Sensitivity live
| Price | -10% $-38 | -5% $-119 | +0% $-200 | +5% $-280 | +10% $-361 |
|---|---|---|---|---|---|
| Rent | -10% $-366 | -5% $-283 | +0% $-200 | +5% $-116 | +10% $-33 |
| Rate | -1.0pp $-56 | -0.5pp $-127 | base $-200 | +0.5pp $-274 | +1.0pp $-349 |
UW: 25.0% down · 7.5% · 30yr · 1.5% tax · 5.0% vac · 8.0% maint · 8.0% mgmt
Financing live
Cash to close
- Down payment
- $71,250
- Closing costs
- $8,550
- Reserves months
- —
- Total cash needed
- —
Loan-product check · same deal, 3 products live
Conventional
25% down · 7.5% · 30yr
- Down + closing
- —
- Monthly P&I
- —
- Monthly cashflow
- —
- DSCR
- —
- Eligible?
- —
Personal DTI + credit; lowest rate.
DSCR
20% down · 8.5% · 30yr
- Down + closing
- —
- Monthly P&I
- —
- Monthly cashflow
- —
- DSCR
- —
- Eligible?
- —
No personal income docs; deal must DSCR.
Hard money
10% down · 12.0% · 12mo
- Down + closing
- —
- Monthly P&I
- —
- Monthly cashflow
- —
- DSCR
- —
- Eligible?
- —
Short-term bridge; refi at stabilization.
Rent comps 6 comps
| Address | Beds | Baths | Sqft | Rent | $/sqft | DOM | Units | Dist |
|---|---|---|---|---|---|---|---|---|
| 3109 Mesa Dr Longview, TX | 4.0 | 2.0 | 1582 | $2,400 | $1.52 | 15d | 1 | 0.29mi |
| 3100 Mesa Dr Longview, TX | 3.0 | 2.0 | 1234 | $2,250 | $1.82 | 45d | 1 | 0.29mi |
| 3105 Mesa Dr Longview, TX | 4.0 | 2.0 | 1550 | $2,600 | $1.68 | 23d | 1 | 0.29mi |
| 3401 E Marshall Ave Longview, TX | 1.0–3.0 | 1.0–2.0 | 1025 | $1,300 | $1.27 | 15d | 4 | 0.92mi |
| 3401 E Marshall Ave Longview, TX | 3.0 | 2.0 | 1300 | $1,300 | $1.00 | 23d | 1 | 0.92mi |
| 1609 Everwood Ct Longview, TX | 3.0 | 2.0 | 1505 | $2,495 | $1.66 | 15d | 1 | 1.28mi |
Listing history 23 events
-
2026-06-21days on market $285,000 Active 54 DOM
-
2026-06-19days on market $285,000 Active 52 DOM
-
2026-06-18days on market $285,000 Active 51 DOM
-
2026-06-17days on market $285,000 Active 50 DOM
-
2026-06-16days on market $285,000 Active 49 DOM
-
2026-06-15days on market $285,000 Active 48 DOM
-
2026-06-14days on market $285,000 Active 46 DOM
-
2026-06-13days on market $285,000 Active 45 DOM
-
2026-06-10days on market $285,000 Active 43 DOM
-
2026-06-09days on market $285,000 Active 42 DOM
-
2026-06-08days on market $285,000 Active 41 DOM
-
2026-06-07days on market $285,000 Active 40 DOM
-
2026-06-05days on market $285,000 Active 37 DOM
-
2026-06-02days on market $285,000 Active 35 DOM
-
2026-06-01days on market $285,000 Active 34 DOM
-
2026-05-31days on market $285,000 Active 33 DOM
-
2026-05-30days on market $285,000 Active 32 DOM
-
2026-04-28$285,000 Active 1918-char remark
-
2026-03-02$289,999 Active
-
2026-03-02price $289,999
-
2025-09-15price $297,000
-
2025-07-22$309,900 Active
-
1998-09-11soldstatus
ⓘ Source: listings_history table (triggers on properties + properties_extension) + one-shot
backfill from property_details.listing_events for pre-trigger history.
Tax reassessment forecast TX · Resets to sale price
- Current annual tax
- $3,026 · $252/mo
- Projected year-2 tax
- $5,216 · $435/mo
- Expected delta
- +$2,190/yr (+$182/mo · 72.4%)
ⓘ Screening estimate from a state-policy table — verify with the county assessor before closing.
Climate risk First Street
- Flood 1/10 Low FEMA zone X (unshaded) · 0% chance over 30 yrs
- Wildfire 4/10 Moderate
- Heat 7/10 Severe 7 d/yr ≥111°F today · 23 d/yr by 30 yrs out
- Wind 6/10 Major 57% chance of damaging wind over 30 yrs
- Air quality 2/10 Low 1 unhealthy d/yr today · 1 by 30 yrs out
Nearby sold comps map
Loading sold comps map…
Walkable amenities ~0.75 mi
Loading nearby amenities…
Taxation est. · year 1
- Rental income
- $25,302
- − Mortgage interest
- −$15,964
- − Property taxes
- −$3,026
- − Insurance
- −$1,425
- − Repairs & maintenance
- −$2,024
- − Management
- −$2,024
- − Depreciation
- −$8,291
- Taxable loss
- −$7,452
- Est. tax savings @ 24.0%
- +$1,788
- After-tax cash flow
- $-608/yr
For passive investors: Depreciation is non-cash, so a rental often shows a tax loss while cash-flowing — sheltering income. Rental losses are passive: they offset passive income freely, and up to $25,000/yr can offset ordinary (W-2) income if you actively participate and your MAGI is under $100k (phasing out to $0 by $150k); unused losses carry forward. On sale, claimed depreciation is recaptured at up to 25%, and gains may owe capital-gains tax (a 1031 exchange can defer both). Figures are a year-1 estimate at your 24.0% rate — not tax advice; consult a CPA.
Schools (NCES district)
- District
- Hallsville ISD
- NCES district ID
- 4822170
- Math proficiency
- 30% ▼ -2.00%
- Reading proficiency
- 40% ▲ 2.00%
- Median HH income
- $57,770
- Composite
- 31.05/100
- National rank
- #6081
- State rank
- #490 of 826 in TX
Livability — Longview
- Score
- 73/100
- State rank
- #213
- US rank
- #5287
Category grades
Schools grade is shown separately in the Schools card above.
Census & demographics
- Census place
- Longview, TX
- County
- Gregg County · 128,826 people
- City population
- 103,792
- Metro
- Longview, TX
- Population (ZIP)
- 35,417
- Household income
- $73,190
- Rent vs Own
- Severe rent burden
- 1465.0
Population outlook (Harrison County) Hauer SSP2
- Today (2025)
- 68,691 people
- By 2030
- 69,317 · +0.9%
- By 2040
- 69,973 · +1.9%
- By 2050
- 70,090 · +2.0%
- By 2075
- 70,607 · +2.8%
- By 2100
- 67,546 · -1.7%
Race, ethnicity, and origin ACS 2023
- Neighborhood character
- Predominantly White (72%)
- Race & ethnicity
- White 72% Black 15% Hispanic / Latino 7% Two or more races 7% Asian 2%
- Hispanic origin (detail)
- Mexican 6%
- Common ancestry
- Italian 2% Slovak 2% Lithuanian 2%
- Foreign-born
- 5% · Canada
- Languages at home
- 92% English-only · Spanish 5% Other Indo-European 1% Vietnamese 1%
Political lean MEDSL · Harrison
- 2024 margin
- Solid R (+50.6) · D 24.4% · R 75.0%
- 2008→2024 swing
- -19.2pp toward R · 2008: -31.4pp · 2024: -50.6pp
- All cycles
- 2024: R+50.6 2020: R+45.6 2016: R+43.9 2012: R+34.6 2008: R+31.4
Not yet ingested
- Civics
- —
Market trends
- HPI YoY
- ▼ -199.48%
- Current HPI
- 227.957
- Rent YoY
- ▲ 1.48%
- Metro
- Longview, TX
- State GDP YoY
- ▲ 3.95%
- F500 in state
- 110
Industry mix (Fortune 500 HQ in TX)
| Industry | F500 HQs | Revenue |
|---|---|---|
| Energy | 16 | $1,198B |
|
||
| Technology | 5 | $198B |
|
||
| Engineering / Construction | 4 | $72B |
|
||
| Energy Services | 3 | $60B |
|
||
| Utilities | 3 | $41B |
|
||
| Healthcare | 2 | $330B |
|
||
Price history
-8.0% since first listed6 events — show timeline
- 2026-04-28 Listed $285,000 LAAR
- 2026-03-02 Listed $289,999 GTAR
- 2026-03-02 Price Changed $289,999 LAAR
- 2025-09-15 Price Changed $297,000 LAAR
- 2025-07-22 Listed $309,900 LAAR
- 1998-09-11 Sold (Public Records) — Public Records
Property tax history
+1.1%/yrLatest (2025): $3,026 · +9.1% YoY. Source: county tax records.
Cash-flow waterfall
monthlySold comps — $/sqft
last 12 mo · ≤1 miLoading sold comps…