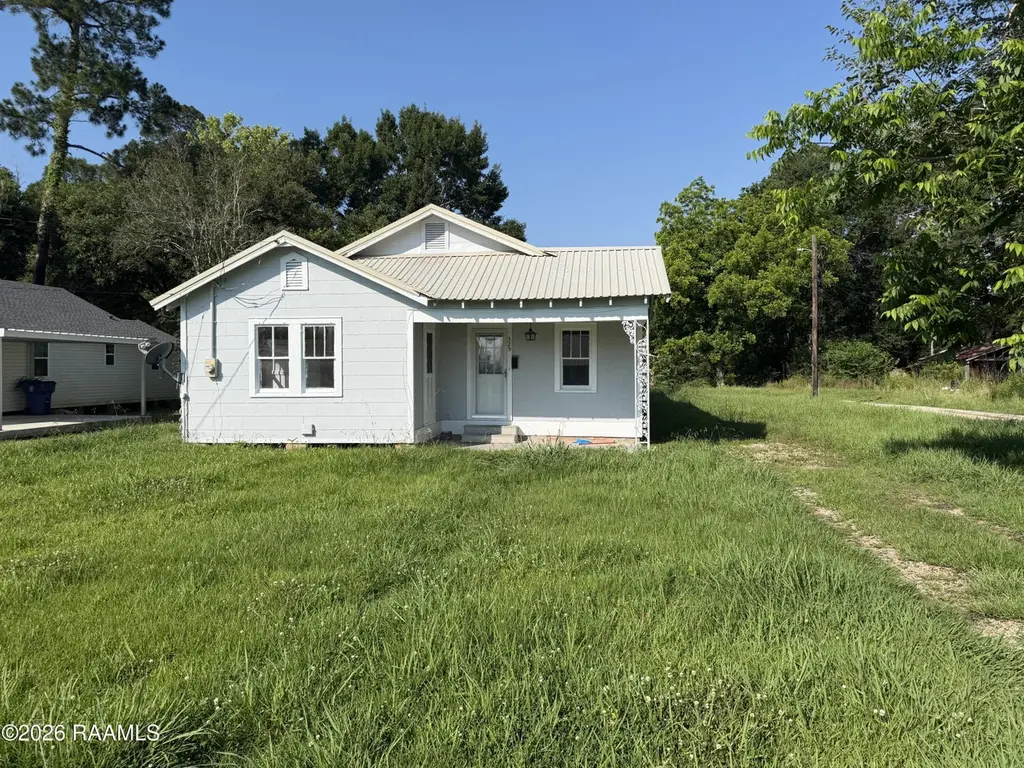
325 S David St · Church Point, LA
Flood risk 8/10 · Major
- FEMA flood zone
- X (shaded)
- Chance of flooding over 30 yrs
- 0.99%
- Est. flood insurance / yr
- $507 – $1,088
Fire risk 2/10 · Minimal
- Est. fire insurance / yr
- $1,269 – $2,357
Heat risk 8/10 · Major
- Hot days now (above 110°F)
- 7 days/yr
- Hot days in 30 yrs
- 20 days/yr
Wind risk 9/10 · Severe
- Chance of severe wind over 30 yrs
- 99.0%
Air-quality risk 1/10 · Minimal
- Unhealthy air days now
- 0 days/yr
- Unhealthy air days in 30 yrs
- 0 days/yr
Risk factors via First Street. Map © Google.
Why this score? — see what drove the B grade
The composite is a weighted blend of 9 inputs, each scored 0–100. Each bar is that input's sub-score; the figure is the points it added to the 100-point composite (weight × sub-score).
- Cash flow +30.0/30.0
- ARV discount +15.0/15.0
- DSCR +10.0/10.0
- 1% rule +8.6/10.0
- Schools +3.2/10.0
- Livability +3.2/5.0
- Rent growth +2.5/5.0
- Condition / age +2.5/5.0
- Appreciation +0.0/10.0
$80,000
🖨 Deal sheet (PDF) 📄 Offer letter ✓ Due diligence
Listing remarks
This 3 bedroom 1 bath home is perfect for a family or investor ready to make some changes to a home with much potential. The seller is willing to offer $7,500 in allowances for repairs with an acceptable offer.
Key facts
- 0.28 acre lot
- Parking
- Listed 37 days
Property features AI
Exterior
- Parking: Open parking
- Utilities: Public sewer; City electricity
- Home design: Single-family residence; Property listed as fixer
- Construction: Asbestos siding or components; Frame construction; Metal roof
- Exterior features: Metal roof; Asbestos and frame construction; Frontage on a paved city street
Interior
- Flooring: Wood
- Bathrooms: 1 full bathroom
- Heating & cooling: Window air conditioning units; No central heating
- Interior features: Wood flooring
Neighborhood map
What this means for you Summary
Snapshot
- This is a 3-bed/1.0-bath single-family listed at $80k.
Deal economics
- At list price, monthly cash flow is $307 ($4k/yr) — positive.
- The deal already cash-flows at list — no discount required.
- Meets the 1% rule at list price ($1k rent vs $80k).
- Recommended offer: $78k (3.0% below list) — sets the bar for market timing.
- Cap rate 11.9% vs local median 3.6% in Church Point — top-decile yield for the area; either an underpriced asset or a hidden risk that comps aren't pricing in. Stress-test before assuming the spread holds.
Location & tenants
- Location reads 63/100 on livability (#194 in LA) — a middle-class / working-renter tenant base. Strengths: cost of living A+, housing A, health & safety B+; Watch: crime F, amenities F, commute F.
- Acadia Parish (rural): math 32% / reading 44% proficiency, ranked #28 of 98 in LA (top 29%) — families likely to look elsewhere, expect single-tenant / working-renter base with shorter leases; 62% free/reduced lunch — lower-income household profile, screen leases tightly.
- Zoned schools: Church Point Elementary School (math 32% / reading 42%, grade F, #251 of 646 statewide, top 41%, 604 students, 83% FRL); Church Point Middle School (math 17% / reading 39%, grade F, #125 of 218 statewide, top 58%, 256 students, 80% FRL); Church Point High School (math 12% / reading 27%, grade F, #186 of 265 statewide, top 73%, 555 students, 64% FRL).
- Market conditions: 123 active listings in the ZIP; 137 units permitted in Acadia Parish in 2024 (0 in 5+ unit buildings).
Forward outlook
- Local home prices are declining (-3.0%/yr); year-one equity from $553 of loan paydown is wiped out by about $2k of value loss. Plan a longer hold.
- At projected returns (-3.0% appreciation + 3.0% rent growth), your $22k cash investment doubles in ~8 years — after that, you're playing with house money.
Negotiation context
- It's been on market 37 days — a 3% lower offer ($78k) is reasonable based on typical stale-listing flexibility.
- 2 sale attempts since 18y ago with the ask held roughly flat each time — persistent listings suggest the price (not the market) is what's stuck; bring a comps-based counter.
Risks & watch-outs
- Watch-outs: flood insurance adds $66/mo.
- Climate carrying-cost: severe flood risk; severe wind risk, 99% chance of damaging wind over 30y; extreme-heat days projected 7→20/yr by 2055 (HVAC capex compounding) — expect insurance premiums to compound above CPI over the hold.
Questions for the listing agent
- It's been on market 37 days. Have you received any prior offers? Is the seller open to a 3% concession, seller financing, or rate buy-down credit?
- What's the actual annual flood-insurance premium (NFIP or private), and is the property in a SFHA with mandatory coverage?
- Is there a deadline driving the sale (1031 exchange, divorce, estate, relocation)? That informs how much negotiation room exists.
- Schools are B-rated — typically a magnet for longer-tenancy family renters. What's the average tenant stay here, and is there a school-zone premium baked into asking?
- Crime grade is F in this area — have there been break-ins, vandalism, or insurance claims at this property in the last 3 years? What carrier currently insures it and at what premium?
- What's the average days-on-market for RENTAL listings here right now (not sales)? A rising rental-DOM trend means longer vacancies and softer asking-rent achievability than the comps imply.
- What's the recent tenant-quality profile in this submarket — average credit score on applications, eviction rate, late-payment / NSF rate, and stable-employment percentage? A property-management company in the area should have these aggregated.
- How much new for-sale + rental construction is in the pipeline within 1–3 miles? Heavy new supply typically softens prices + rents 12–24 months out; constrained supply supports both.
Investment metrics
- 1% rule
- 1.36% ✓
- Cap rate
- 11.89%
- Cash-on-cash
- 20.00%
- DSCR
- 1.89
- GRM
- 6.1
CMA / ARV
- ARV (on-the-fly)
- $124,660
- Comps found
- 7
Show comp detail 7 sales within ~0.75 mi
| Address | Dist | Beds/Ba | Sqft | Sold | Price | $/sf | Match |
|---|---|---|---|---|---|---|---|
| 329 S David St | 0.01mi | 3/2.0 | 1,434 (+6%) | 10mo | $155,000 | $108 | 78 |
| 529 S David St | 0.19mi | 3/2.0 | 1,450 (+7%) | 3mo | $160,000 | $110 | 73 |
| 621 S Broadway St | 0.31mi | 3/2.0 | 1,520 (+12%) | 24mo | $140,000 | $92 | 42 |
| 865 E Venable St | 0.64mi | 3/1.0 | 1,188 (-12%) | 13mo | $90,000 | $76 | 38 |
| 114 Michelle Dr | 0.68mi | 3/1.5 | 1,196 (-12%) | 10mo | $105,000 | $88 | 38 |
| 408 Happy St | 0.70mi | 3/2.0 | 1,500 (+11%) | 13mo | $232,000 | $155 | 34 |
| 210 Marie St | 0.70mi | 3/2.0 | 1,539 (+14%) | 17mo | $69,900 | $45 | 26 |
Match score weights: distance 35% · size 25% · config 20% · recency 20%. Top-matched comps best support the ARV.
Projected returns pro-forma
-3.0% appreciation · 3.0% rent growth · sell at horizon
- IRR
- 7.5%
- Equity multiple
- 1.29×
- Total profit
- $6,603
- Equity at exit
- $11,928
- IRR
- 16.8%
- Equity multiple
- 2.38×
- Total profit
- $30,988
- Equity at exit
- $6,917
Cash invested: $22,400 (down + closing). Projections, not guarantees.
Landlord ↔ Tenant lean methodology
- Overall (STATE)
- 90 Strongly Landlord-Friendly
- State Louisiana
- 90 Strongly Landlord-Friendly · R+12
- County
- — inherits STATE
- City
- — inherits STATE
ZIP-level market 70525
- Home prices YoY
- -31.6%
- Active inventory
- 123
- Price-to-rent
- 6.1×
Monthly cashflow live
- Estimated rent
- $1,087 medium interval (Pro) →
- Mortgage (P&I)
- −$420
- Tax from tax record
- −$33 /mo · $390/yr
- Insurance
- −$33
- Flood insurance flood zone
- −$66 /mo · $798/yr
- HOA
- −$0
- Vacancy / Maint / Mgmt
- −$228
- Net cashflow
- $307
Break-even live
Sensitivity live
| Price | -10% $352 | -5% $330 | +0% $307 | +5% $284 | +10% $262 |
|---|---|---|---|---|---|
| Rent | -10% $221 | -5% $264 | +0% $307 | +5% $350 | +10% $393 |
| Rate | -1.0pp $347 | -0.5pp $327 | base $307 | +0.5pp $286 | +1.0pp $265 |
UW: 25.0% down · 7.5% · 30yr · 1.5% tax · 5.0% vac · 8.0% maint · 8.0% mgmt
Financing live
Cash to close
- Down payment
- $20,000
- Closing costs
- $2,400
- Reserves months
- —
- Total cash needed
- —
Loan-product check · same deal, 3 products live
Conventional
25% down · 7.5% · 30yr
- Down + closing
- —
- Monthly P&I
- —
- Monthly cashflow
- —
- DSCR
- —
- Eligible?
- —
Personal DTI + credit; lowest rate.
DSCR
20% down · 8.5% · 30yr
- Down + closing
- —
- Monthly P&I
- —
- Monthly cashflow
- —
- DSCR
- —
- Eligible?
- —
No personal income docs; deal must DSCR.
Hard money
10% down · 12.0% · 12mo
- Down + closing
- —
- Monthly P&I
- —
- Monthly cashflow
- —
- DSCR
- —
- Eligible?
- —
Short-term bridge; refi at stabilization.
Listing history 18 events
-
2026-06-21days on market $80,000 Active 37 DOM
-
2026-06-18days on market $80,000 Active 35 DOM
-
2026-06-17days on market $80,000 Active 34 DOM
-
2026-06-16days on market $80,000 Active 33 DOM
-
2026-06-15days on market $80,000 Active 32 DOM
-
2026-06-13days on market $80,000 Active 30 DOM
-
2026-06-12days on market $80,000 Active 29 DOM
-
2026-06-09days on market $80,000 Active 26 DOM
-
2026-06-08days on market $80,000 Active 25 DOM
-
2026-06-07days on market $80,000 Active 24 DOM
-
2026-06-07days on market $80,000 Active 23 DOM
-
2026-06-04days on market $80,000 Active 20 DOM
-
2026-06-02days on market $80,000 Active 19 DOM
-
2026-06-01days on market $80,000 Active 18 DOM
-
2026-05-31days on market $80,000 Active 17 DOM
-
2026-05-31days on market $80,000 Active 16 DOM
-
2026-05-14$80,000 Active
-
2008-07-09$54,000
ⓘ Source: listings_history table (triggers on properties + properties_extension) + one-shot
backfill from property_details.listing_events for pre-trigger history.
Tax reassessment forecast LA · Resets to sale price
- Current annual tax
- $390 · $33/mo
- Projected year-2 tax
- $440 · $37/mo
- Expected delta
- +$50/yr (+$4/mo · 12.8%)
ⓘ Screening estimate from a state-policy table — verify with the county assessor before closing.
Climate risk First Street
- Flood 8/10 Severe FEMA zone X (shaded) · 99% chance over 30 yrs
- Wildfire 2/10 Low
- Heat 8/10 Severe 7 d/yr ≥110°F today · 20 d/yr by 30 yrs out
- Wind 9/10 Extreme 99% chance of damaging wind over 30 yrs
- Air quality 1/10 Low 0 unhealthy d/yr today · 0 by 30 yrs out
Nearby sold comps map
Loading sold comps map…
Walkable amenities ~0.75 mi
Loading nearby amenities…
Taxation est. · year 1
- Rental income
- $13,045
- − Mortgage interest
- −$4,481
- − Property taxes
- −$390
- − Insurance
- −$1,198
- − Repairs & maintenance
- −$1,044
- − Management
- −$1,044
- − Depreciation
- −$2,327
- Taxable income
- $2,562
- Est. tax owed @ 24.0%
- −$615
- After-tax cash flow
- $3,069/yr
For passive investors: Depreciation is non-cash, so a rental often shows a tax loss while cash-flowing — sheltering income. Rental losses are passive: they offset passive income freely, and up to $25,000/yr can offset ordinary (W-2) income if you actively participate and your MAGI is under $100k (phasing out to $0 by $150k); unused losses carry forward. On sale, claimed depreciation is recaptured at up to 25%, and gains may owe capital-gains tax (a 1031 exchange can defer both). Figures are a year-1 estimate at your 24.0% rate — not tax advice; consult a CPA.
Schools (NCES district)
- District
- Acadia Parish
- NCES district ID
- 2200030
- Math proficiency
- 32% ▼ -39.00%
- Reading proficiency
- 44% ▼ -32.00%
- Median HH income
- $38,012
- Composite
- 31.65/100
- National rank
- #5929
- State rank
- #28 of 98 in LA
Livability — Church Point
- Score
- 63/100
- State rank
- #194
- US rank
- #15467
Category grades
Schools grade is shown separately in the Schools card above.
Census & demographics
- Census place
- Church Point, LA
- City population
- 15,333
- Population (ZIP)
- 15,333
Population outlook (Acadia County) Hauer SSP2
- Today (2025)
- 63,846 people
- By 2030
- 64,141 · +0.5%
- By 2040
- 63,922 · +0.1%
- By 2050
- 62,263 · -2.5%
- By 2075
- 56,507 · -11.5%
- By 2100
- 46,316 · -27.5%
Race, ethnicity, and origin ACS 2023
- Neighborhood character
- Predominantly White (73%)
- Race & ethnicity
- White 73% Black 19% Two or more races 6% Hispanic / Latino 5% Native American 2%
- Hispanic origin (detail)
- Mexican 4%
- Common ancestry
- Lithuanian 11%
- Foreign-born
- 1% · Canada
- Languages at home
- 91% English-only · French/Haitian/Cajun 6% Spanish 2%
Political lean MEDSL · Acadia
- 2024 margin
- Solid R (+64.0) · D 17.6% · R 81.5%
- 2008→2024 swing
- -18.3pp toward R · 2008: -45.7pp · 2024: -64.0pp
- All cycles
- 2024: R+64.0 2020: R+60.3 2016: R+56.7 2012: R+49.8 2008: R+45.7
Not yet ingested
- Civics
- —
Market trends
- HPI YoY
- ▼ -55.62%
- Current HPI
- 120.2621
- Rent YoY
- —
- Metro
- —
- State GDP YoY
- ▲ 3.29%
- F500 in state
- 10
Industry mix (Fortune 500 HQ in LA)
| Industry | F500 HQs | Revenue |
|---|---|---|
| Telecommunications | 2 | $23B |
|
||
| Utilities | 1 | $12B |
|
||
| Wholesale / Distribution | 1 | $5B |
|
||
| Advertising | 1 | $2B |
|
||
Price history
+48.1% since first listed2 events — show timeline
- 2026-05-14 Listed $80,000 AcadianaMLS
- 2008-07-09 Listed $54,000 AcadianaMLS
Property tax history
+4.2%/yrLatest (2025): $390 · +0.3% YoY. Source: county tax records.
Cash-flow waterfall
monthlySold comps — $/sqft
last 12 mo · ≤1 miLoading sold comps…