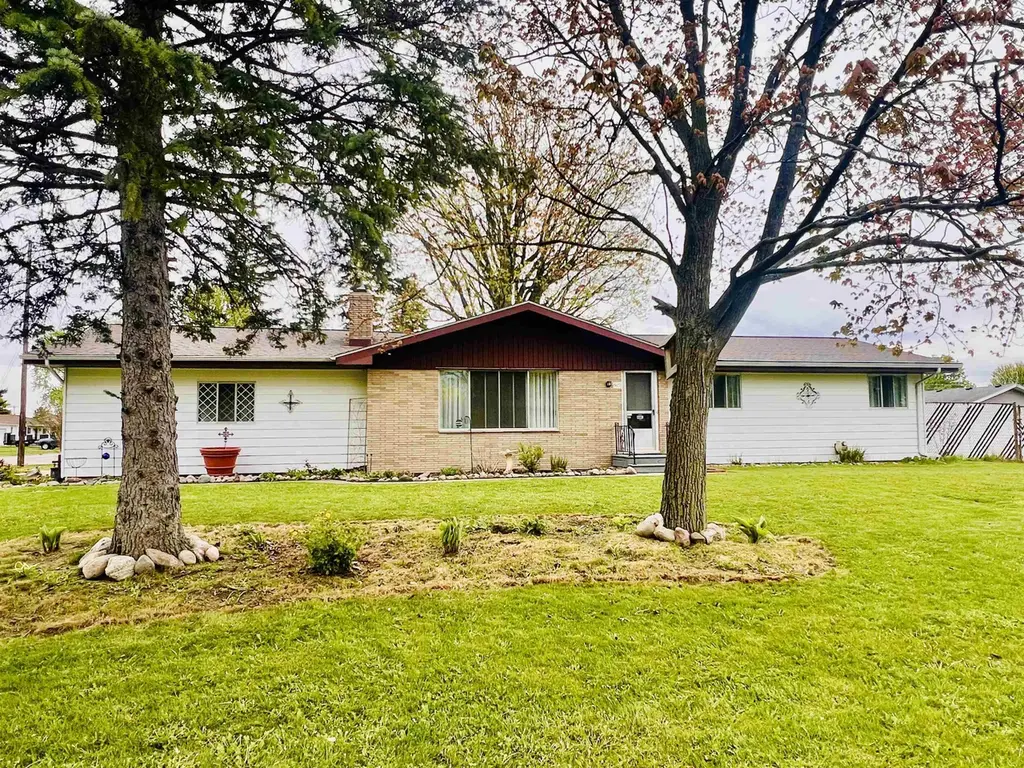
5677 Michael Dr · Bay City, MI
Flood risk 1/10 · Minimal
- FEMA flood zone
- X (unshaded)
- Chance of flooding over 30 yrs
- 0.0%
- Est. flood insurance / yr
- $507 – $1,088
Fire risk 1/10 · Minimal
- Est. fire insurance / yr
- $784 – $1,456
Heat risk 3/10 · Minor
- Hot days now (above 96°F)
- 7 days/yr
- Hot days in 30 yrs
- 14 days/yr
Wind risk 1/10 · Minimal
- Chance of severe wind over 30 yrs
- —
Air-quality risk 2/10 · Minimal
- Unhealthy air days now
- 1 days/yr
- Unhealthy air days in 30 yrs
- 2 days/yr
Risk factors via First Street. Map © Google.
Why this score? — see what drove the D- grade
The composite is a weighted blend of 9 inputs, each scored 0–100. Each bar is that input's sub-score; the figure is the points it added to the 100-point composite (weight × sub-score).
- ARV discount +12.8/15.0
- Cash flow +8.0/30.0
- Livability +3.4/5.0
- Schools +2.8/10.0
- Rent growth +2.5/5.0
- Condition / age +2.5/5.0
- 1% rule +2.4/10.0
- DSCR +2.0/10.0
- Appreciation +0.0/10.0
$180,000
🖨 Deal sheet (PDF) 📄 Offer letter ✓ Due diligence
Listing remarks MLS
Spacious ranch style home with a generous living area, wood burning fireplace, 2 full bathrooms, hardwood flooring in the bedrooms, full basement with finished bonus room and one side that would make a nice family or rec room. First floor laundry room is off the 2 car garage. Yard is fenced and the property is situated on a corner lot in an area great for walking or biking. Price reflects need for new flooring and updating, but it is a nice solid home with great potential.
Key facts
- Full basement
- Built-in features
- Fenced corner lot
Tags
Property features AI
Finance
- Other: Property type: Residential; Lot size approximately 0.25 acre; Large lot frontage (65+ ft.; frontage listed as 89 ft.); Below-grade area noted (basement area reported)
Exterior
- Parking: Attached 2-car garage with garage door opener
- Utilities: Public water; Public sanitary sewer; Natural gas service; Boiler heating system; Gas water heater
- Home design: One-story residential home; Built in 1960; Entry and main living on first floor; Faces east (side of street: E)
- Construction: Block foundation; Basement present; Aluminum siding; Year built: 1960
- Exterior features: Aluminum exterior; Fenced yard; Shed; Corner lot in a subdivision; Road frontage
Interior
- Kitchen: Eat-in kitchen with vinyl flooring
- Bedrooms: Three first-floor bedrooms with wood flooring
- Flooring: Wood flooring in bedrooms; Vinyl flooring in kitchen and living room
- Bathrooms: Two full bathrooms (both on first floor)
- Heating & cooling: Boiler heating; Natural gas fuel; Gas water heater
- Interior features: Living room fireplace (wood burning); Hardwood floors; Eat-in kitchen; First-floor laundry / utility room; Basement (block foundation)
- Laundry & utility: First-floor laundry / utility room
Neighborhood map
What this means for you Summary
Snapshot
- This is a 3-bed/1.5-bath single-family listed at $180k.
Deal economics
- At list price, monthly cash flow is $-185 ($-2k/yr) — negative.
- To cash-flow at today's rent, offer at most $147k (18.1% below list).
- To meet the 1% rule (rent ≥ 1% of price), the offer needs to be $133k (26.3% below list).
- Recommended offer: $133k (26.3% below list) — sets the bar for 1% rule.
Location & tenants
- Location reads 68/100 on livability (#360 in MI) — a middle-class / working-renter tenant base. Strengths: cost of living A+, housing A+, health & safety A+; Watch: schools D+, amenities D, crime F.
- Bay City School District (urban): math 27% / reading 40% proficiency, ranked #317 of 540 in MI (top 59%) — families likely to look elsewhere, expect single-tenant / working-renter base with shorter leases.
- Market conditions: 246 active listings in the ZIP; 39 units permitted in Bay County in 2024 (0 in 5+ unit buildings).
Forward outlook
- Local home prices are declining (-3.0%/yr); year-one equity from $1k of loan paydown is wiped out by about $5k of value loss. Plan a longer hold.
- Bay County population projected at -21% by 2050 — secular population decline; favor cash flow + early exit over multi-decade hold.
Negotiation context
- It's been on market 23 days — a 2% lower offer ($177k) is reasonable based on typical stale-listing flexibility.
- 3 sale attempts since 15y ago with the ask held roughly flat each time — persistent listings suggest the price (not the market) is what's stuck; bring a comps-based counter.
- Current owner paid $140k; 29% above their basis — modest negotiation headroom, anchor on the comps not their cost.
Questions for the listing agent
- What do current leases actually rent for vs. the listed asking? Can we see a recent rent roll and the last 12 months of T-12 income?
- Built in 1960 — when were the roof, HVAC, electrical panel, plumbing, and water heater last replaced?
- Is there a deadline driving the sale (1031 exchange, divorce, estate, relocation)? That informs how much negotiation room exists.
- Schools are D-rated, which usually means shorter tenancies and higher turnover. Who's the typical renter profile here, and what's been the actual vacancy rate?
- Crime grade is F in this area — have there been break-ins, vandalism, or insurance claims at this property in the last 3 years? What carrier currently insures it and at what premium?
- The area grade is low — what's the realistic commute time and amenity access for the typical tenant pool here? Any planned neighborhood developments (good or bad) we should know about?
- What's the average days-on-market for RENTAL listings here right now (not sales)? A rising rental-DOM trend means longer vacancies and softer asking-rent achievability than the comps imply.
- What's the recent tenant-quality profile in this submarket — average credit score on applications, eviction rate, late-payment / NSF rate, and stable-employment percentage? A property-management company in the area should have these aggregated.
- How much new for-sale + rental construction is in the pipeline within 1–3 miles? Heavy new supply typically softens prices + rents 12–24 months out; constrained supply supports both.
Investment metrics
- 1% rule
- 0.74% ✗
- Cap rate
- 5.06%
- Cash-on-cash
- -4.39%
- DSCR
- 0.80
- GRM
- 11.3
CMA / ARV
- ARV (median comp)
- $203,781
- List price
- $180,000
- Delta
- -11.67%
- Verdict
- UNDERPRICED
- Comps
- 20 within 1.0 mi
Show comp detail 12 sales within ~0.75 mi
| Address | Dist | Beds/Ba | Sqft | Sold | Price | $/sf | Match |
|---|---|---|---|---|---|---|---|
| 2975 Continental Dr | 0.12mi | 3/1.0 | 1,326 (-3%) | 1mo | $209,000 | $158 | 87 |
| 2900 Wayne Dr | 0.26mi | 3/1.5 | 1,436 (+5%) | 3mo | $215,000 | $150 | 77 |
| 2923 Thunderbird Dr | 0.08mi | 3/1.5 | 1,272 (-7%) | 10mo | $250,000 | $197 | 77 |
| 5500 Michael Dr | 0.33mi | 3/1.0 | 1,300 (-5%) | 3mo | $198,000 | $152 | 72 |
| 5600 S 2 Mile Rd | 0.19mi | 2/1.0 (-1) | 1,296 (-5%) | 13mo | $155,000 | $120 | 65 |
| 158 Salzburg Rd | 0.41mi | 3/1.5 | 1,231 (-10%) | 2mo | $203,000 | $165 | 63 |
| 2784 Sportsman Ct | 0.51mi | 3/1.5 | 1,446 (+6%) | 20mo | $220,000 | $152 | 50 |
| 5535 Gaertner Ct | 0.60mi | 3/1.0 | 1,173 (-14%) | 1mo | $165,000 | $141 | 46 |
| 5447 Kasemeyer Rd | 0.73mi | 3/2.0 | 1,488 (+9%) | 6mo | $265,000 | $178 | 44 |
| 5991 Westside Saginaw Rd | 0.70mi | 3/2.0 | 1,447 (+6%) | 15mo | $199,000 | $138 | 43 |
| 5538 Christyway Ct | 0.50mi | 3/1.5 | 1,186 (-13%) | 19mo | $151,655 | $128 | 38 |
| 84 E Salzburg Rd | 0.71mi | 2/1.0 (-1) | 1,192 (-13%) | 10mo | $171,000 | $143 | 30 |
Match score weights: distance 35% · size 25% · config 20% · recency 20%. Top-matched comps best support the ARV.
Projected returns pro-forma
-3.0% appreciation · 3.0% rent growth · sell at horizon
- IRR
- -23.7%
- Equity multiple
- 0.19×
- Total profit
- $-40,906
- Equity at exit
- $26,839
- IRR
- -18.7%
- Equity multiple
- -0.01×
- Total profit
- $-50,699
- Equity at exit
- $15,563
Cash invested: $50,400 (down + closing). Projections, not guarantees.
Landlord ↔ Tenant lean methodology
- Overall (STATE)
- 62 Landlord-Friendly
- State Michigan
- 62 Landlord-Friendly · EVEN
- County
- — inherits STATE
- City
- — inherits STATE
ZIP-level market 48706
- Active inventory
- 246
- Price-to-rent
- 11.3×
Monthly cashflow live
- Estimated rent
- $1,326 medium interval (Pro) →
- Mortgage (P&I)
- −$944
- Tax from tax record
- −$213 /mo · $2,562/yr
- Insurance
- −$75
- HOA
- −$0
- Vacancy / Maint / Mgmt
- −$279
- Net cashflow
- $-185
Break-even live
Sensitivity live
| Price | -10% $-83 | -5% $-134 | +0% $-185 | +5% $-235 | +10% $-286 |
|---|---|---|---|---|---|
| Rent | -10% $-289 | -5% $-237 | +0% $-185 | +5% $-132 | +10% $-80 |
| Rate | -1.0pp $-94 | -0.5pp $-139 | base $-185 | +0.5pp $-231 | +1.0pp $-279 |
UW: 25.0% down · 7.5% · 30yr · 1.5% tax · 5.0% vac · 8.0% maint · 8.0% mgmt
Financing live
Cash to close
- Down payment
- $45,000
- Closing costs
- $5,400
- Reserves months
- —
- Total cash needed
- —
Loan-product check · same deal, 3 products live
Conventional
25% down · 7.5% · 30yr
- Down + closing
- —
- Monthly P&I
- —
- Monthly cashflow
- —
- DSCR
- —
- Eligible?
- —
Personal DTI + credit; lowest rate.
DSCR
20% down · 8.5% · 30yr
- Down + closing
- —
- Monthly P&I
- —
- Monthly cashflow
- —
- DSCR
- —
- Eligible?
- —
No personal income docs; deal must DSCR.
Hard money
10% down · 12.0% · 12mo
- Down + closing
- —
- Monthly P&I
- —
- Monthly cashflow
- —
- DSCR
- —
- Eligible?
- —
Short-term bridge; refi at stabilization.
Listing history 15 events
-
2026-06-07statusdays on market $180,000 Pending 23 DOM
-
2026-06-05days on market $180,000 Keep Showing-Contgcy Appl 22 DOM
-
2026-06-03days on market $180,000 Keep Showing-Contgcy Appl 21 DOM
-
2026-06-02days on market $180,000 Keep Showing-Contgcy Appl 20 DOM
-
2026-06-01days on market $180,000 Keep Showing-Contgcy Appl 19 DOM
-
2026-05-31days on market $180,000 Keep Showing-Contgcy Appl 18 DOM
-
2026-05-30days on market $180,000 Keep Showing-Contgcy Appl 17 DOM
-
2026-05-13$180,000 Active 630-char remark
-
2021-06-11soldstatus $140,000
-
2021-06-09soldstatus $140,000 Closed 477-char remark
Show marketing remark (477 chars)
Spacious ranch style home with a generous living area, wood burning fireplace, 2 full bathrooms, hardwood flooring in the bedrooms, full basement with finished bonus room and one side that would make a nice family or rec room. First floor laundry room is off the 2 car garage. Yard is fenced and the property is situated on a corner lot in an area great for walking or biking. Price reflects need for new flooring and updating, but it is a nice solid home with great potential.
-
2021-05-08historical Keep Showing-Contgcy Appl 477-char remark
Show marketing remark (477 chars)
Spacious ranch style home with a generous living area, wood burning fireplace, 2 full bathrooms, hardwood flooring in the bedrooms, full basement with finished bonus room and one side that would make a nice family or rec room. First floor laundry room is off the 2 car garage. Yard is fenced and the property is situated on a corner lot in an area great for walking or biking. Price reflects need for new flooring and updating, but it is a nice solid home with great potential.
-
2021-04-28$140,000 Active 477-char remark
Show marketing remark (477 chars)
Spacious ranch style home with a generous living area, wood burning fireplace, 2 full bathrooms, hardwood flooring in the bedrooms, full basement with finished bonus room and one side that would make a nice family or rec room. First floor laundry room is off the 2 car garage. Yard is fenced and the property is situated on a corner lot in an area great for walking or biking. Price reflects need for new flooring and updating, but it is a nice solid home with great potential.
-
2013-08-27soldstatus $85,000
-
2011-05-05soldstatus $85,000
-
2011-01-29$89,000
ⓘ Source: listings_history table (triggers on properties + properties_extension) + one-shot
backfill from property_details.listing_events for pre-trigger history.
Tax reassessment forecast MI · Partial reset (capped growth)
- Current annual tax
- $2,562 · $213/mo
- Projected year-2 tax
- $2,667 · $222/mo
- Expected delta
- +$105/yr (+$9/mo · 4.1%)
ⓘ Screening estimate from a state-policy table — verify with the county assessor before closing.
Climate risk First Street
- Flood 1/10 Low FEMA zone X (unshaded) · 0% chance over 30 yrs
- Wildfire 1/10 Low
- Heat 3/10 Moderate 7 d/yr ≥96°F today · 14 d/yr by 30 yrs out
- Wind 1/10 Low
- Air quality 2/10 Low 1 unhealthy d/yr today · 2 by 30 yrs out
Nearby sold comps map
Loading sold comps map…
Walkable amenities ~0.75 mi
Loading nearby amenities…
Taxation est. · year 1
- Rental income
- $15,918
- − Mortgage interest
- −$10,083
- − Property taxes
- −$2,562
- − Insurance
- −$900
- − Repairs & maintenance
- −$1,273
- − Management
- −$1,273
- − Depreciation
- −$5,236
- Taxable loss
- −$5,410
- Est. tax savings @ 24.0%
- +$1,298
- After-tax cash flow
- $-916/yr
For passive investors: Depreciation is non-cash, so a rental often shows a tax loss while cash-flowing — sheltering income. Rental losses are passive: they offset passive income freely, and up to $25,000/yr can offset ordinary (W-2) income if you actively participate and your MAGI is under $100k (phasing out to $0 by $150k); unused losses carry forward. On sale, claimed depreciation is recaptured at up to 25%, and gains may owe capital-gains tax (a 1031 exchange can defer both). Figures are a year-1 estimate at your 24.0% rate — not tax advice; consult a CPA.
Schools (NCES district)
- District
- Bay City School District
- NCES district ID
- 2604260
- Math proficiency
- 27% ▼ -8.00%
- Reading proficiency
- 40% ▼ -4.00%
- Median HH income
- $43,833
- Composite
- 28.47/100
- National rank
- #6743
- State rank
- #317 of 540 in MI
Livability — Bay City
- Score
- 68/100
- State rank
- #360
- US rank
- #8912
Category grades
Schools grade is shown separately in the Schools card above.
Census & demographics
- City population
- 25,635
- Population (ZIP)
- 38,756
Population outlook (Bay County) Hauer SSP2
- Today (2025)
- 101,476 people
- By 2030
- 98,152 · -3.3%
- By 2040
- 89,711 · -11.6%
- By 2050
- 80,614 · -20.6%
- By 2075
- 60,544 · -40.3%
- By 2100
- 41,603 · -59.0%
Race, ethnicity, and origin ACS 2023
- Neighborhood character
- Predominantly White (90%)
- Race & ethnicity
- White 90% Hispanic / Latino 5% Two or more races 4%
- Common ancestry
- Romanian 16% Lithuanian 9% Slovak 2%
- Foreign-born
- 1%
- Languages at home
- 98% English-only · Spanish 1%
Political lean MEDSL · Bay
- 2024 margin
- R (+14.7) · D 42.0% · R 56.7% · Other 1.3%
- 2008→2024 swing
- -30.0pp toward R · 2008: 15.3pp · 2024: -14.7pp
- All cycles
- 2024: R+14.7 2020: R+11.6 2016: R+12.6 2012: D+6.0 2008: D+15.3
Not yet ingested
- Civics
- —
Market trends
- HPI YoY
- ▼ -133.29%
- Current HPI
- 203.6444
- Rent YoY
- —
- Metro
- —
- State GDP YoY
- ▲ 1.37%
- F500 in state
- 28
Industry mix (Fortune 500 HQ in MI)
| Industry | F500 HQs | Revenue |
|---|---|---|
| Automotive Parts | 3 | $48B |
|
||
| Automotive | 2 | $372B |
|
||
| Chemicals | 1 | $45B |
|
||
| Automotive Retail | 1 | $29B |
|
||
| Healthcare / Medical Devices | 1 | $23B |
|
||
| Automotive Technology | 1 | $20B |
|
||
Price history
+102.2% since first listed10 events — show timeline
- 2026-06-05 Pending — MiRealSource-MiMLS
- 2026-05-28 Contingent — MiRealSource-MiMLS
- 2026-05-13 Listed $180,000 MiRealSource-MiMLS
- 2021-06-11 Sold (Public Records) $140,000 Public Records
- 2021-06-09 Sold (MLS) $140,000 MiRealSource-MiMLS
- 2021-05-08 Contingent — MiRealSource-MiMLS
- 2021-04-28 Listed $140,000 MiRealSource-MiMLS
- 2013-08-27 Sold (Public Records) $85,000 Public Records
- 2011-05-05 Sold (MLS) $85,000 MiRealSource-MiMLS
- 2011-01-29 Listed $89,000 MiRealSource-MiMLS
Property tax history
+4.4%/yrLatest (2025): $2,562 · +4.1% YoY. Source: county tax records.
Cash-flow waterfall
monthlySold comps — $/sqft
last 12 mo · ≤1 miLoading sold comps…