 6-Plex
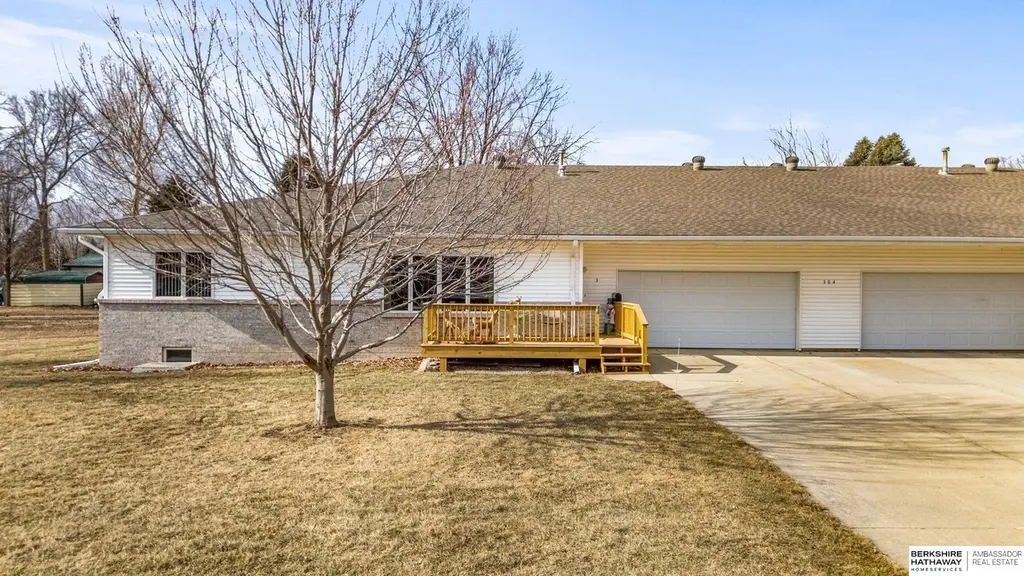
300 & 304 S 7th St Unit 1-8 · Tekamah, NE
Flood risk 1/10 · Minimal
- FEMA flood zone
- X (shaded)
- Chance of flooding over 30 yrs
- 0.0%
- Est. flood insurance / yr
- $507 – $1,088
Fire risk 1/10 · Minimal
- Est. fire insurance / yr
- $1,161 – $2,155
Heat risk 3/10 · Minor
- Hot days now (above 106°F)
- 7 days/yr
- Hot days in 30 yrs
- 15 days/yr
Wind risk 2/10 · Minimal
- Chance of severe wind over 30 yrs
- —
Air-quality risk 1/10 · Minimal
- Unhealthy air days now
- 0 days/yr
- Unhealthy air days in 30 yrs
- 0 days/yr
Risk factors via First Street. Map © Google.
Why this score? — see what drove the D grade
The composite is a weighted blend of 9 inputs, each scored 0–100. Each bar is that input's sub-score; the figure is the points it added to the 100-point composite (weight × sub-score).
- Appreciation +8.9/10.0
- Cash flow +7.5/30.0
- ARV discount +7.5/15.0
- Schools +4.0/10.0
- Livability +3.7/5.0
- Rent growth +2.5/5.0
- Condition / age +2.5/5.0
- 1% rule +2.1/10.0
- DSCR +1.6/10.0
$1,275,000
🖨 Deal sheet (PDF) 📄 Offer letter ✓ Due diligence
Multi-family units
County records classify this as Multi-Family (5+ Unit). Listing-text estimate: 6 units. confirmed
5+ unit building — per-unit beds/baths from public records are typically unavailable; the breakdown below (if shown) is an estimate from the listing text.
Listing remarks MLS
Well-maintained 8-unit multi-family property consisting of two four-unit buildings. The property reflects attentive ownership and has been well-cared for over time. The buildings offer a practical unit layout, and one of the four-plex buildings includes basement areas that provide additional usable space. Every unit features an attached two-car garage, and entries offer minimal steps, supporting ease of access. Units are occupied with leases in place, offering an established rental history. The property has a straightforward operating structure and has been a consistent part of the local rental market. AMA.
Key facts
- Local rental market
- Basement areas
- 0.96 acre lot
Tags
Neighborhood map
What this means for you Summary
Snapshot
- This is a 6 × 3-bed/?-bath units multifamily listed at $1.27M.
Deal economics
- At list price, monthly cash flow is $-2k ($-19k/yr) — negative. Per door: $-269/mo.
- To cash-flow at today's rent, offer at most $1.04M (18.3% below list).
- To meet the 1% rule (rent ≥ 1% of price), the offer needs to be $911k (28.5% below list).
- Recommended offer: $911k (28.5% below list) — sets the bar for 1% rule.
Location & tenants
- Location reads 73/100 on livability (#138 in NE) — a middle-class / working-renter tenant base. Strengths: crime A+, cost of living A+, housing A+; Watch: schools C-, amenities F, commute F.
- Tekamah-Herman Community Schools (rural): math 47% / reading 47% proficiency, ranked #72 of 111 in NE (top 65%) — families likely to look elsewhere, expect single-tenant / working-renter base with shorter leases.
- Market conditions: 25 active listings in the ZIP; 15 units permitted in Burt County in 2024 (0 in 5+ unit buildings).
Forward outlook
- In year one you build about $109k of equity ($9k loan paydown + $100k appreciation (7.9% local appreciation)).
- Burt County population projected at -18% by 2050 — secular population decline; favor cash flow + early exit over multi-decade hold.
- By year 2, paydown + projected appreciation supports a ~$175k cash-out refi (75% LTV) — recoverable capital for the next deal without selling this one.
Negotiation context
- It's been on market 137 days — a 12% lower offer ($1.12M) is reasonable based on typical stale-listing flexibility.
- 3 sale attempts since 16y ago with the ask held roughly flat each time — persistent listings suggest the price (not the market) is what's stuck; bring a comps-based counter.
Questions for the listing agent
- What do current leases actually rent for vs. the listed asking? Can we see a recent rent roll and the last 12 months of T-12 income?
- It's been on market 137 days. Have you received any prior offers? Is the seller open to a 29% concession, seller financing, or rate buy-down credit?
- Can we see the unit-by-unit rent roll, current vacancy, and any below-market leases? What's the average tenancy length?
- What capital expenditures (roof, boiler, parking lot, exteriors) have been made in the last 5 years, and what's planned in the next 2?
- Why hasn't it sold? Are there any deal-killer items the seller is aware of (foundation, flood, title, zoning, code violations)?
- Is there a deadline driving the sale (1031 exchange, divorce, estate, relocation)? That informs how much negotiation room exists.
- The area grade is low — what's the realistic commute time and amenity access for the typical tenant pool here? Any planned neighborhood developments (good or bad) we should know about?
- What's the average days-on-market for RENTAL listings here right now (not sales)? A rising rental-DOM trend means longer vacancies and softer asking-rent achievability than the comps imply.
- What's the recent tenant-quality profile in this submarket — average credit score on applications, eviction rate, late-payment / NSF rate, and stable-employment percentage? A property-management company in the area should have these aggregated.
- How much new apartment / multifamily construction is in the pipeline within 1–3 miles? Heavy new supply (>2% of stock underway) typically softens rents 12–24 months out; light construction supports rent growth.
Investment metrics
- 1% rule
- 0.71% ✗
- Cap rate
- 4.77%
- Cash-on-cash
- -5.42%
- DSCR
- 0.76
- GRM
- 11.7
CMA / ARV
No comps found within radius.
Projected returns pro-forma
7.88% appreciation · 3.0% rent growth · sell at horizon
- IRR
- 15.6%
- Equity multiple
- 2.16×
- Total profit
- $412,987
- Equity at exit
- $958,428
- IRR
- 15.3%
- Equity multiple
- 4.57×
- Total profit
- $1,274,560
- Equity at exit
- $1,892,800
Cash invested: $357,000 (down + closing). Projections, not guarantees.
Landlord ↔ Tenant lean methodology
- Overall (STATE)
- 83 Strongly Landlord-Friendly
- State Nebraska
- 83 Strongly Landlord-Friendly · R+13
- County
- — inherits STATE
- City
- — inherits STATE
ZIP-level market 68061
- Home prices YoY
- 3.2%
- Active inventory
- 25
- Price-to-rent
- 70.0×
Monthly cashflow live
- Estimated rent
- $9,111 medium interval (Pro) →
- Mortgage (P&I)
- −$6,686
- Tax est. 1.5%
- −$1,594 /mo · $19,125/yr
- Insurance
- −$531
- HOA
- −$0
- Vacancy / Maint / Mgmt
- −$1,913
- Net cashflow
- $-1,614
Break-even live
Sensitivity live
| Price | -10% $-732 | -5% $-1,173 | +0% $-1,614 | +5% $-2,054 | +10% $-2,495 |
|---|---|---|---|---|---|
| Rent | -10% $-2,333 | -5% $-1,973 | +0% $-1,614 | +5% $-1,254 | +10% $-894 |
| Rate | -1.0pp $-971 | -0.5pp $-1,289 | base $-1,614 | +0.5pp $-1,944 | +1.0pp $-2,280 |
6-unit breakdown (identical units grouped — click to expand)
| Units | Beds | Baths | Est. rent |
|---|---|---|---|
| 6× units | 3 | — | $9,114 |
| #1 | 3 | — | $1,519 |
| #2 | 3 | — | $1,519 |
| #3 | 3 | — | $1,519 |
| #4 | 3 | — | $1,519 |
| #5 | 3 | — | $1,519 |
| #6 | 3 | — | $1,519 |
| Total (6 units) | $9,111 | ||
UW: 25.0% down · 7.5% · 30yr · 1.5% tax · 5.0% vac · 8.0% maint · 8.0% mgmt
Financing live
Cash to close
- Down payment
- $318,750
- Closing costs
- $38,250
- Reserves months
- —
- Total cash needed
- —
Loan-product check · same deal, 3 products live
Conventional
25% down · 7.5% · 30yr
- Down + closing
- —
- Monthly P&I
- —
- Monthly cashflow
- —
- DSCR
- —
- Eligible?
- —
Personal DTI + credit; lowest rate.
DSCR
20% down · 8.5% · 30yr
- Down + closing
- —
- Monthly P&I
- —
- Monthly cashflow
- —
- DSCR
- —
- Eligible?
- —
No personal income docs; deal must DSCR.
Hard money
10% down · 12.0% · 12mo
- Down + closing
- —
- Monthly P&I
- —
- Monthly cashflow
- —
- DSCR
- —
- Eligible?
- —
Short-term bridge; refi at stabilization.
Listing history 20 events
-
2026-06-21days on market $1,275,000 Active 137 DOM
-
2026-06-18days on market $1,275,000 Active 135 DOM
-
2026-06-17days on market $1,275,000 Active 134 DOM
-
2026-06-16days on market $1,275,000 Active 133 DOM
-
2026-06-15days on market $1,275,000 Active 132 DOM
-
2026-06-13days on market $1,275,000 Active 130 DOM
-
2026-06-12days on market $1,275,000 Active 129 DOM
-
2026-06-09days on market $1,275,000 Active 126 DOM
-
2026-06-08days on market $1,275,000 Active 125 DOM
-
2026-06-07days on market $1,275,000 Active 124 DOM
-
2026-06-07days on market $1,275,000 Active 123 DOM
-
2026-06-04days on market $1,275,000 Active 120 DOM
-
2026-06-02days on market $1,275,000 Active 119 DOM
-
2026-06-01days on market $1,275,000 Active 118 DOM
-
2026-05-31days on market $1,275,000 Active 117 DOM
-
2026-02-03$1,275,000 New 614-char remark
Show marketing remark (614 chars)
Well-maintained 8-unit multi-family property consisting of two four-unit buildings. The property reflects attentive ownership and has been well-cared for over time. The buildings offer a practical unit layout, and one of the four-plex buildings includes basement areas that provide additional usable space. Every unit features an attached two-car garage, and entries offer minimal steps, supporting ease of access. Units are occupied with leases in place, offering an established rental history. The property has a straightforward operating structure and has been a consistent part of the local rental market. AMA.
-
2014-05-25historical
-
2013-05-24$600,000
-
2010-10-11historical
-
2010-04-10$600,000
ⓘ Source: listings_history table (triggers on properties + properties_extension) + one-shot
backfill from property_details.listing_events for pre-trigger history.
Climate risk First Street
- Flood 1/10 Low FEMA zone X (shaded) · 0% chance over 30 yrs
- Wildfire 1/10 Low
- Heat 3/10 Moderate 7 d/yr ≥106°F today · 15 d/yr by 30 yrs out
- Wind 2/10 Low
- Air quality 1/10 Low 0 unhealthy d/yr today · 0 by 30 yrs out
Nearby sold comps map
Loading sold comps map…
Walkable amenities ~0.75 mi
Loading nearby amenities…
Taxation est. · year 1
- Rental income
- $109,332
- − Mortgage interest
- −$71,420
- − Property taxes
- −$19,125
- − Insurance
- −$6,375
- − Repairs & maintenance
- −$8,747
- − Management
- −$8,747
- − Depreciation
- −$37,091
- Taxable loss
- −$42,172
- Est. tax savings @ 24.0%
- +$10,121
- After-tax cash flow
- $-9,241/yr
For passive investors: Depreciation is non-cash, so a rental often shows a tax loss while cash-flowing — sheltering income. Rental losses are passive: they offset passive income freely, and up to $25,000/yr can offset ordinary (W-2) income if you actively participate and your MAGI is under $100k (phasing out to $0 by $150k); unused losses carry forward. On sale, claimed depreciation is recaptured at up to 25%, and gains may owe capital-gains tax (a 1031 exchange can defer both). Figures are a year-1 estimate at your 24.0% rate — not tax advice; consult a CPA.
Schools (NCES district)
- District
- Tekamah-Herman Community Schools
- NCES district ID
- 3100071
- Math proficiency
- 47% ▬ 0.00%
- Reading proficiency
- 47% ▼ -1.00%
- Median HH income
- $48,922
- Composite
- 40.2/100
- National rank
- #3784
- State rank
- #72 of 111 in NE
Livability — Tekamah
- Score
- 73/100
- State rank
- #138
- US rank
- #5087
Category grades
Schools grade is shown separately in the Schools card above.
Census & demographics
- Census place
- Tekamah, NE
- Population (ZIP)
- 2,249
Population outlook (Burt County) Hauer SSP2
- Today (2025)
- 6,136 people
- By 2030
- 5,896 · -3.9%
- By 2040
- 5,446 · -11.2%
- By 2050
- 5,044 · -17.8%
- By 2075
- 4,535 · -26.1%
- By 2100
- 3,973 · -35.3%
Race, ethnicity, and origin ACS 2023
- Neighborhood character
- Predominantly White (95%)
- Race & ethnicity
- White 95% Two or more races 4%
- Common ancestry
- Lithuanian 2% Slovak 2% Italian 1%
- Foreign-born
- 1% · China
- Languages at home
- 99% English-only · Spanish 1%
Political lean MEDSL · Burt
- 2024 margin
- Solid R (+45.1) · D 26.9% · R 72.0% · Other 1.1%
- 2008→2024 swing
- -30.5pp toward R · 2008: -14.6pp · 2024: -45.1pp
- All cycles
- 2024: R+45.1 2020: R+40.6 2016: R+40.6 2012: R+22.0 2008: R+14.6
Not yet ingested
- Civics
- —
Market trends
- HPI YoY
- ▲ 7.88%
- Current HPI
- 257.6227
- Rent YoY
- —
- Metro
- —
- State GDP YoY
- ▲ 0.68%
- F500 in state
- 2
Industry mix (Fortune 500 HQ in NE)
| Industry | F500 HQs | Revenue |
|---|---|---|
| Conglomerate | 1 | $371B |
|
||
Price history
+112.5% since first listed5 events — show timeline
- 2026-02-03 Listed $1,275,000 GPRMLS
- 2014-05-25 Listing Removed — GPRMLS
- 2013-05-24 Listed $600,000 GPRMLS
- 2010-10-11 Listing Removed — GPRMLS
- 2010-04-10 Listed $600,000 GPRMLS
Cash-flow waterfall
monthlySold comps — $/sqft
last 12 mo · ≤1 miLoading sold comps…