12450-Unit 8R Crystal Mountain Dr · Crystal Mountain, MI
Flood risk 1/10 · Minimal
- FEMA flood zone
- X (unshaded)
- Chance of flooding over 30 yrs
- 0.0%
- Est. flood insurance / yr
- $507 – $1,088
Fire risk 1/10 · Minimal
- Est. fire insurance / yr
- $784 – $1,456
Heat risk 1/10 · Minimal
- Hot days now (above 94°F)
- 7 days/yr
- Hot days in 30 yrs
- 14 days/yr
Wind risk 1/10 · Minimal
- Chance of severe wind over 30 yrs
- —
Air-quality risk 2/10 · Minimal
- Unhealthy air days now
- 1 days/yr
- Unhealthy air days in 30 yrs
- 2 days/yr
Risk factors via First Street. Map © Google.
Why this score? — see what drove the D grade
The composite is a weighted blend of 9 inputs, each scored 0–100. Each bar is that input's sub-score; the figure is the points it added to the 100-point composite (weight × sub-score).
- Cash flow +13.0/30.0
- ARV discount +7.5/15.0
- 1% rule +5.3/10.0
- Condition / age +4.0/5.0
- DSCR +3.9/10.0
- Schools +3.3/10.0
- Livability +2.6/5.0
- Rent growth +2.5/5.0
- Appreciation +0.0/10.0
$224,900
🖨 Deal sheet (PDF) 📄 Offer letter ✓ Due diligence
Listing remarks
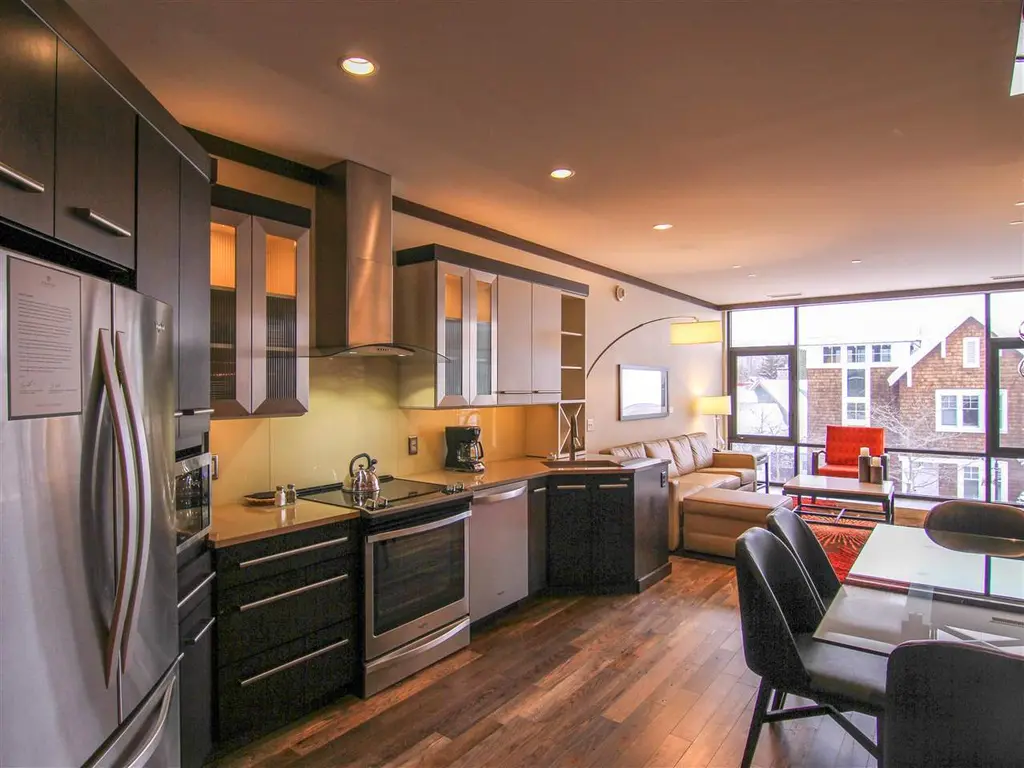
Ask someone ‚Å“what is the best season at Crystal Mountain?‚ Youll likely hear the response. ‚Å“All Seasons". This all-season Inn Residence one-eighth share, with three bedrooms and three bathrooms is located in the heart of the resort, perched across from the Park at Waters Edge, providing convenient access to all of Crystals amenities, regardless of the season. The smart design includes a multi-keyed entry for rental potential, even when using one of the three rooms yourself. Sophisticated and comfortable finishes await your every turn: floor-to-ceiling windows provide abundant natural light; spa-inspired bathrooms with porcelain tiled show
Key facts
- Rooftop terrace
- Gas fireplace
- Designated parking
Tags
Property features AI
Finance
- Other: Pets allowed
- HOA & community: Homeowners association with monthly fee of $284; HOA covers grounds and structure maintenance, sewer, snow removal, trash, and water; Community amenities: pool, fitness center, tennis courts, ski access, trails
Exterior
- Utilities: Shared well water; Septic tank sewer
- Home design: Condominium; Residential property; One level
- Construction: Stone and wood siding exterior
- Exterior features: Balcony; Located on/near golf course
Interior
- Kitchen: Dishwasher; Disposal; Microwave; Oven; Refrigerator; Range
- Bathrooms: 3 full bathrooms
- Heating & cooling: Geothermal heating; Heat pump heating; Central air conditioning; Exhaust fan; Heat pump cooling
- Interior features: Window treatments; Gas fireplace
Neighborhood map
What this means for you Summary
Snapshot
- This is a 3-bed/3.0-bath condo listed at $225k. Condition is rated good.
Deal economics
- At list price, monthly cash flow is $-13 ($-156/yr) — negative.
- To cash-flow at today's rent, offer at most $223k (0.8% below list).
- Meets the 1% rule at list price ($2k rent vs $225k).
- Recommended offer: $211k (6.0% below list) — sets the bar for market timing.
Location & tenants
- Location reads 52/100 on livability (#682 in MI) — a working-class tenant base; expect higher turnover. Strengths: housing A+, crime A; Watch: amenities F, commute F, employment F.
- Benzie County Central Schools (rural): math 33% / reading 44% proficiency, ranked #234 of 540 in MI (top 43%) — families likely to look elsewhere, expect single-tenant / working-renter base with shorter leases.
- Zoned schools: Benzie Central Middle School (math 32% / reading 42%, grade F, #248 of 493 statewide, top 53%, 264 students, 74% FRL) — zoned schools average 74% FRL vs 52% district-wide (22 pts higher); higher-poverty schools than district average — tighter screening recommended.
- Market conditions: 57 active listings in the ZIP; 110 units permitted in Benzie County in 2024 (0 in 5+ unit buildings).
Forward outlook
- Local home prices are declining (-3.0%/yr); year-one equity from $2k of loan paydown is wiped out by about $7k of value loss. Plan a longer hold.
- Benzie County population projected at -21% by 2050 — secular population decline; favor cash flow + early exit over multi-decade hold.
Negotiation context
- It's been on market 70 days — a 6% lower offer ($211k) is reasonable based on typical stale-listing flexibility.
Questions for the listing agent
- What do current leases actually rent for vs. the listed asking? Can we see a recent rent roll and the last 12 months of T-12 income?
- It's been on market 70 days. Have you received any prior offers? Is the seller open to a 6% concession, seller financing, or rate buy-down credit?
- What does the HOA fee cover, when was the last increase, and are there any pending special assessments or reserve-fund shortfalls?
- Any open or pending special assessments — roof, HVAC, plumbing, elevator, façade? What's the per-unit balance and payoff schedule, and is the seller paying it off at close or rolling it to the buyer?
- Why hasn't it sold? Are there any deal-killer items the seller is aware of (foundation, flood, title, zoning, code violations)?
- Is there a deadline driving the sale (1031 exchange, divorce, estate, relocation)? That informs how much negotiation room exists.
- The area grade is low — what's the realistic commute time and amenity access for the typical tenant pool here? Any planned neighborhood developments (good or bad) we should know about?
- What's the average days-on-market for RENTAL listings here right now (not sales)? A rising rental-DOM trend means longer vacancies and softer asking-rent achievability than the comps imply.
- What's the recent tenant-quality profile in this submarket — average credit score on applications, eviction rate, late-payment / NSF rate, and stable-employment percentage? A property-management company in the area should have these aggregated.
- How much new apartment / multifamily construction is in the pipeline within 1–3 miles? Heavy new supply (>2% of stock underway) typically softens rents 12–24 months out; light construction supports rent growth.
Investment metrics
- 1% rule
- 1.03% ✓
- Cap rate
- 6.22%
- Cash-on-cash
- -0.25%
- DSCR
- 0.99
- GRM
- 8.1
CMA / ARV
No comps found within radius.
Projected returns pro-forma
-3.0% appreciation · 3.0% rent growth · sell at horizon
- IRR
- -16.6%
- Equity multiple
- 0.41×
- Total profit
- $-37,062
- Equity at exit
- $33,533
- IRR
- -8.2%
- Equity multiple
- 0.48×
- Total profit
- $-32,489
- Equity at exit
- $19,445
Cash invested: $62,972 (down + closing). Projections, not guarantees.
Landlord ↔ Tenant lean methodology
- Overall (STATE)
- 62 Landlord-Friendly
- State Michigan
- 62 Landlord-Friendly · EVEN
- County
- — inherits STATE
- City
- — inherits STATE
ZIP-level market 49683
- Home prices YoY
- -33.9%
- Active inventory
- 57
- Price-to-rent
- 8.1×
Monthly cashflow live
- Estimated rent
- $2,310 medium interval (Pro) →
- Mortgage (P&I)
- −$1,179
- Tax est. 1.5%
- −$281 /mo · $3,374/yr
- Insurance
- −$94
- HOA
- −$284
- Vacancy / Maint / Mgmt
- −$485
- Net cashflow
- $-13
Break-even live
Sensitivity live
| Price | -10% $142 | -5% $65 | +0% $-13 | +5% $-91 | +10% $-168 |
|---|---|---|---|---|---|
| Rent | -10% $-196 | -5% $-104 | +0% $-13 | +5% $78 | +10% $170 |
| Rate | -1.0pp $100 | -0.5pp $44 | base $-13 | +0.5pp $-71 | +1.0pp $-131 |
UW: 25.0% down · 7.5% · 30yr · 1.5% tax · 5.0% vac · 8.0% maint · 8.0% mgmt
Financing live
Cash to close
- Down payment
- $56,225
- Closing costs
- $6,747
- Reserves months
- —
- Total cash needed
- —
Loan-product check · same deal, 3 products live
Conventional
25% down · 7.5% · 30yr
- Down + closing
- —
- Monthly P&I
- —
- Monthly cashflow
- —
- DSCR
- —
- Eligible?
- —
Personal DTI + credit; lowest rate.
DSCR
20% down · 8.5% · 30yr
- Down + closing
- —
- Monthly P&I
- —
- Monthly cashflow
- —
- DSCR
- —
- Eligible?
- —
No personal income docs; deal must DSCR.
Hard money
10% down · 12.0% · 12mo
- Down + closing
- —
- Monthly P&I
- —
- Monthly cashflow
- —
- DSCR
- —
- Eligible?
- —
Short-term bridge; refi at stabilization.
HOA detail condo
- Monthly dues
- $284 · $3,408/yr
- Likely covers
- water
- Assessments
- None detected in remarks — confirm with the listing agent.
Listing history 19 events
-
2026-06-22days on market $224,900 Active 70 DOM
-
2026-06-21days on market $224,900 Active 69 DOM
-
2026-06-19days on market $224,900 Active 67 DOM
-
2026-06-18days on market $224,900 Active 66 DOM
-
2026-06-17days on market $224,900 Active 65 DOM
-
2026-06-16days on market $224,900 Active 64 DOM
-
2026-06-15days on market $224,900 Active 63 DOM
-
2026-06-14days on market $224,900 Active 61 DOM
-
2026-06-12days on market $224,900 Active 60 DOM
-
2026-06-09days on market $224,900 Active 57 DOM
-
2026-06-08days on market $224,900 Active 56 DOM
-
2026-06-07days on market $224,900 Active 55 DOM
-
2026-06-05days on market $224,900 Active 52 DOM
-
2026-06-03days on market $224,900 Active 51 DOM
-
2026-06-02days on market $224,900 Active 50 DOM
-
2026-06-01days on market $224,900 Active 49 DOM
-
2026-05-31days on market $224,900 Active 48 DOM
-
2026-05-30days on market $224,900 Active 47 DOM
-
2026-04-13$224,900 Active
ⓘ Source: listings_history table (triggers on properties + properties_extension) + one-shot
backfill from property_details.listing_events for pre-trigger history.
Climate risk First Street
- Flood 1/10 Low FEMA zone X (unshaded) · 0% chance over 30 yrs
- Wildfire 1/10 Low
- Heat 1/10 Low 7 d/yr ≥94°F today · 14 d/yr by 30 yrs out
- Wind 1/10 Low
- Air quality 2/10 Low 1 unhealthy d/yr today · 2 by 30 yrs out
Nearby sold comps map
Loading sold comps map…
Walkable amenities ~0.75 mi
Loading nearby amenities…
Taxation est. · year 1
- Rental income
- $27,725
- − Mortgage interest
- −$12,598
- − Property taxes
- −$3,374
- − Insurance
- −$1,124
- − Repairs & maintenance
- −$2,218
- − Management
- −$2,218
- − HOA
- −$3,408
- − Depreciation
- −$6,543
- Taxable loss
- −$3,757
- Est. tax savings @ 24.0%
- +$902
- After-tax cash flow
- $746/yr
For passive investors: Depreciation is non-cash, so a rental often shows a tax loss while cash-flowing — sheltering income. Rental losses are passive: they offset passive income freely, and up to $25,000/yr can offset ordinary (W-2) income if you actively participate and your MAGI is under $100k (phasing out to $0 by $150k); unused losses carry forward. On sale, claimed depreciation is recaptured at up to 25%, and gains may owe capital-gains tax (a 1031 exchange can defer both). Figures are a year-1 estimate at your 24.0% rate — not tax advice; consult a CPA.
Condition & rehab AI · 13 photos
This well-maintained and updated condo is in good condition with modern amenities and a good location. It is ready for immediate occupancy and can be further enhanced with some cosmetic updates.
Value-add opportunities
- Both Painting the exterior and interior walls — Fresh paint can enhance curb appeal and interior aesthetics, making the property more attractive to buyers and renters
- Both Landscaping improvements — Enhanced landscaping can improve curb appeal and add value to the property
Renovation cost estimate screening
Value-add ROI direction
- Both Painting the exterior and interior walls — Fresh paint can enhance curb appeal and interior aesthetics, making the property more attractive to buyers and renters ↑
- Both Landscaping improvements — Enhanced landscaping can improve curb appeal and add value to the property ↑
ⓘ Cost ranges are severity-bucket heuristics (US national rule-of-thumb). Get contractor quotes + a written scope before underwriting a rehab budget.
Schools (NCES district)
- District
- Benzie County Central Schools
- NCES district ID
- 2604950
- Math proficiency
- 33% ▼ -2.00%
- Reading proficiency
- 44% ▼ -2.00%
- Median HH income
- $46,158
- Composite
- 32.84/100
- National rank
- #5616
- State rank
- #234 of 540 in MI
Livability — Crystal Mountain
- Score
- 52/100
- State rank
- #682
- US rank
- #24757
Category grades
Schools grade is shown separately in the Schools card above.
Census & demographics
- Census place
- Crystal Mountain, MI
- Population (ZIP)
- 2,070
Population outlook (Benzie County) Hauer SSP2
- Today (2025)
- 17,179 people
- By 2030
- 16,774 · -2.4%
- By 2040
- 15,308 · -10.9%
- By 2050
- 13,594 · -20.9%
- By 2075
- 11,015 · -35.9%
- By 2100
- 8,181 · -52.4%
Race, ethnicity, and origin ACS 2023
- Neighborhood character
- Predominantly White (92%)
- Race & ethnicity
- White 92% Two or more races 4% Native American 2%
- Common ancestry
- Romanian 8% Iranian 6% Lithuanian 2%
- Foreign-born
- 2% · Canada
- Languages at home
- 98% English-only · Other Indo-European 1% Spanish 0%
Political lean MEDSL · Benzie
- 2024 margin
- Lean R (+8.7) · D 45.0% · R 53.7% · Other 1.3%
- 2008→2024 swing
- -16.1pp toward R · 2008: 7.4pp · 2024: -8.7pp
- All cycles
- 2024: R+8.7 2020: R+9.1 2016: R+14.0 2012: R+3.9 2008: D+7.4
Not yet ingested
- Civics
- —
Market trends
- HPI YoY
- ▼ -90.79%
- Current HPI
- 176.9311
- Rent YoY
- —
- Metro
- —
- State GDP YoY
- ▲ 1.37%
- F500 in state
- 28
Industry mix (Fortune 500 HQ in MI)
| Industry | F500 HQs | Revenue |
|---|---|---|
| Automotive Parts | 3 | $48B |
|
||
| Automotive | 2 | $372B |
|
||
| Chemicals | 1 | $45B |
|
||
| Automotive Retail | 1 | $29B |
|
||
| Healthcare / Medical Devices | 1 | $23B |
|
||
| Automotive Technology | 1 | $20B |
|
||
Price history
1 event — show timeline
- 2026-04-13 Listed $224,900 REALCOMP
Cash-flow waterfall
monthlySold comps — $/sqft
last 12 mo · ≤1 miLoading sold comps…