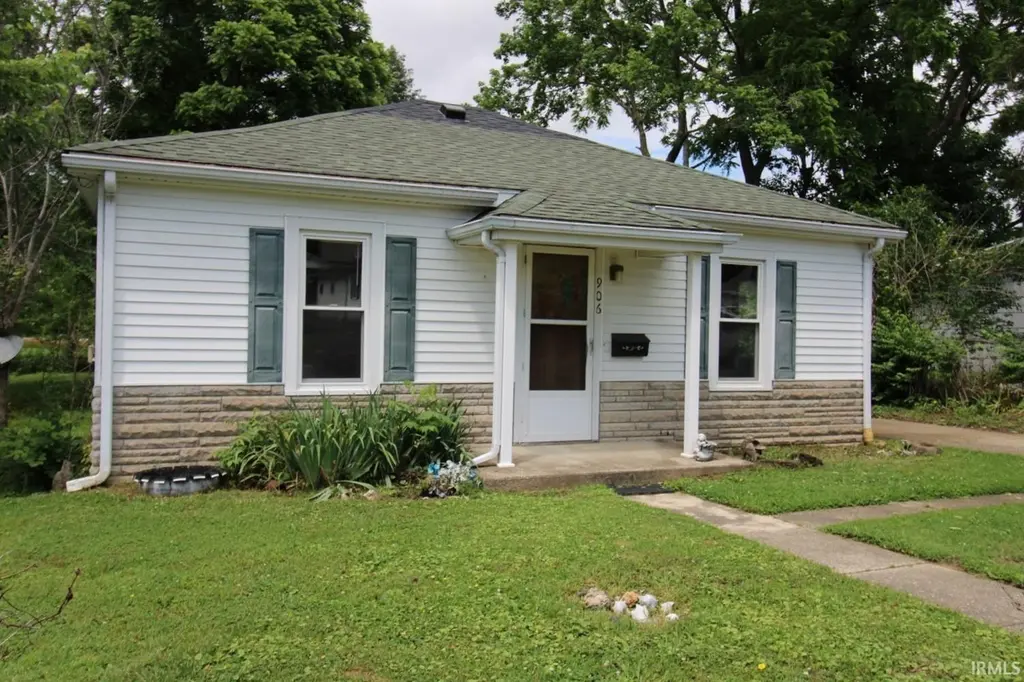
906 E State St · Princeton, IN
Flood risk 1/10 · Minimal
- FEMA flood zone
- X (unshaded)
- Chance of flooding over 30 yrs
- 0.0%
- Est. flood insurance / yr
- $507 – $1,088
Fire risk 1/10 · Minimal
- Est. fire insurance / yr
- $717 – $1,331
Heat risk 5/10 · Moderate
- Hot days now (above 107°F)
- 7 days/yr
- Hot days in 30 yrs
- 19 days/yr
Wind risk 2/10 · Minimal
- Chance of severe wind over 30 yrs
- 4.0%
Air-quality risk 3/10 · Minor
- Unhealthy air days now
- 2 days/yr
- Unhealthy air days in 30 yrs
- 3 days/yr
Risk factors via First Street. Map © Google.
Why this score? — see what drove the B- grade
The composite is a weighted blend of 9 inputs, each scored 0–100. Each bar is that input's sub-score; the figure is the points it added to the 100-point composite (weight × sub-score).
- Cash flow +30.0/30.0
- 1% rule +10.0/10.0
- DSCR +10.0/10.0
- ARV discount +7.5/15.0
- Livability +3.6/5.0
- Schools +2.7/10.0
- Rent growth +2.5/5.0
- Condition / age +2.5/5.0
- Appreciation +0.0/10.0
$58,500
🖨 Deal sheet 📄 Offer letter ✓ Due diligence
Listing remarks
This 2 Bedroom house has been a home for a Mother & Grandmother for the past 30 years. Now being offered to for someone wanting to apply some TLC and turn this into their own residence OR an Investor for a Rental. Great Location sitting at the edge of town. Home may be small but very large closet throughout home. Love the Vintage Wallpaper in the Large Laundry room. The Shady back yard offers privacy. Home SOLD AS IS.
Key facts
- Vintage wallpaper
- Shady back yard
- 4,347 sq ft lot
Tags
Property features AI
Finance
- HOA & community: No association amenities
Exterior
- Parking: Concrete parking surface
- Utilities: Public water; Public sewer; Cable available
- Home design: Single-story single family residence (site-built)
- Construction: Stone and vinyl siding exterior
- Exterior features: Patio; Shed(s); Level, landscaped lot; Paved, publicly maintained road
Interior
- Kitchen: Gas water heater; Water heater
- Bedrooms: 6 total rooms (bedroom count not specified)
- Flooring: Hardwood flooring; Vinyl flooring
- Bathrooms: 1 full bathroom (main level)
- Heating & cooling: Natural gas heating; No cooling
- Interior features: Eat-in kitchen; Crawl space basement
- Laundry & utility: Washer hookup; Electric dryer hookup; Laundry on main level
Neighborhood map
What this means for you Summary
Snapshot
- This is a 2-bed/1.0-bath single-family listed at $58k.
Deal economics
- At list price, monthly cash flow is $460 ($6k/yr) — positive.
- The deal already cash-flows at list — no discount required.
- Meets the 1% rule at list price ($1k rent vs $58k).
- Cap rate 15.7% vs local median 4.6% in Princeton — top-decile yield for the area; either an underpriced asset or a hidden risk that comps aren't pricing in. Stress-test before assuming the spread holds.
Location & tenants
- Location reads 71/100 on livability (#131 in IN) — a middle-class / working-renter tenant base. Strengths: cost of living A+, housing A+; Watch: employment C-, amenities F, commute F.
- North Gibson School Corporation (rural): math 28% / reading 36% proficiency, ranked #223 of 301 in IN (top 74%) — families likely to look elsewhere, expect single-tenant / working-renter base with shorter leases.
- Zoned schools: Princeton Comm Primary School (414 students, 53% FRL); Princeton Community Middle (math 23% / reading 37%, grade F, #208 of 330 statewide, top 64%, 431 students, 53% FRL); Princeton Community High School (math 22% / reading 57%, grade F, #221 of 369 statewide, top 63%, 618 students, 41% FRL).
- Market conditions: 138 active listings in the ZIP; 3 comparable units currently listed for rent nearby; rentals lingering (median 44d on market — plan ~5-8 weeks vacancy on turnover, expect pricing pressure); 100% of comp listings sitting > 30 days — soft ceiling on asking rent; 167 units permitted in Gibson County in 2024 (68 in 5+ unit buildings).
Forward outlook
- Local home prices are declining (-3.0%/yr); year-one equity from $404 of loan paydown is wiped out by about $2k of value loss. Plan a longer hold.
- Gibson County population projected to shrink 10% by 2050 — rents likely to lag national; underwrite the cash flow, not the appreciation.
- At projected returns (-3.0% appreciation + 3.0% rent growth), your $16k cash investment doubles in ~4 years — after that, you're playing with house money.
Negotiation context
- Only 2 days on market — expect competitive offers; lowballing is unlikely to land.
Risks & watch-outs
- Watch-outs: built in 1900 — expect roof / HVAC / electrical / plumbing capex.
- Climate carrying-cost: extreme-heat days projected 7→19/yr by 2055 (HVAC capex compounding) — expect insurance premiums to compound above CPI over the hold.
Questions for the listing agent
- Built in 1900 — when were the roof, HVAC, electrical panel, plumbing, and water heater last replaced?
- Is there a deadline driving the sale (1031 exchange, divorce, estate, relocation)? That informs how much negotiation room exists.
- Schools are D-rated, which usually means shorter tenancies and higher turnover. Who's the typical renter profile here, and what's been the actual vacancy rate?
- What's the average days-on-market for RENTAL listings here right now (not sales)? A rising rental-DOM trend means longer vacancies and softer asking-rent achievability than the comps imply.
- What's the recent tenant-quality profile in this submarket — average credit score on applications, eviction rate, late-payment / NSF rate, and stable-employment percentage? A property-management company in the area should have these aggregated.
- How much new for-sale + rental construction is in the pipeline within 1–3 miles? Heavy new supply typically softens prices + rents 12–24 months out; constrained supply supports both.
Investment metrics
- 1% rule
- 1.84% ✓
- Cap rate
- 15.73%
- Cash-on-cash
- 33.72%
- DSCR
- 2.50
- GRM
- 4.5
CMA / ARV
- ARV (on-the-fly)
- $135,546
- Comps found
- 12
Show comp detail 12 sales within ~0.75 mi
| Address | Dist | Beds/Ba | Sqft | Sold | Price | $/sf | Match |
|---|---|---|---|---|---|---|---|
| 906 E State St | 0.00mi | 2/1.0 | 1,102 (0%) | 0mo | $60,000 | $54 | 100 |
| 829 E State St | 0.06mi | 2/1.0 | 1,219 (+11%) | 6mo | $70,382 | $58 | 74 |
| 508 N Race St | 0.45mi | 2/1.0 | 1,052 (-4%) | 5mo | $15,000 | $14 | 67 |
| 306 Harding Ave | 0.59mi | 3/1.0 (+1) | 1,107 (+0%) | 4mo | $167,700 | $151 | 63 |
| 417 E Walnut St | 0.47mi | 3/2.0 (+1) | 1,080 (-2%) | 4mo | $190,000 | $176 | 62 |
| 820 S Stormont St | 0.67mi | 2/1.0 | 1,045 (-5%) | 2mo | $113,000 | $108 | 59 |
| 318 N Seminary St | 0.47mi | 3/1.0 (+1) | 1,198 (+9%) | 4mo | $132,000 | $110 | 56 |
| 208 S Race St | 0.42mi | 3/1.0 (+1) | 1,231 (+12%) | 6mo | $131,500 | $107 | 51 |
| 601 S Gibson St | 0.70mi | 3/2.0 (+1) | 1,136 (+3%) | 6mo | $159,900 | $141 | 48 |
| 209 S Gibson St | 0.57mi | 2/2.0 | 1,224 (+11%) | 6mo | $150,500 | $123 | 46 |
| 709 S Race St | 0.66mi | 2/2.0 | 1,216 (+10%) | 4mo | $164,900 | $136 | 45 |
| 805 S Stormont St | 0.67mi | 2/2.0 | 968 (-12%) | 0mo | $131,000 | $135 | 44 |
Match score weights: distance 35% · size 25% · config 20% · recency 20%. Top-matched comps best support the ARV.
Projected returns pro-forma
-3.0% appreciation · 3.0% rent growth · sell at horizon
- IRR
- 29.0%
- Equity multiple
- 2.21×
- Total profit
- $19,840
- Equity at exit
- $8,723
- IRR
- 36.4%
- Equity multiple
- 4.36×
- Total profit
- $55,049
- Equity at exit
- $5,058
Cash invested: $16,380 (down + closing). Projections, not guarantees.
Landlord ↔ Tenant lean methodology
- Overall (STATE)
- 90 Strongly Landlord-Friendly
- State Indiana
- 90 Strongly Landlord-Friendly · R+11
- County
- — inherits STATE
- City
- — inherits STATE
ZIP-level market 47670
- Home prices YoY
- -32.2%
- Active inventory
- 138
- Price-to-rent
- 4.5×
Monthly cashflow live
- Estimated rent
- $1,075 medium interval (Pro) →
- Mortgage (P&I)
- −$307
- Tax from tax record
- −$58 /mo · $698/yr
- Insurance
- −$24
- HOA
- −$0
- Vacancy / Maint / Mgmt
- −$226
- Net cashflow
- $460
Break-even live
UW: 25.0% down · 7.5% · 30yr · 1.5% tax · 5.0% vac · 8.0% maint · 8.0% mgmt
Financing live
Cash to close
- Down payment
- $14,625
- Closing costs
- $1,755
- Reserves months
- —
- Total cash needed
- —
Loan-product check · same deal, 3 products live
Conventional
25% down · 7.5% · 30yr
- Down + closing
- —
- Monthly P&I
- —
- Monthly cashflow
- —
- DSCR
- —
- Eligible?
- —
Personal DTI + credit; lowest rate.
DSCR
20% down · 8.5% · 30yr
- Down + closing
- —
- Monthly P&I
- —
- Monthly cashflow
- —
- DSCR
- —
- Eligible?
- —
No personal income docs; deal must DSCR.
Hard money
10% down · 12.0% · 12mo
- Down + closing
- —
- Monthly P&I
- —
- Monthly cashflow
- —
- DSCR
- —
- Eligible?
- —
Short-term bridge; refi at stabilization.
Rent comps 3 comps
| Address | Beds | Baths | Sqft | Rent | $/sqft | DOM | Units | Dist |
|---|---|---|---|---|---|---|---|---|
| 102 N Seminary St Princeton, IN | 2.0 | 1.0 | 884 | $995 | $1.13 | 44d | 1 | 0.46mi |
| 318 S Gibson St Unit A Princeton, IN | 1.0 | 1.0 | 750 | $795 | $1.06 | 44d | 1 | 0.59mi |
| 220 W Garfield Ave Princeton, IN | 2.0 | 1.0 | 1000 | $1,700 | $1.70 | 44d | 2 | 1.22mi |
Listing history 2 events
-
2026-05-29status Pending
-
2026-05-27$58,500 Active
ⓘ Source: listings_history table (triggers on properties + properties_extension) + one-shot
backfill from property_details.listing_events for pre-trigger history.
Tax reassessment forecast IN · Partial reset (capped growth)
- Current annual tax
- $698 · $58/mo
- Projected year-2 tax
- $698 · $58/mo
- Expected delta
- $0/yr ($0/mo · 0.0%)
ⓘ Screening estimate from a state-policy table — verify with the county assessor before closing.
Climate risk First Street
- Flood 1/10 Low FEMA zone X (unshaded) · 0% chance over 30 yrs
- Wildfire 1/10 Low
- Heat 5/10 Major 7 d/yr ≥107°F today · 19 d/yr by 30 yrs out
- Wind 2/10 Low 4% chance of damaging wind over 30 yrs
- Air quality 3/10 Moderate 2 unhealthy d/yr today · 3 by 30 yrs out
Nearby sold comps map
Loading sold comps map…
Walkable amenities ~0.75 mi
Loading nearby amenities…
Taxation est. · year 1
- Rental income
- $12,904
- − Mortgage interest
- −$3,277
- − Property taxes
- −$698
- − Insurance
- −$292
- − Repairs & maintenance
- −$1,032
- − Management
- −$1,032
- − Depreciation
- −$1,702
- Taxable income
- $4,871
- Est. tax owed @ 24.0%
- −$1,169
- After-tax cash flow
- $4,354/yr
For passive investors: Depreciation is non-cash, so a rental often shows a tax loss while cash-flowing — sheltering income. Rental losses are passive: they offset passive income freely, and up to $25,000/yr can offset ordinary (W-2) income if you actively participate and your MAGI is under $100k (phasing out to $0 by $150k); unused losses carry forward. On sale, claimed depreciation is recaptured at up to 25%, and gains may owe capital-gains tax (a 1031 exchange can defer both). Figures are a year-1 estimate at your 24.0% rate — not tax advice; consult a CPA.
Schools (NCES district)
- District
- North Gibson School Corporation
- NCES district ID
- 1807770
- Math proficiency
- 28% ▼ -10.00%
- Reading proficiency
- 36% ▼ -4.00%
- Median HH income
- $44,595
- Composite
- 27.32/100
- National rank
- #6992
- State rank
- #223 of 301 in IN
Livability — Princeton
- Score
- 71/100
- State rank
- #131
- US rank
- #6840
Category grades
Schools grade is shown separately in the Schools card above.
Census & demographics
- Census place
- Princeton, IN
- Population (ZIP)
- 11,638
Population outlook (Gibson County) Hauer SSP2
- Today (2025)
- 33,671 people
- By 2030
- 33,409 · -0.8%
- By 2040
- 32,364 · -3.9%
- By 2050
- 30,453 · -9.6%
- By 2075
- 24,610 · -26.9%
- By 2100
- 16,217 · -51.8%
Race, ethnicity, and origin ACS 2023
- Neighborhood character
- Predominantly White (85%)
- Race & ethnicity
- White 85% Black 5% Hispanic / Latino 4% Two or more races 4%
- Common ancestry
- Lithuanian 2% Slovak 2% Serbian 1%
- Foreign-born
- 3% · Canada
- Languages at home
- 95% English-only · Spanish 3% Other Asian/Pacific 1%
Political lean MEDSL · Gibson
- 2024 margin
- Solid R (+51.4) · D 23.4% · R 74.8% · Other 1.8%
- 2008→2024 swing
- -38.2pp toward R · 2008: -13.2pp · 2024: -51.4pp
- All cycles
- 2024: R+51.4 2020: R+48.2 2016: R+47.6 2012: R+31.0 2008: R+13.2
Not yet ingested
- Civics
- —
Market trends
- HPI YoY
- ▼ -104.47%
- Current HPI
- 219.932
- Rent YoY
- —
- Metro
- —
- State GDP YoY
- ▲ 2.90%
- F500 in state
- 18
Industry mix (Fortune 500 HQ in IN)
| Industry | F500 HQs | Revenue |
|---|---|---|
| Industrial Machinery | 2 | $37B |
|
||
| Healthcare | 1 | $177B |
|
||
| Pharmaceuticals | 1 | $45B |
|
||
| Metals / Steel | 1 | $18B |
|
||
| Agriculture | 1 | $17B |
|
||
| Packaging | 1 | $12B |
|
||
Price history
2 events — show timeline
- 2026-05-29 Pending — IRMLS
- 2026-05-27 Listed $58,500 IRMLS
Property tax history
+9.7%/yrLatest (2024): $698 · +3.0% YoY. Source: county tax records.
Cash-flow waterfall
monthlySold comps — $/sqft
last 12 mo · ≤1 miLoading sold comps…