 Duplex
100/102 Howard Ln · Oak Ridge, TN
Flood risk 1/10 · Minimal
- FEMA flood zone
- X (unshaded)
- Chance of flooding over 30 yrs
- 0.0%
- Est. flood insurance / yr
- $507 – $1,088
Fire risk 3/10 · Minor
- Est. fire insurance / yr
- $949 – $1,763
Heat risk 5/10 · Moderate
- Hot days now (above 103°F)
- 7 days/yr
- Hot days in 30 yrs
- 19 days/yr
Wind risk 2/10 · Minimal
- Chance of severe wind over 30 yrs
- 1.0%
Air-quality risk 4/10 · Minor
- Unhealthy air days now
- 4 days/yr
- Unhealthy air days in 30 yrs
- 4 days/yr
Risk factors via First Street. Map © Google.
Why this score? — see what drove the C grade
The composite is a weighted blend of 9 inputs, each scored 0–100. Each bar is that input's sub-score; the figure is the points it added to the 100-point composite (weight × sub-score).
- Cash flow +24.4/30.0
- DSCR +7.9/10.0
- ARV discount +7.5/15.0
- 1% rule +5.0/10.0
- Livability +3.9/5.0
- Rent growth +3.3/5.0
- Schools +3.1/10.0
- Condition / age +2.5/5.0
- Appreciation +0.0/10.0
$280,000
🖨 Deal sheet 📄 Offer letter ✓ Due diligence
Multi-family units
County records classify this as Multi-Family (2-4 Unit). Listing-text estimate: 2 units. confirmed
Listing remarks
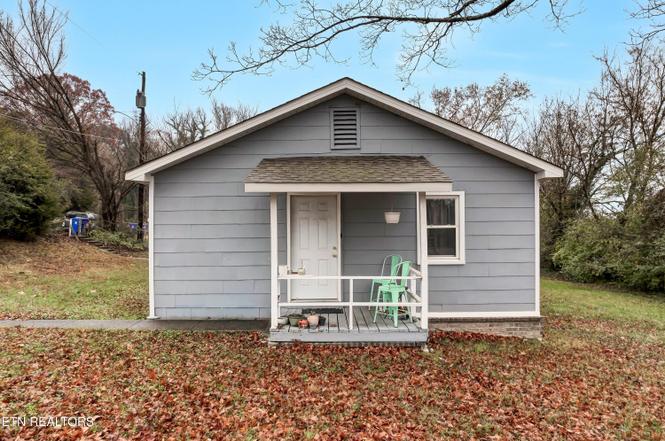
Turn-key investment opportunity in the heart of Oak Ridge! This fully occupied duplex is a proven income producer, featuring two spacious 2-bedroom, 1-bathroom units. Each side is equipped with individual laundry hookups and sits on a generous lot offering ample outdoor space for tenants. With a combined monthly rental income of $1,325 and a history of consistent occupancy, this property is a 'set-and-forget' addition to any portfolio.
Key facts
- Washer and dryer
- Desirable location
- Yard space
Tags
Property features AI
Exterior
- Parking: On-street parking
- Utilities: Central electric heating; Central cooling
- Home design: Multifamily property with 2 total units; Address: 100/102 Howard Ln, Oak Ridge, TN
- Construction: Frame construction with brick and vinyl siding
- Exterior features: Vinyl siding; Brick exterior; Frame construction
Interior
- Kitchen: Microwave; Refrigerator
- Bedrooms: Two 2-bedroom units (total 2 units with 2 beds each)
- Flooring: Laminate; Hardwood; Carpet; Tile
- Heating & cooling: Central heating (electric); Central cooling
- Interior features: Washer and dryer included; Microwave; Refrigerator
- Laundry & utility: Washer; Dryer
Neighborhood map
What this means for you Summary
Snapshot
- This is a 2 × 2-bed/1.0-bath units multifamily listed at $280k.
Deal economics
- At list price, monthly cash flow is $567 ($7k/yr) — positive. Per door: $283/mo.
- The deal already cash-flows at list — no discount required.
- To meet the 1% rule (rent ≥ 1% of price), the offer needs to be $280k (0.1% below list).
- Recommended offer: $246k (12.0% below list) — sets the bar for market timing.
- Cap rate 8.7% vs local median 3.4% in Oak Ridge — top-decile yield for the area; either an underpriced asset or a hidden risk that comps aren't pricing in. Stress-test before assuming the spread holds.
Location & tenants
- Location reads 78/100 on livability (#4 in TN, #2,605 nationally) — a middle-class / working-renter tenant base. Strengths: amenities A+, cost of living A+, housing A+; Watch: commute F.
- Oak Ridge (suburban): math 34% / reading 37% proficiency, ranked #23 of 139 in TN (top 16%) — families likely to look elsewhere, expect single-tenant / working-renter base with shorter leases.
- Zoned schools: Willow Brook Elementary (math 27% / reading 22%, grade F, #546 of 952 statewide, top 61%, 391 students, 0% FRL); Robertsville Middle School (math 32% / reading 31%, grade F, #89 of 333 statewide, top 28%, 702 students, 0% FRL); Oak Ridge High School (math 10% / reading 53%, grade F, #69 of 332 statewide, top 21%, 1,587 students, 0% FRL) — zoned schools average 0% FRL vs 40% district-wide (40 pts lower); this property's tenant base skews higher-income than the district average.
- Market conditions: Rents rising (+3.1%/yr); 189 active listings in the ZIP; 8 comparable units currently listed for rent nearby; rentals leasing fast (median 3d on market — plan ~1-2 weeks tenant-placement turnaround); 400 units permitted in Anderson County in 2024 (91 in 5+ unit buildings).
- At $2,796/mo this rent would consume 46% of the median local household income ($72k/yr) (locally 914% of renters already pay >50% of income on rent) — very limited rent-growth headroom before tenants either downsize or default.
Forward outlook
- Local home prices are declining (-3.0%/yr); year-one equity from $2k of loan paydown is wiped out by about $8k of value loss. Plan a longer hold.
Negotiation context
- It's been on market 254 days — a 12% lower offer ($246k) is reasonable based on typical stale-listing flexibility.
- 2 sale attempts since 2y ago; this cycle's ask has dropped $19k (6%) from the opening price — seller is motivated, your offer sets the floor, not the list.
Risks & watch-outs
- Watch-outs: built in 1943 — expect roof / HVAC / electrical / plumbing capex.
- Climate carrying-cost: extreme-heat days projected 7→19/yr by 2055 (HVAC capex compounding) — expect insurance premiums to compound above CPI over the hold.
Questions for the listing agent
- It's been on market 254 days. Have you received any prior offers? Is the seller open to a 12% concession, seller financing, or rate buy-down credit?
- Can we see the unit-by-unit rent roll, current vacancy, and any below-market leases? What's the average tenancy length?
- What capital expenditures (roof, boiler, parking lot, exteriors) have been made in the last 5 years, and what's planned in the next 2?
- Built in 1943 — when were the roof, HVAC, electrical panel, plumbing, and water heater last replaced?
- Why hasn't it sold? Are there any deal-killer items the seller is aware of (foundation, flood, title, zoning, code violations)?
- Is there a deadline driving the sale (1031 exchange, divorce, estate, relocation)? That informs how much negotiation room exists.
- What's the average days-on-market for RENTAL listings here right now (not sales)? A rising rental-DOM trend means longer vacancies and softer asking-rent achievability than the comps imply.
- What's the recent tenant-quality profile in this submarket — average credit score on applications, eviction rate, late-payment / NSF rate, and stable-employment percentage? A property-management company in the area should have these aggregated.
- How much new apartment / multifamily construction is in the pipeline within 1–3 miles? Heavy new supply (>2% of stock underway) typically softens rents 12–24 months out; light construction supports rent growth.
Investment metrics
- 1% rule
- 1.00% ✗
- Cap rate
- 8.72%
- Cash-on-cash
- 8.67%
- DSCR
- 1.39
- GRM
- 8.3
CMA / ARV
No comps found within radius.
Projected returns pro-forma
-3.0% appreciation · 3.11% rent growth · sell at horizon
- IRR
- -3.1%
- Equity multiple
- 0.88×
- Total profit
- $-9,109
- Equity at exit
- $41,749
- IRR
- 6.7%
- Equity multiple
- 1.50×
- Total profit
- $39,255
- Equity at exit
- $24,209
Cash invested: $78,400 (down + closing). Projections, not guarantees.
Landlord ↔ Tenant lean methodology
- Overall (STATE)
- 87 Strongly Landlord-Friendly
- State Tennessee
- 87 Strongly Landlord-Friendly · R+13
- County
- — inherits STATE
- City
- — inherits STATE
ZIP-level market 37830
- Home prices YoY
- -33.2%
- Rents YoY
- 3.1%
- Active inventory
- 189
- Price-to-rent
- 16.7×
Monthly cashflow live
- Estimated rent
- $2,796 high interval (Pro) →
- Mortgage (P&I)
- −$1,468
- Tax from tax record
- −$57 /mo · $686/yr
- Insurance
- −$117
- HOA
- −$0
- Vacancy / Maint / Mgmt
- −$587
- Net cashflow
- $567
Break-even live
2-unit breakdown (identical units grouped — click to expand)
| Units | Beds | Baths | Est. rent |
|---|---|---|---|
| 2× units | 2 | 1 | $2,796 |
| #1 | 2 | 1 | $1,398 |
| #2 | 2 | 1 | $1,398 |
| Total (2 units) | $2,796 | ||
UW: 25.0% down · 7.5% · 30yr · 1.5% tax · 5.0% vac · 8.0% maint · 8.0% mgmt
Financing live
Cash to close
- Down payment
- $70,000
- Closing costs
- $8,400
- Reserves months
- —
- Total cash needed
- —
Loan-product check · same deal, 3 products live
Conventional
25% down · 7.5% · 30yr
- Down + closing
- —
- Monthly P&I
- —
- Monthly cashflow
- —
- DSCR
- —
- Eligible?
- —
Personal DTI + credit; lowest rate.
DSCR
20% down · 8.5% · 30yr
- Down + closing
- —
- Monthly P&I
- —
- Monthly cashflow
- —
- DSCR
- —
- Eligible?
- —
No personal income docs; deal must DSCR.
Hard money
10% down · 12.0% · 12mo
- Down + closing
- —
- Monthly P&I
- —
- Monthly cashflow
- —
- DSCR
- —
- Eligible?
- —
Short-term bridge; refi at stabilization.
Rent comps 8 comps
| Address | Beds | Baths | Sqft | Rent | $/sqft | DOM | Units | Dist |
|---|---|---|---|---|---|---|---|---|
| 219 Highland Ave Unit 1 Oak Ridge, TN | 3.0 | 1.0 | 950 | $1,595 | $1.68 | 2d | 1 | 0.07mi |
| 102 Wainwright Rd Oak Ridge, TN | 3.0 | 1.5 | 1250 | $1,295 | $1.04 | 2d | 1 | 0.39mi |
| 113 Wakeman Ln Oak Ridge, TN | 3.0 | 1.0 | 1100 | $1,550 | $1.41 | 2d | 1 | 0.45mi |
| 156 N Illinois Ave Oak Ridge, TN | 3.0 | 2.0 | 1326 | $1,695 | $1.28 | 2d | 1 | 0.46mi |
| 289 Royce Cir Oak Ridge, TN | 2.0–3.0 | 2.0 | 1063 | $1,516 | $1.43 | 2d | 3 | 0.93mi |
| 141 Northwestern Ave Oak Ridge, TN | 3.0 | 2.0 | 1414 | $2,200 | $1.56 | 14d | 1 | 1.27mi |
| 101 E Magnolia Ln Oak Ridge, TN | 3.0 | 1.0 | 1395 | $2,000 | $1.43 | 23d | 1 | 1.39mi |
| 500 Tuskegee Dr Oak Ridge, TN | 1.0–3.0 | 1.0–2.0 | 950 | $1,105 | $1.16 | 2d | 1 | 1.41mi |
Listing history 23 events
-
2026-06-18days on market $280,000 Active 254 DOM
-
2026-06-17days on market $280,000 Active 253 DOM
-
2026-06-16days on market $280,000 Active 252 DOM
-
2026-06-15days on market $280,000 Active 251 DOM
-
2026-06-14days on market $280,000 Active 249 DOM
-
2026-06-10days on market $280,000 Active 246 DOM
-
2026-06-09days on market $280,000 Active 245 DOM
-
2026-06-08days on market $280,000 Active 244 DOM
-
2026-06-07days on market $280,000 Active 243 DOM
-
2026-06-03days on market $280,000 Active 239 DOM
-
2026-06-02days on market $280,000 Active 238 DOM
-
2026-06-01days on market $280,000 Active 237 DOM
-
2026-05-31days on market $280,000 Active 236 DOM
-
2026-05-31days on market $280,000 Active 235 DOM
-
2026-04-16price $280,000
-
2026-02-10price $284,000
-
2026-01-27price $289,000
-
2026-01-14price $294,000
-
2026-01-07price $297,000
-
2025-10-07$299,000 Active
-
2025-06-11historical
-
2025-01-22price $323,000
-
2024-12-10$325,000 Active
ⓘ Source: listings_history table (triggers on properties + properties_extension) + one-shot
backfill from property_details.listing_events for pre-trigger history.
Tax reassessment forecast TN · Resets to sale price
- Current annual tax
- $686 · $57/mo
- Projected year-2 tax
- $1,988 · $166/mo
- Expected delta
- +$1,302/yr (+$109/mo · 189.8%)
ⓘ Screening estimate from a state-policy table — verify with the county assessor before closing.
Climate risk First Street
- Flood 1/10 Low FEMA zone X (unshaded) · 0% chance over 30 yrs
- Wildfire 3/10 Moderate
- Heat 5/10 Major 7 d/yr ≥103°F today · 19 d/yr by 30 yrs out
- Wind 2/10 Low 100% chance of damaging wind over 30 yrs
- Air quality 4/10 Moderate 4 unhealthy d/yr today · 4 by 30 yrs out
Nearby sold comps map
Loading sold comps map…
Walkable amenities ~0.75 mi
Loading nearby amenities…
Taxation est. · year 1
- Rental income
- $33,552
- − Mortgage interest
- −$15,684
- − Property taxes
- −$686
- − Insurance
- −$1,400
- − Repairs & maintenance
- −$2,684
- − Management
- −$2,684
- − Depreciation
- −$8,145
- Taxable income
- $2,268
- Est. tax owed @ 24.0%
- −$544
- After-tax cash flow
- $6,256/yr
For passive investors: Depreciation is non-cash, so a rental often shows a tax loss while cash-flowing — sheltering income. Rental losses are passive: they offset passive income freely, and up to $25,000/yr can offset ordinary (W-2) income if you actively participate and your MAGI is under $100k (phasing out to $0 by $150k); unused losses carry forward. On sale, claimed depreciation is recaptured at up to 25%, and gains may owe capital-gains tax (a 1031 exchange can defer both). Figures are a year-1 estimate at your 24.0% rate — not tax advice; consult a CPA.
Schools (NCES district)
- District
- Oak Ridge
- NCES district ID
- 4703240
- Math proficiency
- 34% ▼ -3.00%
- Reading proficiency
- 37% ▼ -4.00%
- Median HH income
- $49,949
- Composite
- 30.75/100
- National rank
- #6159
- State rank
- #23 of 139 in TN
Livability — Oak Ridge
- Score
- 78/100
- State rank
- #4
- US rank
- #2605
Category grades
Schools grade is shown separately in the Schools card above.
Census & demographics
- Census place
- Oak Ridge, TN
- County
- Anderson County · 33,038 people
- City population
- 33,038
- Metro
- Knoxville, TN
- Population (ZIP)
- 33,038
- Household income
- $72,269
- Rent vs Own
- Severe rent burden
- 914.0
Population outlook (Anderson County) Hauer SSP2
- Today (2025)
- 76,963 people
- By 2030
- 77,226 · +0.3%
- By 2040
- 76,905 · -0.1%
- By 2050
- 75,405 · -2.0%
- By 2075
- 70,858 · -7.9%
- By 2100
- 60,585 · -21.3%
Race, ethnicity, and origin ACS 2023
- Neighborhood character
- Predominantly White (80%)
- Race & ethnicity
- White 80% Two or more races 7% Hispanic / Latino 6% Black 6% Asian 3%
- Hispanic origin (detail)
- Mexican 4%
- Common ancestry
- Serbian 3% Slovak 3% Italian 3%
- Foreign-born
- 6% · Canada, China, South Korea
- Languages at home
- 91% English-only · Spanish 5% Chinese 1% German/W. Germanic 1%
Political lean MEDSL · Anderson
- 2024 margin
- Solid R (+35.7) · D 31.5% · R 67.3% · Other 1.2%
- 2008→2024 swing
- -9.5pp toward R · 2008: -26.2pp · 2024: -35.7pp
- All cycles
- 2024: R+35.7 2020: R+32.2 2016: R+34.3 2012: R+29.8 2008: R+26.2
Not yet ingested
- Civics
- —
Market trends
- HPI YoY
- ▼ -160.89%
- Current HPI
- 323.0396
- Rent YoY
- ▲ 3.11%
- Metro
- Knoxville, TN
- State GDP YoY
- ▲ 2.78%
- F500 in state
- 22
Industry mix (Fortune 500 HQ in TN)
| Industry | F500 HQs | Revenue |
|---|---|---|
| Healthcare | 3 | $91B |
|
||
| Retail | 3 | $72B |
|
||
| Transportation / Logistics | 1 | $88B |
|
||
| Paper / Packaging | 1 | $19B |
|
||
| Insurance | 1 | $13B |
|
||
| Energy | 1 | $12B |
|
||
Price history
-13.8% since first listed9 events — show timeline
- 2026-04-16 Price Changed $280,000 Knoxville MLS
- 2026-02-10 Price Changed $284,000 Knoxville MLS
- 2026-01-27 Price Changed $289,000 Knoxville MLS
- 2026-01-14 Price Changed $294,000 Knoxville MLS
- 2026-01-07 Price Changed $297,000 Knoxville MLS
- 2025-10-07 Listed $299,000 Knoxville MLS
- 2025-06-11 Listing Removed — Knoxville MLS
- 2025-01-22 Price Changed $323,000 Knoxville MLS
- 2024-12-10 Listed $325,000 Knoxville MLS
Property tax history
-1.3%/yrLatest (2025): $686 · -28.8% YoY. Source: county tax records.
Cash-flow waterfall
monthlySold comps — $/sqft
last 12 mo · ≤1 miLoading sold comps…