 🌊 Lakefront
13050 Island Dr #12 · Clearlake Oaks, CA
Flood risk 7/10 · Major
- FEMA flood zone
- X (unshaded)
- Chance of flooding over 30 yrs
- 0.76%
- Est. flood insurance / yr
- $507 – $1,088
Fire risk 10/10 · Severe
- Est. fire insurance / yr
- $659 – $1,223
Heat risk 5/10 · Moderate
- Hot days now (above 100°F)
- 6 days/yr
- Hot days in 30 yrs
- 11 days/yr
Wind risk 1/10 · Minimal
- Chance of severe wind over 30 yrs
- —
Air-quality risk 10/10 · Severe
- Unhealthy air days now
- 32 days/yr
- Unhealthy air days in 30 yrs
- 34 days/yr
Risk factors via First Street. Map © Google.
Why this score? — see what drove the B grade
The composite is a weighted blend of 9 inputs, each scored 0–100. Each bar is that input's sub-score; the figure is the points it added to the 100-point composite (weight × sub-score).
- Cash flow +30.0/30.0
- ARV discount +15.0/15.0
- 1% rule +10.0/10.0
- DSCR +10.0/10.0
- Livability +3.0/5.0
- Rent growth +2.5/5.0
- Condition / age +2.5/5.0
- Schools +1.2/10.0
- Appreciation +0.0/10.0
$65,000
🖨 Deal sheet (PDF) 📄 Offer letter ✓ Due diligence
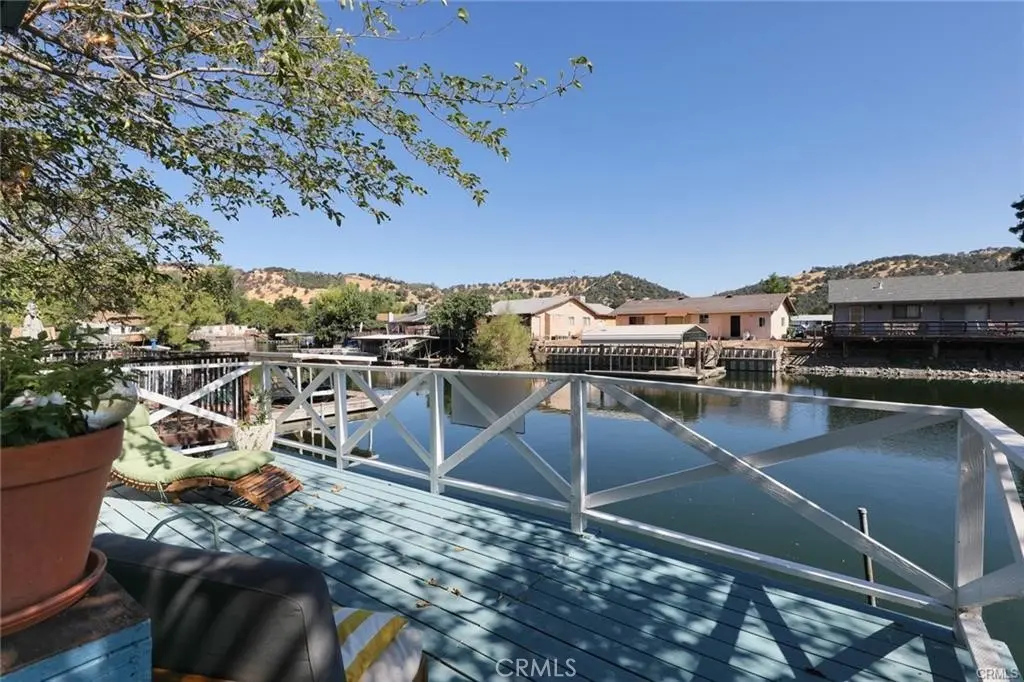
Listing remarks
Welcome to your personal paradise on a quiet channel in Clearlake Oaks! This charming 2-bedroom, 1-bathroom home is nestled in the beautiful, well-kept Oasis MHP. The gated, all-ages park provides a private boat launch for all residents. Enjoy the peace and tranquility alongside the stunning lake and mountain views. As you step inside the recently remodeled home, you are greeted by updated bamboo flooring that flows seamlessly throughout the open and inviting living spaces. This lakeside getaway features a spacious deck that extends over the water's edge, perfect for sipping your morning coffee, enjoying evening gatherings with friends and family watching wildlife or fishing right off your
Key facts
- Central heating
- Spacious deck
- Built 2000
Tags
Property features AI
Finance
- Other: Pets allowed with breed restrictions
- Financial info: Assessments: Unknown
- HOA & community: Land lease of $500 monthly (land lease applies); Park name: Oasis
Exterior
- Parking: Assigned parking; Driveway parking; Deck (used for parking listed)
- Security: Automatic gate
- Utilities: Public sewer; District/public water; Propane available; Electricity available and connected; Water connected; Sewer connected; Telephone in street; Cable available
- Home design: Mobile home remains on site (mobile width 12', length 60'); Single-story; Orientation with front door entry
- Construction: Year built source: builder
- Exterior features: No pool; Lot has lake rights; Marina in community; Lot on channel/canal front; Fishing in community; Community offers watersports, hiking, rural and mountainous settings, BLM/National Forest access, lake recreation, and hunting
Interior
- Kitchen: Propane oven; Dishwasher
- Bedrooms: Single-story home (1 total story)
- Flooring: Bamboo flooring
- Bathrooms: 1 full bathroom
- Heating & cooling: Central furnace heating; Wall/window cooling
- Interior features: Front door entry; Automatic gate; Remodeled kitchen; Walk-in shower; Has view
- Laundry & utility: Washer included; Has laundry
Neighborhood map
What this means for you Summary
Snapshot
- This is a 2-bed/1.0-bath land listed at $65k.
Deal economics
- At list price, monthly cash flow is $747 ($9k/yr) — positive.
- The deal already cash-flows at list — no discount required.
- Meets the 1% rule at list price ($2k rent vs $65k).
- Recommended offer: $63k (3.0% below list) — sets the bar for market timing.
- Cap rate 21.3% vs local median 4.3% in Clearlake Oaks — top-decile yield for the area; either an underpriced asset or a hidden risk that comps aren't pricing in. Stress-test before assuming the spread holds.
Location & tenants
- Location reads 60/100 on livability (#569 in CA) — a middle-class / working-renter tenant base. Strengths: housing A+, crime B; Watch: health & safety C-, amenities F, commute F.
- Konocti Unified (town): math 9% / reading 21% proficiency, ranked #494 of 517 in CA (top 96%) — low school quality limits family demand, transient renter base, plan for 1-2y turnover; 77% free/reduced lunch — lower-income household profile, screen leases tightly.
- Zoned schools: East Lake (math 2% / reading 12%, grade F, #1,555 of 1,571 statewide, top 99%, 244 students, 88% FRL); Highlands Academy (reading 24%, 12 students, 92% FRL); Lower Lake High (math 4% / reading 28%, grade F, #1,034 of 1,170 statewide, top 88%, 1,057 students, 79% FRL).
- Market conditions: 150 active listings in the ZIP; 107 units permitted in Lake County in 2024 (40 in 5+ unit buildings).
Forward outlook
- Local home prices are declining (-3.0%/yr); year-one equity from $449 of loan paydown is wiped out by about $2k of value loss. Plan a longer hold.
- Lake County population projected at -15% by 2050 — secular population decline; favor cash flow + early exit over multi-decade hold.
- At projected returns (-3.0% appreciation + 3.0% rent growth), your $18k cash investment doubles in ~3 years — after that, you're playing with house money.
Negotiation context
- It's been on market 39 days — a 3% lower offer ($63k) is reasonable based on typical stale-listing flexibility.
- 15 sale attempts since 9y ago with the ask held roughly flat each time — persistent listings suggest the price (not the market) is what's stuck; bring a comps-based counter.
- Current owner paid $25k; list at $65k implies a 160% gain — meaningful room to come down on a strong offer.
Risks & watch-outs
- Watch-outs: flood insurance adds $66/mo.
- Climate carrying-cost: major flood risk; severe wildfire risk; extreme-heat days projected 6→11/yr by 2055 (HVAC capex compounding) — expect insurance premiums to compound above CPI over the hold.
Questions for the listing agent
- It's been on market 39 days. Have you received any prior offers? Is the seller open to a 3% concession, seller financing, or rate buy-down credit?
- What's the actual annual flood-insurance premium (NFIP or private), and is the property in a SFHA with mandatory coverage?
- Is there a deadline driving the sale (1031 exchange, divorce, estate, relocation)? That informs how much negotiation room exists.
- Schools are F-rated, which usually means shorter tenancies and higher turnover. Who's the typical renter profile here, and what's been the actual vacancy rate?
- This sits on a lake — are riparian / water-frontage rights deeded with the parcel? Any dock permits, shoreline easements, or HOA water-use restrictions?
- What's the documented flood / surge / shoreline-erosion history here (FEMA AND non-FEMA — e.g., storm surge, creek backup, septic-field saturation)?
- Any water-quality or seasonal algae-bloom issues that affect tenant satisfaction or short-term-rental demand?
- What's the average days-on-market for RENTAL listings here right now (not sales)? A rising rental-DOM trend means longer vacancies and softer asking-rent achievability than the comps imply.
- What's the recent tenant-quality profile in this submarket — average credit score on applications, eviction rate, late-payment / NSF rate, and stable-employment percentage? A property-management company in the area should have these aggregated.
- How much new for-sale + rental construction is in the pipeline within 1–3 miles? Heavy new supply typically softens prices + rents 12–24 months out; constrained supply supports both.
Investment metrics
- 1% rule
- 2.35% ✓
- Cap rate
- 21.31%
- Cash-on-cash
- 53.62%
- DSCR
- 3.39
- GRM
- 3.5
CMA / ARV
- ARV (median comp)
- $123,088
- List price
- $65,000
- Delta
- -47.19%
- Verdict
- UNDERPRICED
- Comps
- 7 within 1.0 mi
Projected returns pro-forma
-3.0% appreciation · 3.0% rent growth · sell at horizon
- IRR
- 46.9%
- Equity multiple
- 3.04×
- Total profit
- $37,058
- Equity at exit
- $9,692
- IRR
- 52.6%
- Equity multiple
- 6.14×
- Total profit
- $93,631
- Equity at exit
- $5,620
Cash invested: $18,200 (down + closing). Projections, not guarantees.
Landlord ↔ Tenant lean methodology
- Overall (STATE)
- 18 Strongly Tenant-Friendly
- State California
- 18 Strongly Tenant-Friendly · D+13
- County
- — inherits STATE
- City
- — inherits STATE
ZIP-level market 95453
- Active inventory
- 150
- Price-to-rent
- 3.5×
Monthly cashflow live
- Estimated rent
- $1,526 medium interval (Pro) →
- Mortgage (P&I)
- −$341
- Tax from tax record
- −$25 /mo · $296/yr
- Insurance
- −$27
- Flood insurance flood zone
- −$66 /mo · $798/yr
- HOA
- −$0
- Vacancy / Maint / Mgmt
- −$321
- Net cashflow
- $747
Break-even live
Sensitivity live
| Price | -10% $784 | -5% $765 | +0% $747 | +5% $728 | +10% $710 |
|---|---|---|---|---|---|
| Rent | -10% $626 | -5% $686 | +0% $747 | +5% $807 | +10% $867 |
| Rate | -1.0pp $779 | -0.5pp $763 | base $747 | +0.5pp $730 | +1.0pp $713 |
UW: 25.0% down · 7.5% · 30yr · 1.5% tax · 5.0% vac · 8.0% maint · 8.0% mgmt
Financing live
Cash to close
- Down payment
- $16,250
- Closing costs
- $1,950
- Reserves months
- —
- Total cash needed
- —
Loan-product check · same deal, 3 products live
Conventional
25% down · 7.5% · 30yr
- Down + closing
- —
- Monthly P&I
- —
- Monthly cashflow
- —
- DSCR
- —
- Eligible?
- —
Personal DTI + credit; lowest rate.
DSCR
20% down · 8.5% · 30yr
- Down + closing
- —
- Monthly P&I
- —
- Monthly cashflow
- —
- DSCR
- —
- Eligible?
- —
No personal income docs; deal must DSCR.
Hard money
10% down · 12.0% · 12mo
- Down + closing
- —
- Monthly P&I
- —
- Monthly cashflow
- —
- DSCR
- —
- Eligible?
- —
Short-term bridge; refi at stabilization.
Listing history 50 events
-
2026-06-21days on market $65,000 Active 39 DOM
-
2026-06-19days on market $65,000 Active 37 DOM
-
2026-06-18days on market $65,000 Active 36 DOM
-
2026-06-17days on market $65,000 Active 35 DOM
-
2026-06-16days on market $65,000 Active 34 DOM
-
2026-06-15days on market $65,000 Active 33 DOM
-
2026-06-14days on market $65,000 Active 31 DOM
-
2026-06-13days on market $65,000 Active 30 DOM
-
2026-06-10days on market $65,000 Active 28 DOM
-
2026-06-09days on market $65,000 Active 27 DOM
-
2026-06-08days on market $65,000 Active 26 DOM
-
2026-06-07days on market $65,000 Active 25 DOM
-
2026-06-05days on market $65,000 Active 22 DOM
-
2026-06-02days on market $65,000 Active 20 DOM
-
2026-06-01days on market $65,000 Active 19 DOM
-
2026-05-31days on market $65,000 Active 18 DOM
-
2026-05-30days on market $65,000 Active 17 DOM
-
2026-05-13$65,000 Active 972-char remark
-
2026-04-22status Active
-
2026-03-31historical
-
2026-02-10status Active Under Contract
-
2026-02-10price $65,000
-
2026-02-01status Active
-
2026-01-01status Active
-
2025-11-20status Active
-
2025-10-24status Active
-
2025-10-04historical Active Under Contract
-
2025-08-22price $58,000
-
2025-07-24$62,000 Active
-
2025-07-15historical
-
2025-07-10status Active
-
2025-06-07status Pending Sale
-
2025-05-04status Active
-
2025-04-18historical Active Under Contract
-
2025-04-08price $65,000
-
2025-03-05price $75,000
-
2025-02-26$90,000 Active
-
2022-04-07soldstatus $25,000 Closed Sale
-
2022-02-21historical Active Under Contract
-
2021-12-14price $30,000
-
2021-12-03price $40,000
-
2021-10-22price $46,000
-
2021-10-04$50,000 Active
-
2021-09-02Active Under Contract
-
2021-07-09soldstatus $44,000 Closed Sale
-
2021-06-30soldstatus $44,000 Closed Sale
-
2021-06-10status Pending Sale
-
2021-05-25$49,999 Active
-
2017-11-13soldstatus $20,000 Closed Sale
-
2017-08-20status Pending Sale
ⓘ Source: listings_history table (triggers on properties + properties_extension) + one-shot
backfill from property_details.listing_events for pre-trigger history.
Tax reassessment forecast CA · Resets to sale price
- Current annual tax
- $296 · $25/mo
- Projected year-2 tax
- $494 · $41/mo
- Expected delta
- +$198/yr (+$16/mo · 66.7%)
ⓘ Screening estimate from a state-policy table — verify with the county assessor before closing.
Climate risk First Street
- Flood 7/10 Severe FEMA zone X (unshaded) · 76% chance over 30 yrs
- Wildfire 10/10 Extreme
- Heat 5/10 Major 6 d/yr ≥100°F today · 11 d/yr by 30 yrs out
- Wind 1/10 Low
- Air quality 10/10 Extreme 32 unhealthy d/yr today · 34 by 30 yrs out
Nearby sold comps map
Loading sold comps map…
Walkable amenities ~0.75 mi
Loading nearby amenities…
Taxation est. · year 1
- Rental income
- $18,317
- − Mortgage interest
- −$3,641
- − Property taxes
- −$296
- − Insurance
- −$1,122
- − Repairs & maintenance
- −$1,465
- − Management
- −$1,465
- − Depreciation
- −$1,891
- Taxable income
- $8,435
- Est. tax owed @ 24.0%
- −$2,025
- After-tax cash flow
- $6,937/yr
For passive investors: Depreciation is non-cash, so a rental often shows a tax loss while cash-flowing — sheltering income. Rental losses are passive: they offset passive income freely, and up to $25,000/yr can offset ordinary (W-2) income if you actively participate and your MAGI is under $100k (phasing out to $0 by $150k); unused losses carry forward. On sale, claimed depreciation is recaptured at up to 25%, and gains may owe capital-gains tax (a 1031 exchange can defer both). Figures are a year-1 estimate at your 24.0% rate — not tax advice; consult a CPA.
Schools (NCES district)
- District
- Konocti Unified
- NCES district ID
- 0620070
- Math proficiency
- 9% ▼ -5.00%
- Reading proficiency
- 21% ▼ -6.00%
- Median HH income
- $30,026
- Composite
- 11.81/100
- National rank
- #9677
- State rank
- #494 of 517 in CA
Livability — Clearlake Oaks
- Score
- 60/100
- State rank
- #569
- US rank
- #18675
Category grades
Schools grade is shown separately in the Schools card above.
Census & demographics
- Census place
- Clearlake Oaks, CA
- County
- Lake County · 24,333 people
- Metro
- Clearlake, CA
- Population (ZIP)
- 11,741
- Household income
- $71,419
- Rent vs Own
- Severe rent burden
- 250.0
Population outlook (Lake County) Hauer SSP2
- Today (2025)
- 62,396 people
- By 2030
- 60,626 · -2.8%
- By 2040
- 56,453 · -9.5%
- By 2050
- 53,054 · -15.0%
- By 2075
- 47,663 · -23.6%
- By 2100
- 41,804 · -33.0%
Race, ethnicity, and origin ACS 2023
- Neighborhood character
- Predominantly White (74%)
- Race & ethnicity
- White 74% Hispanic / Latino 14% Two or more races 9% Native American 5% Asian 1%
- Hispanic origin (detail)
- Mexican 10%
- Common ancestry
- Italian 3% Slovak 3% Romanian 2%
- Foreign-born
- 6% · Canada
- Languages at home
- 89% English-only · Spanish 9% Other Indo-European 1%
Political lean MEDSL · Lake
- 2024 margin
- Toss-up / Even · D 47.8% · R 49.2% · Other 3.0%
- 2008→2024 swing
- -20.6pp toward R · 2008: 19.3pp · 2024: -1.4pp
- All cycles
- 2024: R+1.4 2020: D+6.3 2016: D+3.7 2012: D+16.5 2008: D+19.3
Not yet ingested
- Civics
- —
Market trends
- HPI YoY
- ▼ -176.01%
- Current HPI
- 155.5391
- Rent YoY
- —
- Metro
- Clearlake, CA
- State GDP YoY
- ▲ 3.21%
- F500 in state
- 116
Industry mix (Fortune 500 HQ in CA)
| Industry | F500 HQs | Revenue |
|---|---|---|
| Technology | 27 | $1,492B |
|
||
| Financial Services | 3 | $174B |
|
||
| Retail | 3 | $44B |
|
||
| Insurance | 3 | $26B |
|
||
| Media / Entertainment | 2 | $115B |
|
||
| Pharmaceuticals / Biotech | 2 | $62B |
|
||
Price history
+225.0% since first listed34 events — show timeline
- 2026-05-13 Listed $65,000 CRMLS
- 2026-04-22 Relisted — CRMLS
- 2026-03-31 Listing Removed — CRMLS
- 2026-02-10 Relisted — CRMLS
- 2026-02-10 Price Changed $65,000 CRMLS
- 2026-02-01 Relisted — CRMLS
- 2026-01-01 Relisted — CRMLS
- 2025-11-20 Relisted — CRMLS
- 2025-10-24 Relisted — CRMLS
- 2025-10-04 Contingent — CRMLS
- 2025-08-22 Price Changed $58,000 CRMLS
- 2025-07-24 Listed $62,000 CRMLS
- 2025-07-15 Listing Removed — CRMLS
- 2025-07-10 Relisted — CRMLS
- 2025-06-07 Pending — CRMLS
- 2025-05-04 Relisted — CRMLS
- 2025-04-18 Contingent — CRMLS
- 2025-04-08 Price Changed $65,000 CRMLS
- 2025-03-05 Price Changed $75,000 CRMLS
- 2025-02-26 Listed $90,000 CRMLS
- 2022-04-07 Sold (MLS) $25,000 CRMLS
- 2022-02-21 Contingent — CRMLS
- 2021-12-14 Price Changed $30,000 CRMLS
- 2021-12-03 Price Changed $40,000 CRMLS
- 2021-10-22 Price Changed $46,000 CRMLS
- 2021-10-04 Listed $50,000 CRMLS
- 2021-09-02 Listed — CRMLS
- 2021-07-09 Sold (MLS) $44,000 CRMLS
- 2021-06-30 Sold (MLS) $44,000 CRMLS
- 2021-06-10 Pending — CRMLS
- 2021-05-25 Listed $49,999 CRMLS
- 2017-11-13 Sold (MLS) $20,000 CRMLS
- 2017-08-20 Pending — CRMLS
- 2017-07-31 Listed $20,000 CRMLS
Property tax history
+4.1%/yrLatest (2025): $296 · -38.9% YoY. Source: county tax records.
Cash-flow waterfall
monthlySold comps — $/sqft
last 12 mo · ≤1 miLoading sold comps…