 Multi-family
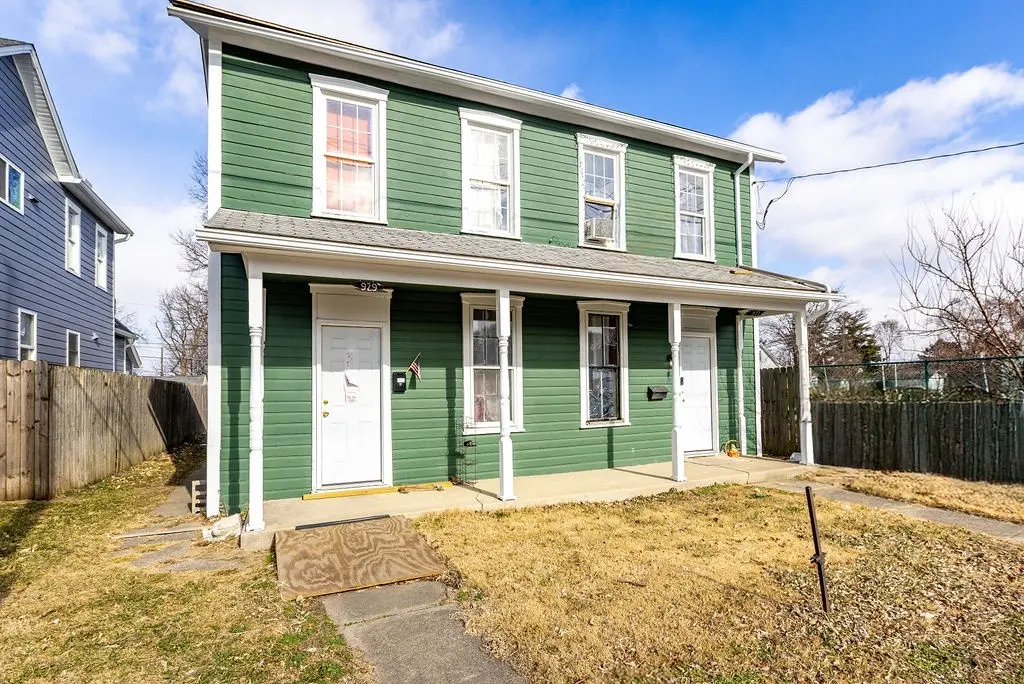
929 Xenia Ave · Dayton, OH
Flood risk 6/10 · Moderate
- FEMA flood zone
- X (unshaded)
- Chance of flooding over 30 yrs
- 0.74%
- Est. flood insurance / yr
- $473 – $860
Fire risk 1/10 · Minimal
- Est. fire insurance / yr
- $713 – $1,323
Heat risk 4/10 · Minor
- Hot days now (above 101°F)
- 7 days/yr
- Hot days in 30 yrs
- 18 days/yr
Wind risk 2/10 · Minimal
- Chance of severe wind over 30 yrs
- 0.0%
Air-quality risk 3/10 · Minor
- Unhealthy air days now
- 2 days/yr
- Unhealthy air days in 30 yrs
- 4 days/yr
Risk factors via First Street. Map © Google.
Why this score? — see what drove the C+ grade
The composite is a weighted blend of 9 inputs, each scored 0–100. Each bar is that input's sub-score; the figure is the points it added to the 100-point composite (weight × sub-score).
- Cash flow +27.9/30.0
- DSCR +9.9/10.0
- ARV discount +8.0/15.0
- 1% rule +6.3/10.0
- Rent growth +5.0/5.0
- Livability +3.2/5.0
- Condition / age +2.5/5.0
- Schools +1.3/10.0
- Appreciation +0.0/10.0
$130,000
🖨 Deal sheet 📄 Offer letter ✓ Due diligence
Multi-family units
County records classify this as Multi-Family (2-4 Unit). Listing-text estimate: 1 unit. estimate disagrees with records
Listing remarks MLS
Duplex close to downtown Dayton. 2 Bedrooms, 1 bath on each side. Large fenced in backyard.
Key facts
- 5,689 sq ft lot
- Built 1882
- Listed 146 days
Neighborhood map
What this means for you Summary
Snapshot
- This is a 4-bed/2.0-bath multifamily listed at $130k.
Deal economics
- At list price, monthly cash flow is $401 ($5k/yr) — positive.
- The deal already cash-flows at list — no discount required.
- Meets the 1% rule at list price ($1k rent vs $130k).
- Recommended offer: $114k (12.0% below list) — sets the bar for market timing.
- Cap rate 10.0% vs local median 7.4% in Dayton — top-decile yield for the area; either an underpriced asset or a hidden risk that comps aren't pricing in. Stress-test before assuming the spread holds.
Location & tenants
- Location reads 65/100 on livability (#716 in OH) — a middle-class / working-renter tenant base. Strengths: cost of living A+, housing A+, health & safety A; Watch: schools C-, amenities C-, crime F.
- Dayton City (urban): math 12% / reading 21% proficiency, ranked #641 of 656 in OH (top 98%) — low school quality limits family demand, transient renter base, plan for 1-2y turnover; 74% free/reduced lunch — lower-income household profile, screen leases tightly.
- Market conditions: Rents rising fast (+11.4%/yr); 92 active listings in the ZIP; 32 comparable units currently listed for rent nearby; rentals at typical pace (median 23d on market — plan ~3-4 weeks tenant-placement turnaround); 41% of comp listings sitting > 30 days — soft ceiling on asking rent; 907 units permitted in Montgomery County in 2024 (416 in 5+ unit buildings).
- This rent runs 38% of the median local income ($47k/yr) — at the standard rent-burdened threshold; future hikes will face affordability resistance.
Forward outlook
- Local home prices are declining (-3.0%/yr); year-one equity from $899 of loan paydown is wiped out by about $4k of value loss. Plan a longer hold.
- Montgomery County population projected at -10% by 2050 — secular population decline; favor cash flow + early exit over multi-decade hold.
- At projected returns (-3.0% appreciation + 8.0% rent growth), your $36k cash investment doubles in ~7 years — after that, you're playing with house money.
Negotiation context
- It's been on market 147 days — a 12% lower offer ($114k) is reasonable based on typical stale-listing flexibility.
- Current owner paid $2k; list at $130k implies a 6400% gain — meaningful room to come down on a strong offer.
Risks & watch-outs
- Watch-outs: built in 1882 — expect roof / HVAC / electrical / plumbing capex.
- Climate carrying-cost: major flood risk — expect insurance premiums to compound above CPI over the hold.
Questions for the listing agent
- It's been on market 147 days. Have you received any prior offers? Is the seller open to a 12% concession, seller financing, or rate buy-down credit?
- Built in 1882 — when were the roof, HVAC, electrical panel, plumbing, and water heater last replaced?
- Why hasn't it sold? Are there any deal-killer items the seller is aware of (foundation, flood, title, zoning, code violations)?
- Is there a deadline driving the sale (1031 exchange, divorce, estate, relocation)? That informs how much negotiation room exists.
- Crime grade is F in this area — have there been break-ins, vandalism, or insurance claims at this property in the last 3 years? What carrier currently insures it and at what premium?
- What's the average days-on-market for RENTAL listings here right now (not sales)? A rising rental-DOM trend means longer vacancies and softer asking-rent achievability than the comps imply.
- What's the recent tenant-quality profile in this submarket — average credit score on applications, eviction rate, late-payment / NSF rate, and stable-employment percentage? A property-management company in the area should have these aggregated.
- How much new apartment / multifamily construction is in the pipeline within 1–3 miles? Heavy new supply (>2% of stock underway) typically softens rents 12–24 months out; light construction supports rent growth.
Investment metrics
- 1% rule
- 1.13% ✓
- Cap rate
- 9.99%
- Cash-on-cash
- 13.21%
- DSCR
- 1.59
- GRM
- 7.3
CMA / ARV
- ARV (median comp)
- $131,531
- List price
- $130,000
- Delta
- -1.16%
- Verdict
- FAIR
- Comps
- 20 within 1.0 mi
Show comp detail 7 sales within ~0.75 mi
| Address | Dist | Beds/Ba | Sqft | Sold | Price | $/sf | Match |
|---|---|---|---|---|---|---|---|
| 424-426 Boltin St | 0.06mi | 5/— (+1) | 1,806 (-1%) | 19mo | $120,000 | $66 | 75 |
| 423 Hulbert St #421 | 0.05mi | 4/2.0 | 2,012 (+10%) | 20mo | $159,900 | $79 | 64 |
| 1609 E 5th St | 0.65mi | 4/2.5 | 1,896 (+4%) | 1mo | $225,000 | $119 | 60 |
| 624-626 Pritz Ave | 0.31mi | 4/2.0 | 1,904 (+4%) | 23mo | $65,000 | $34 | 59 |
| 48 Indiana Ave | 0.51mi | 4/2.0 | 1,924 (+6%) | 11mo | $145,000 | $75 | 58 |
| 1608 Xenia Ave | 0.46mi | 3/2.0 (-1) | 1,564 (-14%) | 10mo | $160,000 | $102 | 41 |
| 132 Kastner Ave | 0.63mi | 4/2.5 | 1,592 (-13%) | 9mo | $90,000 | $57 | 40 |
Match score weights: distance 35% · size 25% · config 20% · recency 20%. Top-matched comps best support the ARV.
Projected returns pro-forma
-3.0% appreciation · 8.0% rent growth · sell at horizon
- IRR
- 8.1%
- Equity multiple
- 1.33×
- Total profit
- $12,187
- Equity at exit
- $19,383
- IRR
- 21.0%
- Equity multiple
- 3.16×
- Total profit
- $78,688
- Equity at exit
- $11,240
Cash invested: $36,400 (down + closing). Projections, not guarantees.
Landlord ↔ Tenant lean methodology
- Overall (STATE)
- 73 Landlord-Friendly
- State Ohio
- 73 Landlord-Friendly · R+6
- County
- — inherits STATE
- City
- — inherits STATE
ZIP-level market 45410
- Home prices YoY
- -21.4%
- Rents YoY
- 11.4%
- Active inventory
- 92
- Price-to-rent
- 7.3×
Monthly cashflow live
- Estimated rent
- $1,474 high interval (Pro) →
- Mortgage (P&I)
- −$682
- Tax from tax record
- −$28 /mo · $334/yr
- Insurance
- −$54
- HOA
- −$0
- Vacancy / Maint / Mgmt
- −$310
- Net cashflow
- $401
Break-even live
UW: 25.0% down · 7.5% · 30yr · 1.5% tax · 5.0% vac · 8.0% maint · 8.0% mgmt
Financing live
Cash to close
- Down payment
- $32,500
- Closing costs
- $3,900
- Reserves months
- —
- Total cash needed
- —
Loan-product check · same deal, 3 products live
Conventional
25% down · 7.5% · 30yr
- Down + closing
- —
- Monthly P&I
- —
- Monthly cashflow
- —
- DSCR
- —
- Eligible?
- —
Personal DTI + credit; lowest rate.
DSCR
20% down · 8.5% · 30yr
- Down + closing
- —
- Monthly P&I
- —
- Monthly cashflow
- —
- DSCR
- —
- Eligible?
- —
No personal income docs; deal must DSCR.
Hard money
10% down · 12.0% · 12mo
- Down + closing
- —
- Monthly P&I
- —
- Monthly cashflow
- —
- DSCR
- —
- Eligible?
- —
Short-term bridge; refi at stabilization.
Rent comps 32 comps
| Address | Beds | Baths | Sqft | Rent | $/sqft | DOM | Units | Dist |
|---|---|---|---|---|---|---|---|---|
| 511 Parrot St Dayton, OH | 3.0 | 1.5 | 1618 | $1,100 | $0.68 | 14d | 1 | 0.09mi |
| 1411 Wyoming St Dayton, OH | 3.0 | 1.0 | 1256 | $1,095 | $0.87 | 2d | 1 | 0.41mi |
| 438 Clover St Dayton, OH | 3.0 | 2.0 | 2156 | $1,025 | $0.48 | 43d | 1 | 0.41mi |
| 1515 Wyoming St Dayton, OH | 3.0 | 1.0 | 1400 | $1,000 | $0.71 | 43d | 1 | 0.44mi |
| 1038 Walnut Hill Pl Dayton, OH | 3.0 | 1.0 | 1232 | $1,095 | $0.89 | 43d | 1 | 0.55mi |
| 20 Lucerne Ave Dayton, OH | 3.0 | 1.0 | 1378 | $1,200 | $0.87 | 43d | 1 | 0.61mi |
| 1101 Phillips Ave Unit 1101 Dayton, OH | 3.0 | 1.5 | 1300 | $1,450 | $1.12 | 43d | 1 | 0.62mi |
| 244 Quitman St Unit A Dayton, OH | 3.0 | 1.0 | 1987 | $1,325 | $0.67 | 23d | 1 | 0.65mi |
| 32 Gebhart St Dayton, OH | 4.0 | 1.0 | 1800 | $1,400 | $0.78 | 14d | 1 | 0.66mi |
| 1603 Manette Pl Dayton, OH | 4.0 | 2.0 | 2000 | $1,695 | $0.85 | 14d | 1 | 0.73mi |
| 115 Livingston Ave Dayton, OH | 3.0 | 1.0 | 1624 | $1,450 | $0.89 | 44d | 1 | 0.73mi |
| 836 Wellmeier Ave Dayton, OH | 4.0 | 1.0 | 2148 | $1,500 | $0.70 | 3d | 1 | 0.77mi |
| 314 Sheridan Ave Dayton, OH | 3.0 | 1.0 | 1258 | $1,150 | $0.91 | 3d | 1 | 0.77mi |
| 320 Park Dr Dayton, OH | 4.0 | 3.0 | 2100 | $2,400 | $1.14 | 14d | 1 | 0.79mi |
| 519 Wyoming St Dayton, OH | 3.0 | 1.5 | 1240 | $1,600 | $1.29 | 43d | 1 | 0.81mi |
| 2114 Wayne Ave Dayton, OH | 4.0 | 2.0 | 1723 | $1,595 | $0.93 | 43d | 1 | 0.82mi |
| 2132 Wayne Ave Dayton, OH | 3.0 | 2.0 | 1484 | $1,350 | $0.91 | 2d | 1 | 0.84mi |
| 228 James St Dayton, OH | 3.0 | 1.0 | 1700 | $1,200 | $0.71 | 43d | 1 | 0.85mi |
| 227 James St Unit 1 Dayton, OH | 3.0 | 1.0 | 1700 | $1,200 | $0.71 | 3d | 1 | 0.86mi |
| 229 James St Unit 228 Dayton, OH | 3.0 | 1.0 | 1700 | $1,200 | $0.71 | 23d | 1 | 0.86mi |
| 920 E Stewart St Dayton, OH | 4.0 | 1.0 | 1322 | $1,425 | $1.08 | 43d | 1 | 0.95mi |
| 2600 Wayne Ave Dayton, OH | 4.0 | 1.5 | 1328 | $1,500 | $1.13 | 23d | 1 | 0.99mi |
| 534 Beckman St Dayton, OH | 3.0 | 2.0 | 1452 | $1,400 | $0.96 | 2d | 1 | 1.01mi |
| 319 Wyoming St Dayton, OH | 4.0 | 2.5 | 2064 | $2,000 | $0.97 | 2d | 1 | 1.07mi |
| 243 Oak St Dayton, OH | 3.0 | 1.5 | 1316 | $1,600 | $1.22 | 3d | 1 | 1.13mi |
| 218 Brown St Unit 218 Dayton, OH | 3.0 | 2.5 | 1789 | $2,200 | $1.23 | 43d | 1 | 1.21mi |
| 218 Brown St Dayton, OH | 3.0 | 2.5 | 1800 | $3,200 | $1.78 | 43d | 1 | 1.21mi |
| 216 Brown St Dayton, OH | 3.0 | 1.5 | 1563 | $2,500 | $1.60 | 43d | 1 | 1.22mi |
| 1520 S Smithville Rd Dayton, OH | 3.0 | 2.0 | 1481 | $1,345 | $0.91 | 2d | 1 | 1.29mi |
| 3707 E 3rd St Unit 3705 Dayton, OH | 3.0 | 1.0 | 1410 | $1,045 | $0.74 | 23d | 1 | 1.35mi |
| 204 Sears St Dayton, OH | 3.0 | 1.0–2.5 | 1124 | $2,793 | $2.48 | 2d | 10 | 1.38mi |
| 1112 Irving Ave Dayton, OH | 3.0 | 4.0 | 2041 | $4,500 | $2.20 | 3d | 1 | 1.44mi |
Listing history 19 events
-
2026-06-18days on market $130,000 Active 147 DOM
-
2026-06-17days on market $130,000 Active 146 DOM
-
2026-06-16days on market $130,000 Active 145 DOM
-
2026-06-15days on market $130,000 Active 144 DOM
-
2026-06-14days on market $130,000 Active 142 DOM
-
2026-06-13days on market $130,000 Active 141 DOM
-
2026-06-10days on market $130,000 Active 139 DOM
-
2026-06-09days on market $130,000 Active 138 DOM
-
2026-06-08days on market $130,000 Active 137 DOM
-
2026-06-07days on market $130,000 Active 136 DOM
-
2026-06-05days on market $130,000 Active 133 DOM
-
2026-06-03days on market $130,000 Active 132 DOM
-
2026-06-02days on market $130,000 Active 131 DOM
-
2026-06-01days on market $130,000 Active 130 DOM
-
2026-05-31days on market $130,000 Active 129 DOM
-
2026-04-11price $130,000 91-char remark
Show marketing remark (91 chars)
Duplex close to downtown Dayton. 2 Bedrooms, 1 bath on each side. Large fenced in backyard.
-
2026-02-21price $145,000 91-char remark
Show marketing remark (91 chars)
Duplex close to downtown Dayton. 2 Bedrooms, 1 bath on each side. Large fenced in backyard.
-
2026-01-18$160,000 Active 91-char remark
Show marketing remark (91 chars)
Duplex close to downtown Dayton. 2 Bedrooms, 1 bath on each side. Large fenced in backyard.
-
2011-06-20soldstatus $2,000
ⓘ Source: listings_history table (triggers on properties + properties_extension) + one-shot
backfill from property_details.listing_events for pre-trigger history.
Tax reassessment forecast OH · Partial reset (capped growth)
- Current annual tax
- $334 · $28/mo
- Projected year-2 tax
- $1,181 · $98/mo
- Expected delta
- +$847/yr (+$71/mo · 253.2%)
ⓘ Screening estimate from a state-policy table — verify with the county assessor before closing.
Climate risk First Street
- Flood 6/10 Major FEMA zone X (unshaded) · 74% chance over 30 yrs
- Wildfire 1/10 Low
- Heat 4/10 Moderate 7 d/yr ≥101°F today · 18 d/yr by 30 yrs out
- Wind 2/10 Low 0% chance of damaging wind over 30 yrs
- Air quality 3/10 Moderate 2 unhealthy d/yr today · 4 by 30 yrs out
Nearby sold comps map
Loading sold comps map…
Walkable amenities ~0.75 mi
Loading nearby amenities…
Taxation est. · year 1
- Rental income
- $17,689
- − Mortgage interest
- −$7,282
- − Property taxes
- −$334
- − Insurance
- −$650
- − Repairs & maintenance
- −$1,415
- − Management
- −$1,415
- − Depreciation
- −$3,782
- Taxable income
- $2,810
- Est. tax owed @ 24.0%
- −$674
- After-tax cash flow
- $4,134/yr
For passive investors: Depreciation is non-cash, so a rental often shows a tax loss while cash-flowing — sheltering income. Rental losses are passive: they offset passive income freely, and up to $25,000/yr can offset ordinary (W-2) income if you actively participate and your MAGI is under $100k (phasing out to $0 by $150k); unused losses carry forward. On sale, claimed depreciation is recaptured at up to 25%, and gains may owe capital-gains tax (a 1031 exchange can defer both). Figures are a year-1 estimate at your 24.0% rate — not tax advice; consult a CPA.
Schools (NCES district)
- District
- Dayton City
- NCES district ID
- 3904384
- Math proficiency
- 12% ▼ -12.00%
- Reading proficiency
- 21% ▼ -11.00%
- Median HH income
- $28,688
- Composite
- 12.94/100
- National rank
- #9579
- State rank
- #641 of 656 in OH
Livability — Dayton
- Score
- 65/100
- State rank
- #716
- US rank
- #12895
Category grades
Schools grade is shown separately in the Schools card above.
Census & demographics
- Census place
- Dayton, OH
- County
- Montgomery County · 459,541 people
- City population
- 164,387
- Metro
- Dayton-Kettering, OH
- Population (ZIP)
- 14,694
- Household income
- $46,651
- Rent vs Own
- Severe rent burden
- 961.0
Population outlook (Montgomery County) Hauer SSP2
- Today (2025)
- 523,241 people
- By 2030
- 514,948 · -1.6%
- By 2040
- 493,378 · -5.7%
- By 2050
- 469,639 · -10.2%
- By 2075
- 418,360 · -20.0%
- By 2100
- 353,315 · -32.5%
Race, ethnicity, and origin ACS 2023
- Neighborhood character
- Predominantly White (71%)
- Race & ethnicity
- White 71% Black 15% Hispanic / Latino 7% Two or more races 6% Asian 1%
- Hispanic origin (detail)
- Mexican 3%
- Common ancestry
- Lithuanian 2% Iranian 2% Slovak 2%
- Foreign-born
- 5% · Canada, United Kingdom
- Languages at home
- 91% English-only · Spanish 6% Tagalog/Filipino 1% Other Asian/Pacific 1%
Political lean MEDSL · Montgomery
- 2024 margin
- Toss-up / Even · D 49.8% · R 49.3%
- 2008→2024 swing
- -5.8pp toward R · 2008: 6.2pp · 2024: 0.5pp
- All cycles
- 2024: D+0.5 2020: D+2.2 2016: R+1.2 2012: D+3.1 2008: D+6.2
Not yet ingested
- Civics
- —
Market trends
- HPI YoY
- ▼ -100.61%
- Current HPI
- 369.3938
- Rent YoY
- ▲ 11.37%
- Metro
- Dayton-Kettering, OH
- State GDP YoY
- ▲ 1.98%
- F500 in state
- 48
Industry mix (Fortune 500 HQ in OH)
| Industry | F500 HQs | Revenue |
|---|---|---|
| Insurance | 3 | $145B |
|
||
| Industrial Machinery | 3 | $49B |
|
||
| Financial Services | 3 | $24B |
|
||
| Consumer Goods | 2 | $93B |
|
||
| Aerospace / Defense | 2 | $47B |
|
||
| Utilities | 2 | $33B |
|
||
Price history
+6400.0% since first listed4 events — show timeline
- 2026-04-11 Price Changed $130,000 Dayton MLS
- 2026-02-21 Price Changed $145,000 Dayton MLS
- 2026-01-18 Listed $160,000 Dayton MLS
- 2011-06-20 Sold (Public Records) $2,000 Public Records
Property tax history
+0.3%/yrLatest (2025): $334 · -0.2% YoY. Source: county tax records.
Cash-flow waterfall
monthlySold comps — $/sqft
last 12 mo · ≤1 miLoading sold comps…