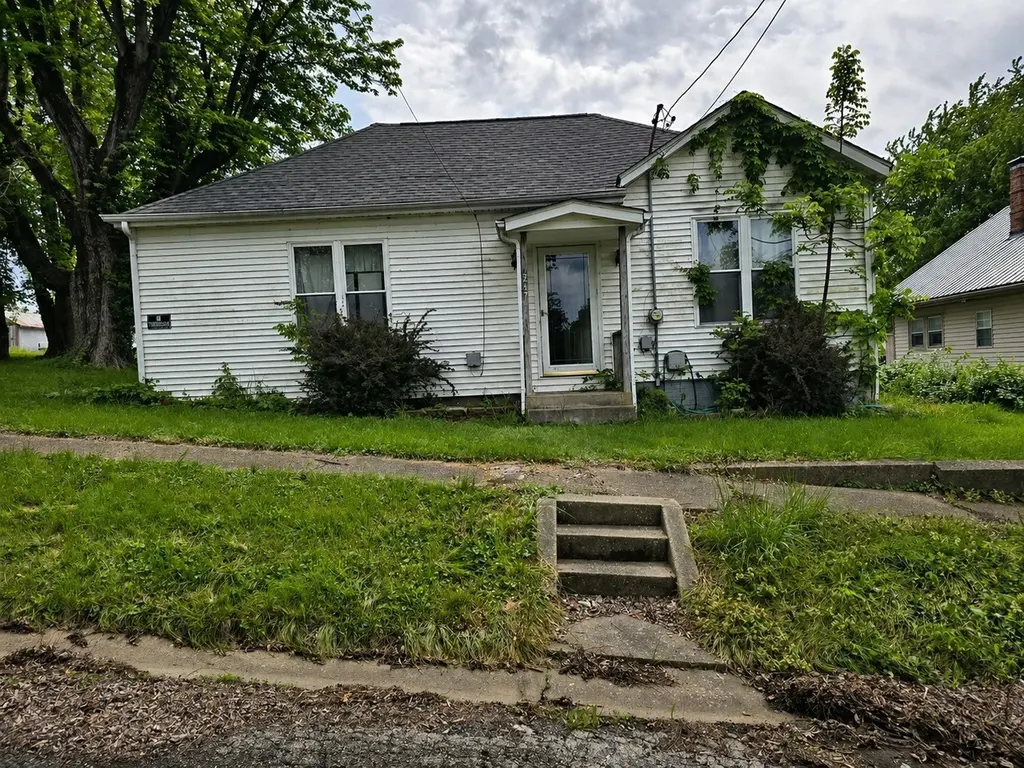
247 Maple St · Chester, IL
Flood risk 1/10 · Minimal
- FEMA flood zone
- X (unshaded)
- Chance of flooding over 30 yrs
- 0.0%
- Est. flood insurance / yr
- $473 – $860
Fire risk 2/10 · Minimal
- Est. fire insurance / yr
- $804 – $1,492
Heat risk 5/10 · Moderate
- Hot days now (above 107°F)
- 7 days/yr
- Hot days in 30 yrs
- 20 days/yr
Wind risk 2/10 · Minimal
- Chance of severe wind over 30 yrs
- 1.0%
Air-quality risk 2/10 · Minimal
- Unhealthy air days now
- 1 days/yr
- Unhealthy air days in 30 yrs
- 1 days/yr
Risk factors via First Street. Map © Google.
Why this score? — see what drove the B+ grade
The composite is a weighted blend of 9 inputs, each scored 0–100. Each bar is that input's sub-score; the figure is the points it added to the 100-point composite (weight × sub-score).
- Cash flow +30.0/30.0
- ARV discount +15.0/15.0
- 1% rule +10.0/10.0
- DSCR +10.0/10.0
- Livability +3.2/5.0
- Rent growth +2.5/5.0
- Condition / age +2.5/5.0
- Schools +1.9/10.0
- Appreciation +0.0/10.0
$54,900
🖨 Deal sheet 📄 Offer letter ✓ Due diligence
Listing remarks
3-bedroom home with a dedicated office space and 1.5 baths. The property offers strong value-add potential with a functional layout and several updates needed. The roof is fairly new with no known leaks. HVAC is operational, though the heating coil will need replacement. Kitchen and bathrooms are ready for updates, making this a strong opportunity for an investor or owner-occupant looking to build equity. Located in Chester, IL and priced to move
Key facts
- 9,477 sq ft lot
- Listed 50 days
Property features AI
Finance
- Other: Living area is an estimated value; Possession at closing
- HOA & community: No master association fee required
Exterior
- Utilities: Public water; Public sewer
- Home design: Detached single-family home; 1.5-story design; Fee simple ownership; Built 51–60 years ago; Aluminum siding
- Construction: Aluminum siding construction; Built before 1978
- Exterior features: Lot dimensions approximately 81 x 117; Lot size between 0.25 and 0.49 acre; Unincorporated location
Interior
- Kitchen: Double oven; Cooktop; Dishwasher; Refrigerator
- Bedrooms: 3 bedrooms (Master, two additional bedrooms on main level)
- Bathrooms: 1 full bathroom; 1 half bathroom
- Heating & cooling: Natural gas heating; Central air conditioning
- Interior features: Finished attic; Separate dining room; Unfinished partial basement; Seven total rooms
- Laundry & utility: Laundry room
Neighborhood map
What this means for you Summary
Snapshot
- This is a 3-bed/1.5-bath single-family listed at $55k.
Deal economics
- At list price, monthly cash flow is $425 ($5k/yr) — positive.
- The deal already cash-flows at list — no discount required.
- Meets the 1% rule at list price ($1k rent vs $55k).
- Recommended offer: $53k (3.0% below list) — sets the bar for market timing.
Location & tenants
- Location reads 63/100 on livability (#770 in IL) — a middle-class / working-renter tenant base. Strengths: crime A+, cost of living A+, housing A+; Watch: schools F, amenities F, commute F.
- Chester CUSD 139 (town): math 12% / reading 32% proficiency, ranked #393 of 620 in IL (top 63%) — low school quality limits family demand, transient renter base, plan for 1-2y turnover.
- Market conditions: 23 active listings in the ZIP; 1 comparable units currently listed for rent nearby; 3 units permitted in Randolph County in 2024 (0 in 5+ unit buildings).
Forward outlook
- Local home prices are declining (-3.0%/yr); year-one equity from $380 of loan paydown is wiped out by about $2k of value loss. Plan a longer hold.
- Randolph County population projected at -14% by 2050 — secular population decline; favor cash flow + early exit over multi-decade hold.
- At projected returns (-3.0% appreciation + 3.0% rent growth), your $15k cash investment doubles in ~4 years — after that, you're playing with house money.
Negotiation context
- It's been on market 51 days — a 3% lower offer ($53k) is reasonable based on typical stale-listing flexibility.
Risks & watch-outs
- Watch-outs: property tax is 2.8% of price.
- Climate carrying-cost: extreme-heat days projected 7→20/yr by 2055 (HVAC capex compounding) — expect insurance premiums to compound above CPI over the hold.
Questions for the listing agent
- It's been on market 51 days. Have you received any prior offers? Is the seller open to a 3% concession, seller financing, or rate buy-down credit?
- Property tax is high relative to price — has the assessment been appealed recently, and will the sale trigger a re-assessment?
- Is there a deadline driving the sale (1031 exchange, divorce, estate, relocation)? That informs how much negotiation room exists.
- Schools are F-rated, which usually means shorter tenancies and higher turnover. Who's the typical renter profile here, and what's been the actual vacancy rate?
- What's the average days-on-market for RENTAL listings here right now (not sales)? A rising rental-DOM trend means longer vacancies and softer asking-rent achievability than the comps imply.
- What's the recent tenant-quality profile in this submarket — average credit score on applications, eviction rate, late-payment / NSF rate, and stable-employment percentage? A property-management company in the area should have these aggregated.
- How much new for-sale + rental construction is in the pipeline within 1–3 miles? Heavy new supply typically softens prices + rents 12–24 months out; constrained supply supports both.
Investment metrics
- 1% rule
- 1.99% ✓
- Cap rate
- 15.58%
- Cash-on-cash
- 33.17%
- DSCR
- 2.48
- GRM
- 4.2
CMA / ARV
- ARV (median comp)
- $93,953
- List price
- $54,900
- Delta
- -41.57%
- Verdict
- UNDERPRICED
- Comps
- 20 within 1.0 mi
Show comp detail 7 sales within ~0.75 mi
| Address | Dist | Beds/Ba | Sqft | Sold | Price | $/sf | Match |
|---|---|---|---|---|---|---|---|
| 126 Opdyke St | 0.40mi | 3/1.0 | 1,372 (+6%) | 3mo | $55,000 | $40 | 67 |
| 925 Swanwick St | 0.43mi | 2/1.0 (-1) | 1,283 (-1%) | 6mo | $95,000 | $74 | 66 |
| 767 Oak St | 0.34mi | 4/1.0 (+1) | 1,320 (+2%) | 13mo | $110,000 | $83 | 64 |
| 753 W Oak St | 0.33mi | 3/1.0 | 1,376 (+6%) | 14mo | $39,000 | $28 | 61 |
| 801 Valley St | 0.42mi | 3/2.0 | 1,215 (-6%) | 18mo | $73,500 | $60 | 53 |
| 937 Swanwick St | 0.44mi | 3/1.0 | 1,161 (-11%) | 17mo | $125,000 | $108 | 45 |
| 708 Opdyke St | 0.58mi | 3/1.0 | 1,478 (+14%) | 21mo | $145,000 | $98 | 31 |
Match score weights: distance 35% · size 25% · config 20% · recency 20%. Top-matched comps best support the ARV.
Projected returns pro-forma
-3.0% appreciation · 3.0% rent growth · sell at horizon
- IRR
- 28.4%
- Equity multiple
- 2.19×
- Total profit
- $18,223
- Equity at exit
- $8,186
- IRR
- 35.9%
- Equity multiple
- 4.31×
- Total profit
- $50,937
- Equity at exit
- $4,747
Cash invested: $15,372 (down + closing). Projections, not guarantees.
Landlord ↔ Tenant lean methodology
- Overall (STATE)
- 43 Moderately Tenant-Leaning
- State Illinois
- 43 Moderately Tenant-Leaning · D+7
- County
- — inherits STATE
- City
- — inherits STATE
ZIP-level market 62233
- Active inventory
- 23
- Price-to-rent
- 4.2×
Monthly cashflow live
- Estimated rent
- $1,095 medium interval (Pro) →
- Mortgage (P&I)
- −$288
- Tax from tax record
- −$129 /mo · $1,552/yr
- Insurance
- −$23
- HOA
- −$0
- Vacancy / Maint / Mgmt
- −$230
- Net cashflow
- $425
Break-even live
UW: 25.0% down · 7.5% · 30yr · 1.5% tax · 5.0% vac · 8.0% maint · 8.0% mgmt
Financing live
Cash to close
- Down payment
- $13,725
- Closing costs
- $1,647
- Reserves months
- —
- Total cash needed
- —
Loan-product check · same deal, 3 products live
Conventional
25% down · 7.5% · 30yr
- Down + closing
- —
- Monthly P&I
- —
- Monthly cashflow
- —
- DSCR
- —
- Eligible?
- —
Personal DTI + credit; lowest rate.
DSCR
20% down · 8.5% · 30yr
- Down + closing
- —
- Monthly P&I
- —
- Monthly cashflow
- —
- DSCR
- —
- Eligible?
- —
No personal income docs; deal must DSCR.
Hard money
10% down · 12.0% · 12mo
- Down + closing
- —
- Monthly P&I
- —
- Monthly cashflow
- —
- DSCR
- —
- Eligible?
- —
Short-term bridge; refi at stabilization.
Rent comps 1 comps
| Address | Beds | Baths | Sqft | Rent | $/sqft | DOM | Units | Dist |
|---|---|---|---|---|---|---|---|---|
| 1101 George St Apt 3 Chester, IL | 2.0 | 1.0 | 900 | $1,095 | $1.22 | 43d | 1 | 0.56mi |
Listing history 18 events
-
2026-06-18days on market $54,900 Active 51 DOM
-
2026-06-17days on market $54,900 Active 50 DOM
-
2026-06-16days on market $54,900 Active 49 DOM
-
2026-06-15days on market $54,900 Active 48 DOM
-
2026-06-13days on market $54,900 Active 46 DOM
-
2026-06-12days on market $54,900 Active 45 DOM
-
2026-06-09days on market $54,900 Active 42 DOM
-
2026-06-08days on market $54,900 Active 41 DOM
-
2026-06-07days on market $54,900 Active 40 DOM
-
2026-06-07days on market $54,900 Active 39 DOM
-
2026-06-04days on market $54,900 Active 36 DOM
-
2026-06-02days on market $54,900 Active 35 DOM
-
2026-06-01days on market $54,900 Active 34 DOM
-
2026-05-31days on market $54,900 Active 33 DOM
-
2026-05-31days on market $54,900 Active 32 DOM
-
2026-05-14price $61,500 450-char remark
-
2026-04-28$68,000 Active 450-char remark
-
2023-01-31soldstatus $51,000
ⓘ Source: listings_history table (triggers on properties + properties_extension) + one-shot
backfill from property_details.listing_events for pre-trigger history.
Tax reassessment forecast IL · Partial reset (capped growth)
- Current annual tax
- $1,552 · $129/mo
- Projected year-2 tax
- $1,552 · $129/mo
- Expected delta
- $0/yr ($0/mo · 0.0%)
ⓘ Screening estimate from a state-policy table — verify with the county assessor before closing.
Climate risk First Street
- Flood 1/10 Low FEMA zone X (unshaded) · 0% chance over 30 yrs
- Wildfire 2/10 Low
- Heat 5/10 Major 7 d/yr ≥107°F today · 20 d/yr by 30 yrs out
- Wind 2/10 Low 100% chance of damaging wind over 30 yrs
- Air quality 2/10 Low 1 unhealthy d/yr today · 1 by 30 yrs out
Nearby sold comps map
Loading sold comps map…
Walkable amenities ~0.75 mi
Loading nearby amenities…
Taxation est. · year 1
- Rental income
- $13,140
- − Mortgage interest
- −$3,075
- − Property taxes
- −$1,552
- − Insurance
- −$274
- − Repairs & maintenance
- −$1,051
- − Management
- −$1,051
- − Depreciation
- −$1,597
- Taxable income
- $4,539
- Est. tax owed @ 24.0%
- −$1,089
- After-tax cash flow
- $4,010/yr
For passive investors: Depreciation is non-cash, so a rental often shows a tax loss while cash-flowing — sheltering income. Rental losses are passive: they offset passive income freely, and up to $25,000/yr can offset ordinary (W-2) income if you actively participate and your MAGI is under $100k (phasing out to $0 by $150k); unused losses carry forward. On sale, claimed depreciation is recaptured at up to 25%, and gains may owe capital-gains tax (a 1031 exchange can defer both). Figures are a year-1 estimate at your 24.0% rate — not tax advice; consult a CPA.
Schools (NCES district)
- District
- Chester CUSD 139
- NCES district ID
- 1709810
- Math proficiency
- 12% ▼ -5.00%
- Reading proficiency
- 32% ▼ -9.00%
- Median HH income
- $47,390
- Composite
- 19.24/100
- National rank
- #8807
- State rank
- #393 of 620 in IL
Livability — Chester
- Score
- 63/100
- State rank
- #770
- US rank
- #15436
Category grades
Schools grade is shown separately in the Schools card above.
Census & demographics
- Census place
- Chester, IL
- Population (ZIP)
- 8,233
Population outlook (Randolph County) Hauer SSP2
- Today (2025)
- 31,417 people
- By 2030
- 30,519 · -2.9%
- By 2040
- 28,841 · -8.2%
- By 2050
- 27,150 · -13.6%
- By 2075
- 22,569 · -28.2%
- By 2100
- 16,584 · -47.2%
Race, ethnicity, and origin ACS 2023
- Neighborhood character
- Predominantly White (73%)
- Race & ethnicity
- White 73% Black 21% Hispanic / Latino 5% Two or more races 2%
- Common ancestry
- Lithuanian 4% Serbian 3% Italian 3%
- Foreign-born
- 1% · Canada
- Languages at home
- 97% English-only · Spanish 3%
Political lean MEDSL · Randolph
- 2024 margin
- Solid R (+50.0) · D 24.1% · R 74.1% · Other 1.7%
- 2008→2024 swing
- -49.0pp toward R · 2008: -0.9pp · 2024: -50.0pp
- All cycles
- 2024: R+50.0 2020: R+50.2 2016: R+46.8 2012: R+17.6 2008: R+0.9
Not yet ingested
- Civics
- —
Market trends
- HPI YoY
- ▼ -68.79%
- Current HPI
- 119.2269
- Rent YoY
- —
- Metro
- —
- State GDP YoY
- ▲ 1.59%
- F500 in state
- 60
Industry mix (Fortune 500 HQ in IL)
| Industry | F500 HQs | Revenue |
|---|---|---|
| Insurance | 4 | $201B |
|
||
| Consumer Goods | 4 | $87B |
|
||
| Industrial Machinery | 3 | $64B |
|
||
| Healthcare | 2 | $55B |
|
||
| Retail / Pharmacy | 1 | $148B |
|
||
| Agriculture / Food | 1 | $86B |
|
||
Price history
+7.6% since first listed4 events — show timeline
- 2026-05-23 Price Changed $54,900 MRED as Distributed by MLS Grid
- 2026-05-14 Price Changed $61,500 MRED as Distributed by MLS Grid
- 2026-04-28 Listed $68,000 MRED as Distributed by MLS Grid
- 2023-01-31 Sold (Public Records) $51,000 Public Records
Property tax history
+2.6%/yrLatest (2024): $1,552 · -17.0% YoY. Source: county tax records.
Cash-flow waterfall
monthlySold comps — $/sqft
last 12 mo · ≤1 miLoading sold comps…