 6-Plex
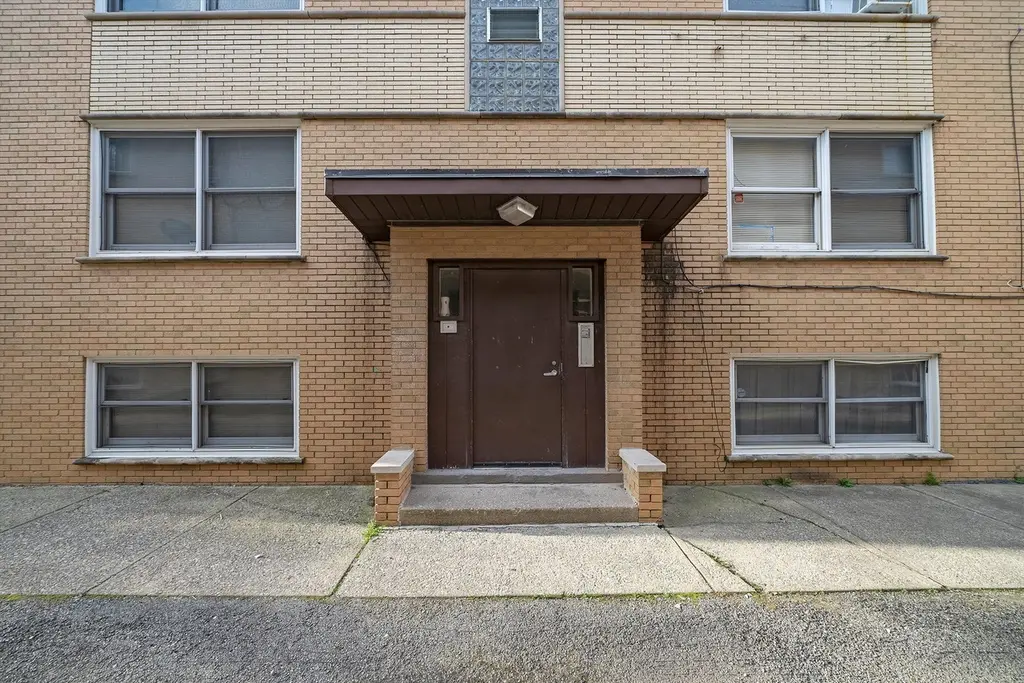
12452 Fairview Ave · Blue Island, IL
Flood risk 1/10 · Minimal
- FEMA flood zone
- X (unshaded)
- Chance of flooding over 30 yrs
- 0.0%
- Est. flood insurance / yr
- $473 – $860
Fire risk 1/10 · Minimal
- Est. fire insurance / yr
- $804 – $1,492
Heat risk 3/10 · Minor
- Hot days now (above 101°F)
- 7 days/yr
- Hot days in 30 yrs
- 15 days/yr
Wind risk 2/10 · Minimal
- Chance of severe wind over 30 yrs
- —
Air-quality risk 4/10 · Minor
- Unhealthy air days now
- 4 days/yr
- Unhealthy air days in 30 yrs
- 6 days/yr
Risk factors via First Street. Map © Google.
Why this score? — see what drove the C+ grade
The composite is a weighted blend of 9 inputs, each scored 0–100. Each bar is that input's sub-score; the figure is the points it added to the 100-point composite (weight × sub-score).
- Cash flow +28.7/30.0
- DSCR +10.0/10.0
- 1% rule +9.8/10.0
- Livability +3.9/5.0
- ARV discount +3.6/15.0
- Rent growth +2.5/5.0
- Condition / age +2.5/5.0
- Schools +1.6/10.0
- Appreciation +0.0/10.0
$545,000
🖨 Deal sheet 📄 Offer letter ✓ Due diligence
Multi-family units
County records classify this as Multi-Family (5+ Unit). Listing-text estimate: 6 units. confirmed
5+ unit building — per-unit beds/baths from public records are typically unavailable; the breakdown below (if shown) is an estimate from the listing text.
Listing remarks MLS
Six unit multifamily in a good rental area. The property is fully rented. Located close to I-57 & I-294. Six parking spaces. A good addition to an investors portfolio. * Please reference 12456 Fairview that is owned by the seller. Marketing package is available on request.
Key facts
- Six parking spaces
- Good rental area
- Fully rented
Tags
Neighborhood map
What this means for you Summary
Snapshot
- This is a 6 × 1-bed/1-bath units multifamily listed at $545k.
Deal economics
- At list price, monthly cash flow is $2k ($22k/yr) — positive. Per door: $302/mo.
- The deal already cash-flows at list — no discount required.
- Meets the 1% rule at list price ($8k rent vs $545k).
- Recommended offer: $480k (12.0% below list) — sets the bar for market timing.
- Cap rate 10.3% vs local median 6.5% in Blue Island — top-decile yield for the area; either an underpriced asset or a hidden risk that comps aren't pricing in. Stress-test before assuming the spread holds.
Location & tenants
- Location reads 77/100 on livability (#159 in IL, #2,964 nationally) — a middle-class / working-renter tenant base. Strengths: commute A+, cost of living A+, housing A+; Watch: employment C-, schools F, crime F.
- Chsd 218 (suburban): math 14% / reading 20% proficiency, ranked #454 of 620 in IL (top 73%) — low school quality limits family demand, transient renter base, plan for 1-2y turnover.
- Market conditions: 43 active listings in the ZIP; 6,272 units permitted in Cook County in 2024 (4,658 in 5+ unit buildings).
Forward outlook
- Local home prices are declining (-3.0%/yr); year-one equity from $4k of loan paydown is wiped out by about $16k of value loss. Plan a longer hold.
- At projected returns (-3.0% appreciation + 3.0% rent growth), your $153k cash investment doubles in ~9 years — after that, you're playing with house money.
Negotiation context
- It's been on market 422 days — a 12% lower offer ($480k) is reasonable based on typical stale-listing flexibility.
- 3 sale attempts since 19y ago; this cycle's ask has dropped $50k (8%) from the opening price — seller is motivated, your offer sets the floor, not the list.
Risks & watch-outs
- Watch-outs: property tax is 3.2% of price.
Questions for the listing agent
- It's been on market 422 days. Have you received any prior offers? Is the seller open to a 12% concession, seller financing, or rate buy-down credit?
- Can we see the unit-by-unit rent roll, current vacancy, and any below-market leases? What's the average tenancy length?
- What capital expenditures (roof, boiler, parking lot, exteriors) have been made in the last 5 years, and what's planned in the next 2?
- Built in 1962 — when were the roof, HVAC, electrical panel, plumbing, and water heater last replaced?
- Property tax is high relative to price — has the assessment been appealed recently, and will the sale trigger a re-assessment?
- Why hasn't it sold? Are there any deal-killer items the seller is aware of (foundation, flood, title, zoning, code violations)?
- Is there a deadline driving the sale (1031 exchange, divorce, estate, relocation)? That informs how much negotiation room exists.
- Schools are F-rated, which usually means shorter tenancies and higher turnover. Who's the typical renter profile here, and what's been the actual vacancy rate?
- Crime grade is F in this area — have there been break-ins, vandalism, or insurance claims at this property in the last 3 years? What carrier currently insures it and at what premium?
- What's the average days-on-market for RENTAL listings here right now (not sales)? A rising rental-DOM trend means longer vacancies and softer asking-rent achievability than the comps imply.
- What's the recent tenant-quality profile in this submarket — average credit score on applications, eviction rate, late-payment / NSF rate, and stable-employment percentage? A property-management company in the area should have these aggregated.
- How much new apartment / multifamily construction is in the pipeline within 1–3 miles? Heavy new supply (>2% of stock underway) typically softens rents 12–24 months out; light construction supports rent growth.
Investment metrics
- 1% rule
- 1.48% ✓
- Cap rate
- 10.28%
- Cash-on-cash
- 14.23%
- DSCR
- 1.63
- GRM
- 5.6
CMA / ARV
- ARV (median comp)
- $501,350
- List price
- $545,000
- Delta
- 8.71%
- Verdict
- FAIR
- Comps
- 5 within 1.0 mi
Show comp detail 1 sale within ~0.75 mi
| Address | Dist | Beds/Ba | Sqft | Sold | Price | $/sf | Match |
|---|---|---|---|---|---|---|---|
| 12840 Mozart St | 0.49mi | 10/5.0 | 5,030 (-5%) | 18mo | $440,000 | $87 | 49 |
Match score weights: distance 35% · size 25% · config 20% · recency 20%. Top-matched comps best support the ARV.
Projected returns pro-forma
-3.0% appreciation · 3.0% rent growth · sell at horizon
- IRR
- 4.7%
- Equity multiple
- 1.18×
- Total profit
- $27,557
- Equity at exit
- $81,261
- IRR
- 14.2%
- Equity multiple
- 2.15×
- Total profit
- $174,884
- Equity at exit
- $47,122
Cash invested: $152,600 (down + closing). Projections, not guarantees.
Landlord ↔ Tenant lean methodology
- Overall (STATE)
- 43 Moderately Tenant-Leaning
- State Illinois
- 43 Moderately Tenant-Leaning · D+7
- County
- — inherits STATE
- City
- — inherits STATE
ZIP-level market 60406
- Home prices YoY
- -26.8%
- Active inventory
- 43
- Price-to-rent
- 33.8×
Monthly cashflow live
- Estimated rent
- $8,059 high interval (Pro) →
- Mortgage (P&I)
- −$2,858
- Tax from tax record
- −$1,472 /mo · $17,661/yr
- Insurance
- −$227
- HOA
- −$0
- Vacancy / Maint / Mgmt
- −$1,692
- Net cashflow
- $1,810
Break-even live
6-unit breakdown (identical units grouped — click to expand)
| Units | Beds | Baths | Est. rent |
|---|---|---|---|
| 6× units | 1 | 1 | $8,058 |
| #1 | 1 | 1 | $1,343 |
| #2 | 1 | 1 | $1,343 |
| #3 | 1 | 1 | $1,343 |
| #4 | 1 | 1 | $1,343 |
| #5 | 1 | 1 | $1,343 |
| #6 | 1 | 1 | $1,343 |
| Total (6 units) | $8,059 | ||
UW: 25.0% down · 7.5% · 30yr · 1.5% tax · 5.0% vac · 8.0% maint · 8.0% mgmt
Financing live
Cash to close
- Down payment
- $136,250
- Closing costs
- $16,350
- Reserves months
- —
- Total cash needed
- —
Loan-product check · same deal, 3 products live
Conventional
25% down · 7.5% · 30yr
- Down + closing
- —
- Monthly P&I
- —
- Monthly cashflow
- —
- DSCR
- —
- Eligible?
- —
Personal DTI + credit; lowest rate.
DSCR
20% down · 8.5% · 30yr
- Down + closing
- —
- Monthly P&I
- —
- Monthly cashflow
- —
- DSCR
- —
- Eligible?
- —
No personal income docs; deal must DSCR.
Hard money
10% down · 12.0% · 12mo
- Down + closing
- —
- Monthly P&I
- —
- Monthly cashflow
- —
- DSCR
- —
- Eligible?
- —
Short-term bridge; refi at stabilization.
Listing history 24 events
-
2026-06-18days on market $545,000 Active 422 DOM
-
2026-06-17days on market $545,000 Active 421 DOM
-
2026-06-16days on market $545,000 Active 420 DOM
-
2026-06-15days on market $545,000 Active 419 DOM
-
2026-06-13days on market $545,000 Active 417 DOM
-
2026-06-09days on market $545,000 Active 413 DOM
-
2026-06-08days on market $545,000 Active 412 DOM
-
2026-06-07days on market $545,000 Active 411 DOM
-
2026-06-04days on market $545,000 Active 408 DOM
-
2026-06-03days on market $545,000 Active 407 DOM
-
2026-06-02days on market $545,000 Active 406 DOM
-
2026-06-01days on market $545,000 Active 405 DOM
-
2026-05-31days on market $545,000 Active 404 DOM
-
2025-04-25price $545,000 279-char remark
Show marketing remark (279 chars)
Six unit multifamily in a good rental area. The property is fully rented. Located close to I-57 & I-294. Six parking spaces. A good addition to an investors portfolio. * Please reference 12456 Fairview that is owned by the seller. Marketing package is available on request.
-
2025-04-22$595,000 Active 279-char remark
Show marketing remark (279 chars)
Six unit multifamily in a good rental area. The property is fully rented. Located close to I-57 & I-294. Six parking spaces. A good addition to an investors portfolio. * Please reference 12456 Fairview that is owned by the seller. Marketing package is available on request.
-
2021-04-27soldstatus $640,000
-
2021-02-26soldstatus $640,000 Closed Sale 956-char remark
Show marketing remark (956 chars)
Two 6-unit, all brick multi-family buildings tucked away in a neighborhood of historic Blue Island that offers 10+% Cap Rate! These buildings are comprised of ten, 2 bedroom, 1 bathroom units (all the same floor plan) and two, 1 bedroom, 1 bathroom units (both the same floor plan). With rents below market value these properties still boast a Cap Rate of over 10.5%. Rents range from $741 to $900 a month with extra income from Laundry located in each buildings's basement. Several tenants have been there for years and rent rolls are available on request. Most units have hard wood floors with only a couple with carpet left due to long term tenants that have not moved yet. The buildings are voucher approved so the owners rarely have vacancies. Close to the highway, Metra and Red line these properties make great rentals for commuters. Price reflects the sale of both buildings together which the owners prefer. Tax IDs: 24254080300000, 24254080310000
-
2021-01-15historical 956-char remark
Show marketing remark (956 chars)
Two 6-unit, all brick multi-family buildings tucked away in a neighborhood of historic Blue Island that offers 10+% Cap Rate! These buildings are comprised of ten, 2 bedroom, 1 bathroom units (all the same floor plan) and two, 1 bedroom, 1 bathroom units (both the same floor plan). With rents below market value these properties still boast a Cap Rate of over 10.5%. Rents range from $741 to $900 a month with extra income from Laundry located in each buildings's basement. Several tenants have been there for years and rent rolls are available on request. Most units have hard wood floors with only a couple with carpet left due to long term tenants that have not moved yet. The buildings are voucher approved so the owners rarely have vacancies. Close to the highway, Metra and Red line these properties make great rentals for commuters. Price reflects the sale of both buildings together which the owners prefer. Tax IDs: 24254080300000, 24254080310000
-
2021-01-15$670,000 956-char remark
Show marketing remark (956 chars)
Two 6-unit, all brick multi-family buildings tucked away in a neighborhood of historic Blue Island that offers 10+% Cap Rate! These buildings are comprised of ten, 2 bedroom, 1 bathroom units (all the same floor plan) and two, 1 bedroom, 1 bathroom units (both the same floor plan). With rents below market value these properties still boast a Cap Rate of over 10.5%. Rents range from $741 to $900 a month with extra income from Laundry located in each buildings's basement. Several tenants have been there for years and rent rolls are available on request. Most units have hard wood floors with only a couple with carpet left due to long term tenants that have not moved yet. The buildings are voucher approved so the owners rarely have vacancies. Close to the highway, Metra and Red line these properties make great rentals for commuters. Price reflects the sale of both buildings together which the owners prefer. Tax IDs: 24254080300000, 24254080310000
-
2008-07-10soldstatus $520,000
-
2008-07-01soldstatus $520,000
-
2008-05-14historical
-
2007-10-03$609,900
-
1987-10-28soldstatus $155,000
ⓘ Source: listings_history table (triggers on properties + properties_extension) + one-shot
backfill from property_details.listing_events for pre-trigger history.
Tax reassessment forecast IL · Partial reset (capped growth)
- Current annual tax
- $17,661 · $1,472/mo
- Projected year-2 tax
- $17,661 · $1,472/mo
- Expected delta
- $0/yr ($0/mo · 0.0%)
ⓘ Screening estimate from a state-policy table — verify with the county assessor before closing.
Climate risk First Street
- Flood 1/10 Low FEMA zone X (unshaded) · 0% chance over 30 yrs
- Wildfire 1/10 Low
- Heat 3/10 Moderate 7 d/yr ≥101°F today · 15 d/yr by 30 yrs out
- Wind 2/10 Low
- Air quality 4/10 Moderate 4 unhealthy d/yr today · 6 by 30 yrs out
Nearby sold comps map
Loading sold comps map…
Walkable amenities ~0.75 mi
Loading nearby amenities…
Taxation est. · year 1
- Rental income
- $96,708
- − Mortgage interest
- −$30,528
- − Property taxes
- −$17,661
- − Insurance
- −$2,725
- − Repairs & maintenance
- −$7,737
- − Management
- −$7,737
- − Depreciation
- −$15,855
- Taxable income
- $14,466
- Est. tax owed @ 24.0%
- −$3,472
- After-tax cash flow
- $18,245/yr
For passive investors: Depreciation is non-cash, so a rental often shows a tax loss while cash-flowing — sheltering income. Rental losses are passive: they offset passive income freely, and up to $25,000/yr can offset ordinary (W-2) income if you actively participate and your MAGI is under $100k (phasing out to $0 by $150k); unused losses carry forward. On sale, claimed depreciation is recaptured at up to 25%, and gains may owe capital-gains tax (a 1031 exchange can defer both). Figures are a year-1 estimate at your 24.0% rate — not tax advice; consult a CPA.
Schools (NCES district)
- District
- Chsd 218
- NCES district ID
- 1706540
- Math proficiency
- 14% ▼ -4.00%
- Reading proficiency
- 20% ▼ -1.00%
- Median HH income
- $57,166
- Composite
- 16.09/100
- National rank
- #9235
- State rank
- #454 of 620 in IL
Livability — Blue Island
- Score
- 77/100
- State rank
- #159
- US rank
- #2964
Category grades
Schools grade is shown separately in the Schools card above.
Census & demographics
- Census place
- Blue Island, IL
- City population
- 24,887
- Population (ZIP)
- 24,887
Population outlook (Cook County) Hauer SSP2
- Today (2025)
- 5,347,519 people
- By 2030
- 5,357,703 · +0.2%
- By 2040
- 5,324,924 · -0.4%
- By 2050
- 5,230,762 · -2.2%
- By 2075
- 4,785,735 · -10.5%
- By 2100
- 4,188,836 · -21.7%
Race, ethnicity, and origin ACS 2023
- Neighborhood character
- Diverse neighborhood (Simpson 0.65)
- Race & ethnicity
- Hispanic / Latino 44% Black 34% White 19% Two or more races 8%
- Hispanic origin (detail)
- Mexican 39%
- Common ancestry
- Romanian 2% English 1% Iranian 1%
- Foreign-born
- 19% · Canada
- Languages at home
- 65% English-only · Spanish 33% Other Indo-European 1%
Political lean MEDSL · Cook
- 2024 margin
- Solid D (+42.0) · D 70.4% · R 28.4% · Other 1.2%
- 2008→2024 swing
- -11.4pp toward R · 2008: 53.4pp · 2024: 42.0pp
- All cycles
- 2024: D+42.0 2020: D+50.3 2016: D+53.0 2012: D+49.4 2008: D+53.4
Not yet ingested
- Civics
- —
Market trends
- HPI YoY
- ▼ -94.77%
- Current HPI
- 259.492
- Rent YoY
- —
- Metro
- —
- State GDP YoY
- ▲ 1.59%
- F500 in state
- 60
Industry mix (Fortune 500 HQ in IL)
| Industry | F500 HQs | Revenue |
|---|---|---|
| Insurance | 4 | $201B |
|
||
| Consumer Goods | 4 | $87B |
|
||
| Industrial Machinery | 3 | $64B |
|
||
| Healthcare | 2 | $55B |
|
||
| Retail / Pharmacy | 1 | $148B |
|
||
| Agriculture / Food | 1 | $86B |
|
||
Price history
+251.6% since first listed11 events — show timeline
- 2025-04-25 Price Changed $545,000 MRED as Distributed by MLS Grid
- 2025-04-22 Listed $595,000 MRED as Distributed by MLS Grid
- 2021-04-27 Sold (Public Records) $640,000 Public Records
- 2021-02-26 Sold (MLS) $640,000 MRED as Distributed by MLS Grid
- 2021-01-15 Listed $670,000 MRED as Distributed by MLS Grid
- 2021-01-15 Listing Removed — MRED as Distributed by MLS Grid
- 2008-07-10 Sold (Public Records) $520,000 Public Records
- 2008-07-01 Sold (MLS) $520,000 MRED as Distributed by MLS Grid
- 2008-05-14 Listing Removed — MRED as Distributed by MLS Grid
- 2007-10-03 Listed $609,900 MRED as Distributed by MLS Grid
- 1987-10-28 Sold (Public Records) $155,000 Public Records
Property tax history
+5.1%/yrLatest (2023): $17,661 · +19.7% YoY. Source: county tax records.
Cash-flow waterfall
monthlySold comps — $/sqft
last 12 mo · ≤1 miLoading sold comps…