180 An County Road 2227 · Palestine, TX
Flood risk 1/10 · Minimal
- FEMA flood zone
- X (unshaded)
- Chance of flooding over 30 yrs
- 0.0%
- Est. flood insurance / yr
- $507 – $1,088
Fire risk 4/10 · Minor
- Est. fire insurance / yr
- $1,222 – $2,270
Heat risk 7/10 · Major
- Hot days now (above 110°F)
- 7 days/yr
- Hot days in 30 yrs
- 25 days/yr
Wind risk 6/10 · Moderate
- Chance of severe wind over 30 yrs
- 74.0%
Air-quality risk 1/10 · Minimal
- Unhealthy air days now
- 0 days/yr
- Unhealthy air days in 30 yrs
- 0 days/yr
Risk factors via First Street. Map © Google.
Why this score? — see what drove the C- grade
The composite is a weighted blend of 9 inputs, each scored 0–100. Each bar is that input's sub-score; the figure is the points it added to the 100-point composite (weight × sub-score).
- Cash flow +17.4/30.0
- ARV discount +7.5/15.0
- Appreciation +6.4/10.0
- DSCR +5.4/10.0
- Schools +5.4/10.0
- 1% rule +4.2/10.0
- Livability +3.3/5.0
- Rent growth +2.5/5.0
- Condition / age +2.5/5.0
$129,900
🖨 Deal sheet (PDF) 📄 Offer letter ✓ Due diligence
Listing remarks
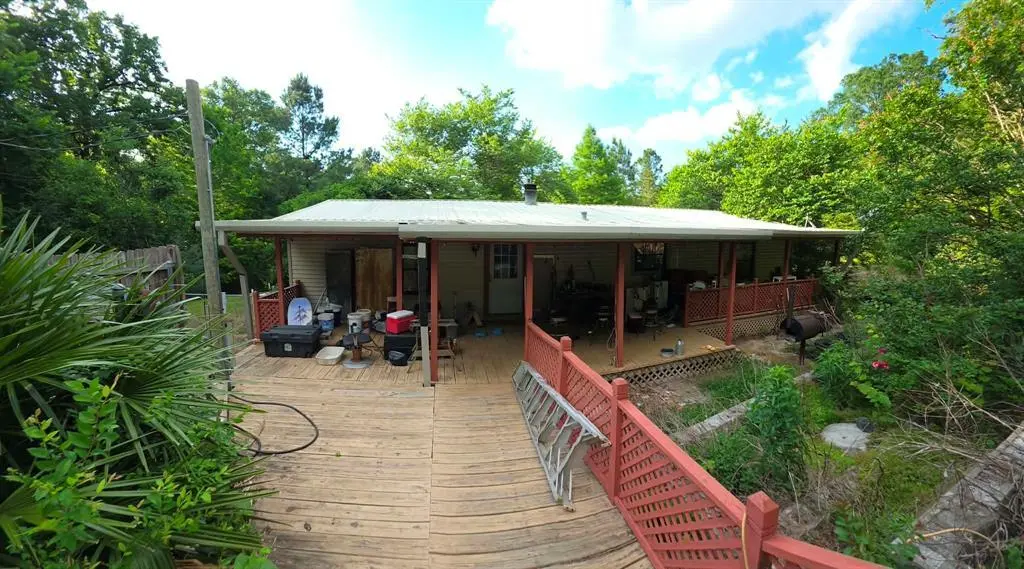
Situated on approximately 2 acres in Tennessee Colony, this 3-bd, 2-ba home offers peaceful country living with plenty of outdoor space. The home features approximately 1,400 sq ft with central heat and air, wood flooring, a wood-burning fireplace with decorative tile surround, and a remodeled kitchen with granite countertops, wood cabinetry, and stainless steel appliances. Additional features include a metal roof, double-pane windows, covered parking-carport, open deck space, mature oak trees, and an above-ground pool. Septic system was recently inspected and cleaned. Conveniently located within Cayuga ISD while offering a quiet rural setting outside city limits.
Key facts
- Metal roof
- Remodeled kitchen
- Granite countertops
Tags
Property features AI
Finance
- Other: Listing status: Active; Possession at closing/funding; Listing terms: Exclusive agency
- Financial info: Acceptable financing: Cash, Conventional, FHA; No second mortgage reported
- HOA & community: No homeowners association
Exterior
- Parking: Detached covered carport; Two carport spaces (covered)
- Utilities: City water; Septic system; Asphalt access; No municipal utility district
- Home design: Mobile home (single-story); One level; Property type: Residential
- Construction: Metal roof; Slab foundation; Built in 1985
- Exterior features: Covered porch; Covered deck; In-ground pool; Landscaped grounds; Approximately 2 acres
Interior
- Kitchen: Kitchen (level 1) — 11 x 13; Washer listed among appliances
- Bedrooms: Primary bedroom (level 1) — 14 x 15; Bedroom (level 1) — 10 x 11; Bedroom (level 1) — 10 x 10
- Flooring: Carpet
- Bathrooms: Two full bathrooms (both level 1) — approx. 8 x 10 and 5 x 8
- Heating & cooling: Central heating (electric); Central air conditioning (electric)
- Interior features: Vaulted ceilings; Cable TV available; Seven rooms total; One living area
- Laundry & utility: Washer included
Neighborhood map
What this means for you Summary
Snapshot
- This is a 3-bed/2.0-bath manufactured listed at $130k.
Deal economics
- At list price, monthly cash flow is $96 ($1k/yr) — positive.
- The deal already cash-flows at list — no discount required.
- To meet the 1% rule (rent ≥ 1% of price), the offer needs to be $120k (7.9% below list).
- Recommended offer: $120k (7.9% below list) — sets the bar for 1% rule.
- Cap rate 7.2% vs local median 3.9% in Palestine — top-decile yield for the area; either an underpriced asset or a hidden risk that comps aren't pricing in. Stress-test before assuming the spread holds.
Location & tenants
- Location reads 66/100 on livability (#657 in TX) — a middle-class / working-renter tenant base. Strengths: cost of living A+, housing A+; Watch: crime D+, employment D, amenities F.
- Cayuga ISD (rural): math 66% / reading 62% proficiency, ranked #44 of 826 in TX (top 5%) — acceptable for families but not a draw, mixed tenant base, ~2y average lease.
- Zoned schools: Cayuga El (math 72% / reading 67%, grade A-, #146 of 4,322 statewide, top 4%, 257 students, 55% FRL) — zoned schools average 55% FRL vs 31% district-wide (24 pts higher); higher-poverty schools than district average — tighter screening recommended.
- Market conditions: 24 active listings in the ZIP; 29 units permitted in Anderson County in 2024 (0 in 5+ unit buildings).
Forward outlook
- In year one you build about $5k of equity ($898 loan paydown + $4k appreciation (2.9% local appreciation)).
- Anderson County population projected at +4% by 2050 — modest demand growth; plan on rents tracking national, not racing it.
- At projected returns (2.9% appreciation + 3.0% rent growth), your $36k cash investment doubles in ~6 years — after that, you're playing with house money.
- By year 8, paydown + projected appreciation supports a ~$34k cash-out refi (75% LTV) — recoverable capital for the next deal without selling this one.
Negotiation context
- Only 6 days on market — expect competitive offers; lowballing is unlikely to land.
Risks & watch-outs
- Climate carrying-cost: major wind risk, 74% chance of damaging wind over 30y; extreme-heat days projected 7→25/yr by 2055 (HVAC capex compounding) — expect insurance premiums to compound above CPI over the hold.
Questions for the listing agent
- Is there a deadline driving the sale (1031 exchange, divorce, estate, relocation)? That informs how much negotiation room exists.
- Schools are D-rated, which usually means shorter tenancies and higher turnover. Who's the typical renter profile here, and what's been the actual vacancy rate?
- Crime grade is D in this area — have there been break-ins, vandalism, or insurance claims at this property in the last 3 years? What carrier currently insures it and at what premium?
- What's the average days-on-market for RENTAL listings here right now (not sales)? A rising rental-DOM trend means longer vacancies and softer asking-rent achievability than the comps imply.
- What's the recent tenant-quality profile in this submarket — average credit score on applications, eviction rate, late-payment / NSF rate, and stable-employment percentage? A property-management company in the area should have these aggregated.
- How much new for-sale + rental construction is in the pipeline within 1–3 miles? Heavy new supply typically softens prices + rents 12–24 months out; constrained supply supports both.
Investment metrics
- 1% rule
- 0.92% ✗
- Cap rate
- 7.18%
- Cash-on-cash
- 3.18%
- DSCR
- 1.14
- GRM
- 9.0
CMA / ARV
No comps found within radius.
Projected returns pro-forma
2.85% appreciation · 3.0% rent growth · sell at horizon
- IRR
- 10.0%
- Equity multiple
- 1.57×
- Total profit
- $20,742
- Equity at exit
- $57,313
- IRR
- 12.5%
- Equity multiple
- 2.83×
- Total profit
- $66,531
- Equity at exit
- $87,484
Cash invested: $36,372 (down + closing). Projections, not guarantees.
Landlord ↔ Tenant lean methodology
- Overall (STATE)
- 87 Strongly Landlord-Friendly
- State Texas
- 87 Strongly Landlord-Friendly · R+5
- County
- — inherits STATE
- City
- — inherits STATE
ZIP-level market 75861
- Home prices YoY
- 2.7%
- Active inventory
- 24
- Price-to-rent
- 9.0×
Monthly cashflow live
- Estimated rent
- $1,197 medium interval (Pro) →
- Mortgage (P&I)
- −$681
- Tax from tax record
- −$114 /mo · $1,364/yr
- Insurance
- −$54
- HOA
- −$0
- Vacancy / Maint / Mgmt
- −$251
- Net cashflow
- $96
Break-even live
Sensitivity live
| Price | -10% $170 | -5% $133 | +0% $96 | +5% $60 | +10% $23 |
|---|---|---|---|---|---|
| Rent | -10% $2 | -5% $49 | +0% $96 | +5% $144 | +10% $191 |
| Rate | -1.0pp $162 | -0.5pp $129 | base $96 | +0.5pp $63 | +1.0pp $28 |
UW: 25.0% down · 7.5% · 30yr · 1.5% tax · 5.0% vac · 8.0% maint · 8.0% mgmt
Financing live
Cash to close
- Down payment
- $32,475
- Closing costs
- $3,897
- Reserves months
- —
- Total cash needed
- —
Loan-product check · same deal, 3 products live
Conventional
25% down · 7.5% · 30yr
- Down + closing
- —
- Monthly P&I
- —
- Monthly cashflow
- —
- DSCR
- —
- Eligible?
- —
Personal DTI + credit; lowest rate.
DSCR
20% down · 8.5% · 30yr
- Down + closing
- —
- Monthly P&I
- —
- Monthly cashflow
- —
- DSCR
- —
- Eligible?
- —
No personal income docs; deal must DSCR.
Hard money
10% down · 12.0% · 12mo
- Down + closing
- —
- Monthly P&I
- —
- Monthly cashflow
- —
- DSCR
- —
- Eligible?
- —
Short-term bridge; refi at stabilization.
Listing history 5 events
-
2026-06-01statusdays on market $129,900 Pending 6 DOM
-
2026-05-31days on market $129,900 Active 5 DOM
-
2026-05-30days on market $129,900 Active 4 DOM
-
2026-05-26$129,900 Active
-
2007-03-23soldstatus
ⓘ Source: listings_history table (triggers on properties + properties_extension) + one-shot
backfill from property_details.listing_events for pre-trigger history.
Tax reassessment forecast TX · Resets to sale price
- Current annual tax
- $1,364 · $114/mo
- Projected year-2 tax
- $2,377 · $198/mo
- Expected delta
- +$1,013/yr (+$84/mo · 74.2%)
ⓘ Screening estimate from a state-policy table — verify with the county assessor before closing.
Climate risk First Street
- Flood 1/10 Low FEMA zone X (unshaded) · 0% chance over 30 yrs
- Wildfire 4/10 Moderate
- Heat 7/10 Severe 7 d/yr ≥110°F today · 25 d/yr by 30 yrs out
- Wind 6/10 Major 74% chance of damaging wind over 30 yrs
- Air quality 1/10 Low 0 unhealthy d/yr today · 0 by 30 yrs out
Nearby sold comps map
Loading sold comps map…
Walkable amenities ~0.75 mi
Loading nearby amenities…
Taxation est. · year 1
- Rental income
- $14,360
- − Mortgage interest
- −$7,276
- − Property taxes
- −$1,364
- − Insurance
- −$650
- − Repairs & maintenance
- −$1,149
- − Management
- −$1,149
- − Depreciation
- −$3,779
- Taxable loss
- −$1,007
- Est. tax savings @ 24.0%
- +$242
- After-tax cash flow
- $1,398/yr
For passive investors: Depreciation is non-cash, so a rental often shows a tax loss while cash-flowing — sheltering income. Rental losses are passive: they offset passive income freely, and up to $25,000/yr can offset ordinary (W-2) income if you actively participate and your MAGI is under $100k (phasing out to $0 by $150k); unused losses carry forward. On sale, claimed depreciation is recaptured at up to 25%, and gains may owe capital-gains tax (a 1031 exchange can defer both). Figures are a year-1 estimate at your 24.0% rate — not tax advice; consult a CPA.
Schools (NCES district)
- District
- Cayuga ISD
- NCES district ID
- 4813200
- Math proficiency
- 66% ▼ -4.00%
- Reading proficiency
- 62% ▲ 3.00%
- Median HH income
- $46,640
- Composite
- 54.1/100
- National rank
- #1387
- State rank
- #44 of 826 in TX
Livability — Palestine
- Score
- 66/100
- State rank
- #657
- US rank
- #12357
Category grades
Schools grade is shown separately in the Schools card above.
Census & demographics
- City population
- 17,531
- Population (ZIP)
- 1,225
Population outlook (Anderson County) Hauer SSP2
- Today (2025)
- 56,663 people
- By 2030
- 57,373 · +1.3%
- By 2040
- 58,960 · +4.1%
- By 2050
- 59,073 · +4.3%
- By 2075
- 53,737 · -5.2%
- By 2100
- 42,516 · -25.0%
Race, ethnicity, and origin ACS 2023
- Neighborhood character
- Diverse neighborhood (Simpson 0.59)
- Race & ethnicity
- White 63% Two or more races 24% Black 11% Hispanic / Latino 6% Asian 1%
- Hispanic origin (detail)
- Mexican 6%
- Common ancestry
- Lithuanian 7% Slovak 1%
- Foreign-born
- 2% · Philippines
- Languages at home
- 94% English-only · Spanish 3% Other Asian/Pacific 1%
Political lean MEDSL · Anderson
- 2024 margin
- Solid R (+61.8) · D 18.8% · R 80.6%
- 2008→2024 swing
- -18.3pp toward R · 2008: -43.5pp · 2024: -61.8pp
- All cycles
- 2024: R+61.8 2020: R+58.0 2016: R+58.1 2012: R+52.2 2008: R+43.5
Not yet ingested
- Civics
- —
Market trends
- HPI YoY
- ▲ 2.85%
- Current HPI
- 106.7631
- Rent YoY
- —
- Metro
- —
- State GDP YoY
- ▲ 3.95%
- F500 in state
- 110
Industry mix (Fortune 500 HQ in TX)
| Industry | F500 HQs | Revenue |
|---|---|---|
| Energy | 16 | $1,198B |
|
||
| Technology | 5 | $198B |
|
||
| Engineering / Construction | 4 | $72B |
|
||
| Energy Services | 3 | $60B |
|
||
| Utilities | 3 | $41B |
|
||
| Healthcare | 2 | $330B |
|
||
Price history
2 events — show timeline
- 2026-05-26 Listed $129,900 NTREIS
- 2007-03-23 Sold (Public Records) — Public Records
Property tax history
+1.7%/yrLatest (2025): $1,364 · -2.4% YoY. Source: county tax records.
Cash-flow waterfall
monthlySold comps — $/sqft
last 12 mo · ≤1 miLoading sold comps…