 Duplex
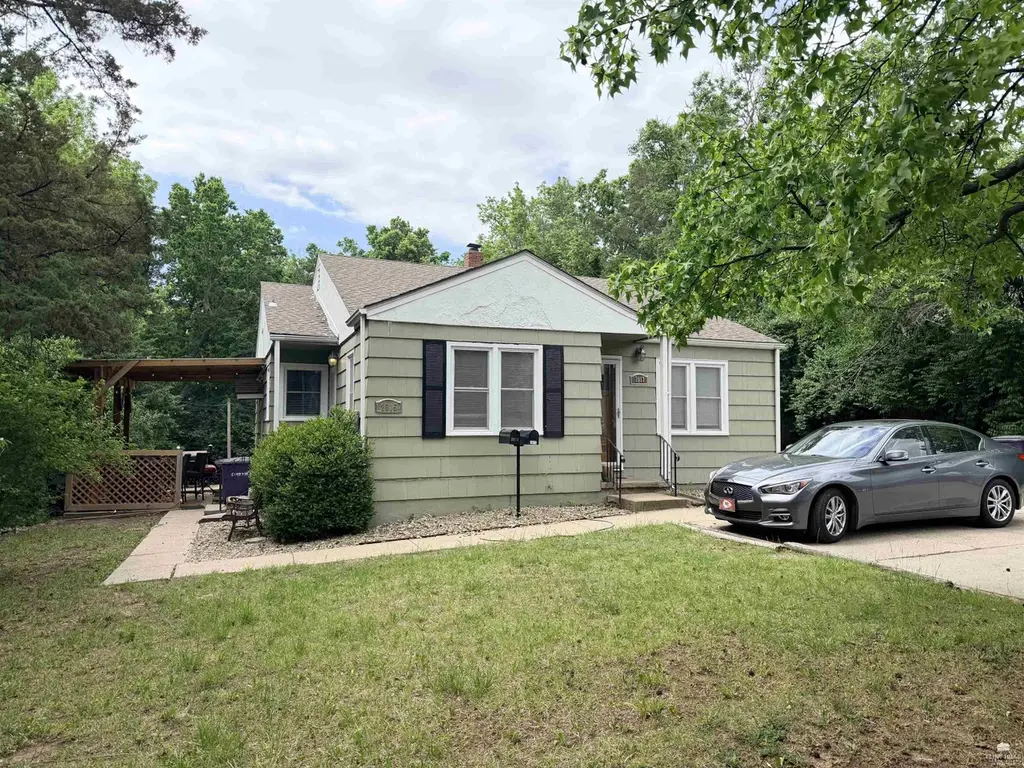
2015/2017 Anderson Ave · Manhattan, KS
Flood risk 1/10 · Minimal
- FEMA flood zone
- X (unshaded)
- Chance of flooding over 30 yrs
- 0.0%
- Est. flood insurance / yr
- $473 – $860
Fire risk 3/10 · Minor
- Est. fire insurance / yr
- $1,154 – $2,142
Heat risk 4/10 · Minor
- Hot days now (above 107°F)
- 7 days/yr
- Hot days in 30 yrs
- 16 days/yr
Wind risk 2/10 · Minimal
- Chance of severe wind over 30 yrs
- —
Air-quality risk 2/10 · Minimal
- Unhealthy air days now
- 2 days/yr
- Unhealthy air days in 30 yrs
- 2 days/yr
Risk factors via First Street. Map © Google.
Why this score? — see what drove the C- grade
The composite is a weighted blend of 9 inputs, each scored 0–100. Each bar is that input's sub-score; the figure is the points it added to the 100-point composite (weight × sub-score).
- Cash flow +19.3/30.0
- ARV discount +7.5/15.0
- DSCR +6.1/10.0
- 1% rule +5.0/10.0
- Livability +4.2/5.0
- Rent growth +4.0/5.0
- Schools +3.6/10.0
- Condition / age +2.5/5.0
- Appreciation +0.0/10.0
$199,500
🖨 Deal sheet (PDF) 📄 Offer letter ✓ Due diligence
Multi-family units
County records classify this as Multi-Family (2-4 Unit). Listing-text estimate: 2 units. confirmed
Key facts
- Duplex for sale
- Double garage
- Steady rental income
Tags
Property features AI
Finance
- Financial info: Reported rents: one unit at $900/month and the other at $850/month
Exterior
- Utilities: Public water; Public sewer
- Home design: Residential income property (duplex); Both sides of a duplex
- Construction: Construction materials: Unknown
- Exterior features: Covered patio/porch; No fencing
Interior
- Bedrooms: One unit has 3 bedrooms; Second unit has 2 bedrooms
- Bathrooms: Four full bathrooms total; Unit with 3 bedrooms has 2 bathrooms; Unit with 2 bedrooms has 2 bathrooms
- Heating & cooling: Central air conditioning; Natural gas heating
- Interior features: Finished basement
Neighborhood map
What this means for you Summary
Snapshot
- This is a 2 × 2-bed/1-bath units multifamily listed at $200k.
Deal economics
- At list price, monthly cash flow is $220 ($3k/yr) — positive. Per door: $110/mo.
- The deal already cash-flows at list — no discount required.
- Meets the 1% rule at list price ($2k rent vs $200k).
Location & tenants
- Location reads 83/100 on livability (#6 in KS, #979 nationally) — a professional / high-income tenant draw. Strengths: amenities A+, commute A+, cost of living A+; Watch: crime C-, employment C-.
- Manhattan-Ogden (urban): math 39% / reading 46% proficiency, ranked #26 of 169 in KS (top 15%) — families likely to look elsewhere, expect single-tenant / working-renter base with shorter leases.
- Market conditions: Rents rising fast (+6.0%/yr); 340 active listings in the ZIP; 132 units permitted in Riley County in 2024 (35 in 5+ unit buildings).
- This rent runs 44% of the median local income ($55k/yr) — at the standard rent-burdened threshold; future hikes will face affordability resistance.
Forward outlook
- Local home prices are declining (-3.0%/yr); year-one equity from $1k of loan paydown is wiped out by about $6k of value loss. Plan a longer hold.
- Riley County population projected at +30% by 2050 — long-run rental-demand tailwind backs the buy-and-hold thesis.
Negotiation context
- Only 3 days on market — expect competitive offers; lowballing is unlikely to land.
- 3 sale attempts with the ask held roughly flat each time — persistent listings suggest the price (not the market) is what's stuck; bring a comps-based counter.
- Current owner paid $79k; list at $200k implies a 153% gain — meaningful room to come down on a strong offer.
Risks & watch-outs
- Watch-outs: built in 1940 — expect roof / HVAC / electrical / plumbing capex.
Questions for the listing agent
- Can we see the unit-by-unit rent roll, current vacancy, and any below-market leases? What's the average tenancy length?
- What capital expenditures (roof, boiler, parking lot, exteriors) have been made in the last 5 years, and what's planned in the next 2?
- Built in 1940 — when were the roof, HVAC, electrical panel, plumbing, and water heater last replaced?
- Is there a deadline driving the sale (1031 exchange, divorce, estate, relocation)? That informs how much negotiation room exists.
- What's the average days-on-market for RENTAL listings here right now (not sales)? A rising rental-DOM trend means longer vacancies and softer asking-rent achievability than the comps imply.
- What's the recent tenant-quality profile in this submarket — average credit score on applications, eviction rate, late-payment / NSF rate, and stable-employment percentage? A property-management company in the area should have these aggregated.
- How much new apartment / multifamily construction is in the pipeline within 1–3 miles? Heavy new supply (>2% of stock underway) typically softens rents 12–24 months out; light construction supports rent growth.
Investment metrics
- 1% rule
- 1.00% ✓
- Cap rate
- 7.62%
- Cash-on-cash
- 4.73%
- DSCR
- 1.21
- GRM
- 8.3
CMA / ARV
No comps found within radius.
Projected returns pro-forma
-3.0% appreciation · 6.02% rent growth · sell at horizon
- IRR
- -5.6%
- Equity multiple
- 0.78×
- Total profit
- $-12,031
- Equity at exit
- $29,746
- IRR
- 7.3%
- Equity multiple
- 1.63×
- Total profit
- $35,006
- Equity at exit
- $17,249
Cash invested: $55,860 (down + closing). Projections, not guarantees.
Landlord ↔ Tenant lean methodology
- Overall (STATE)
- 83 Strongly Landlord-Friendly
- State Kansas
- 83 Strongly Landlord-Friendly · R+10
- County
- — inherits STATE
- City
- — inherits STATE
ZIP-level market 66502
- Rents YoY
- 6.0%
- Active inventory
- 340
- Price-to-rent
- 16.6×
Monthly cashflow live
- Estimated rent
- $2,002 medium interval (Pro) →
- Mortgage (P&I)
- −$1,046
- Tax from tax record
- −$232 /mo · $2,788/yr
- Insurance
- −$83
- HOA
- −$0
- Vacancy / Maint / Mgmt
- −$420
- Net cashflow
- $220
Break-even live
Sensitivity live
| Price | -10% $333 | -5% $276 | +0% $220 | +5% $163 | +10% $107 |
|---|---|---|---|---|---|
| Rent | -10% $62 | -5% $141 | +0% $220 | +5% $299 | +10% $378 |
| Rate | -1.0pp $320 | -0.5pp $271 | base $220 | +0.5pp $168 | +1.0pp $116 |
2-unit breakdown (identical units grouped — click to expand)
| Units | Beds | Baths | Est. rent |
|---|---|---|---|
| 2× units | 2 | 1 | $2,002 |
| #1 | 2 | 1 | $1,001 |
| #2 | 2 | 1 | $1,001 |
| Total (2 units) | $2,002 | ||
UW: 25.0% down · 7.5% · 30yr · 1.5% tax · 5.0% vac · 8.0% maint · 8.0% mgmt
Financing live
Cash to close
- Down payment
- $49,875
- Closing costs
- $5,985
- Reserves months
- —
- Total cash needed
- —
Loan-product check · same deal, 3 products live
Conventional
25% down · 7.5% · 30yr
- Down + closing
- —
- Monthly P&I
- —
- Monthly cashflow
- —
- DSCR
- —
- Eligible?
- —
Personal DTI + credit; lowest rate.
DSCR
20% down · 8.5% · 30yr
- Down + closing
- —
- Monthly P&I
- —
- Monthly cashflow
- —
- DSCR
- —
- Eligible?
- —
No personal income docs; deal must DSCR.
Hard money
10% down · 12.0% · 12mo
- Down + closing
- —
- Monthly P&I
- —
- Monthly cashflow
- —
- DSCR
- —
- Eligible?
- —
Short-term bridge; refi at stabilization.
Listing history 6 events
-
2026-05-18status Pending
-
2026-05-14$199,500 Active
-
2026-05-14$199,500 Active
-
2025-06-14historical $1,200
-
2025-06-07$1,200
-
2000-01-01soldstatus $79,000
ⓘ Source: listings_history table (triggers on properties + properties_extension) + one-shot
backfill from property_details.listing_events for pre-trigger history.
Tax reassessment forecast KS · Resets to sale price
- Current annual tax
- $2,788 · $232/mo
- Projected year-2 tax
- $2,813 · $234/mo
- Expected delta
- +$25/yr (+$2/mo · 0.9%)
ⓘ Screening estimate from a state-policy table — verify with the county assessor before closing.
Climate risk First Street
- Flood 1/10 Low FEMA zone X (unshaded) · 0% chance over 30 yrs
- Wildfire 3/10 Moderate
- Heat 4/10 Moderate 7 d/yr ≥107°F today · 16 d/yr by 30 yrs out
- Wind 2/10 Low
- Air quality 2/10 Low 2 unhealthy d/yr today · 2 by 30 yrs out
Nearby sold comps map
Loading sold comps map…
Walkable amenities ~0.75 mi
Loading nearby amenities…
Taxation est. · year 1
- Rental income
- $24,024
- − Mortgage interest
- −$11,175
- − Property taxes
- −$2,788
- − Insurance
- −$998
- − Repairs & maintenance
- −$1,922
- − Management
- −$1,922
- − Depreciation
- −$5,804
- Taxable loss
- −$584
- Est. tax savings @ 24.0%
- +$140
- After-tax cash flow
- $2,780/yr
For passive investors: Depreciation is non-cash, so a rental often shows a tax loss while cash-flowing — sheltering income. Rental losses are passive: they offset passive income freely, and up to $25,000/yr can offset ordinary (W-2) income if you actively participate and your MAGI is under $100k (phasing out to $0 by $150k); unused losses carry forward. On sale, claimed depreciation is recaptured at up to 25%, and gains may owe capital-gains tax (a 1031 exchange can defer both). Figures are a year-1 estimate at your 24.0% rate — not tax advice; consult a CPA.
Schools (NCES district)
- District
- Manhattan-Ogden
- NCES district ID
- 2009180
- Math proficiency
- 39% ▼ -1.00%
- Reading proficiency
- 46% ▲ 1.00%
- Median HH income
- $44,001
- Composite
- 35.97/100
- National rank
- #4795
- State rank
- #26 of 169 in KS
Livability — Manhattan
- Score
- 83/100
- State rank
- #6
- US rank
- #979
Category grades
Schools grade is shown separately in the Schools card above.
Census & demographics
- Census place
- Manhattan, KS
- County
- Riley County · 62,662 people
- City population
- 60,966
- Metro
- Manhattan, KS
- Population (ZIP)
- 43,693
- Household income
- $54,833
- Rent vs Own
- Severe rent burden
- 3089.0
Population outlook (Riley County) Hauer SSP2
- Today (2025)
- 83,656 people
- By 2030
- 89,075 · +6.5%
- By 2040
- 99,100 · +18.5%
- By 2050
- 109,146 · +30.5%
- By 2075
- 134,178 · +60.4%
- By 2100
- 153,653 · +83.7%
Race, ethnicity, and origin ACS 2023
- Neighborhood character
- Predominantly White (78%)
- Race & ethnicity
- White 78% Hispanic / Latino 9% Two or more races 8% Black 4% Asian 3% Native American 1%
- Hispanic origin (detail)
- Mexican 6%
- Common ancestry
- Slovak 3% Italian 3% Lithuanian 2%
- Foreign-born
- 8% · Canada, China
- Languages at home
- 91% English-only · Spanish 5% Other Indo-European 2% Chinese 1%
Political lean MEDSL · Riley
- 2024 margin
- Toss-up / Even · D 49.6% · R 47.8% · Other 2.5%
- 2008→2024 swing
- +8.8pp toward D · 2008: -7.0pp · 2024: 1.8pp
- All cycles
- 2024: D+1.8 2020: D+3.2 2016: R+4.5 2012: R+12.7 2008: R+7.0
Not yet ingested
- Civics
- —
Market trends
- HPI YoY
- ▼ -283.54%
- Current HPI
- 172.7795
- Rent YoY
- ▲ 6.02%
- Metro
- Manhattan, KS
- State GDP YoY
- —
- F500 in state
- 0
Price history
+152.5% since first listed6 events — show timeline
- 2026-05-18 Pending — FHAOR as distributed by MLS GRID
- 2026-05-14 Listed $199,500 FHAOR as distributed by MLS GRID
- 2026-05-14 Listed $199,500 FHAOR as distributed by MLS GRID
- 2025-06-14 Rental Removed $1,200 APPFOLIO
- 2025-06-07 Listed for Rent $1,200 APPFOLIO
- 2000-01-01 Sold (Public Records) $79,000 Public Records
Property tax history
+3.2%/yrLatest (2025): $2,788 · +1.6% YoY. Source: county tax records.
Cash-flow waterfall
monthlySold comps — $/sqft
last 12 mo · ≤1 miLoading sold comps…