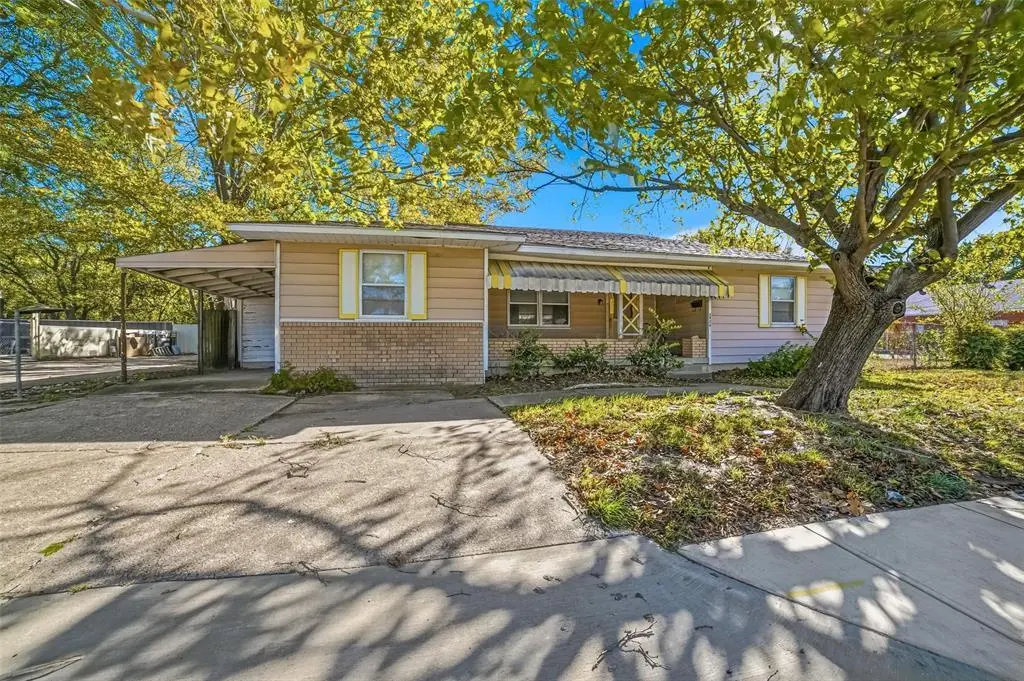
2926 N Prairie Creek Rd · Dallas, TX
Flood risk 1/10 · Minimal
- FEMA flood zone
- X (unshaded)
- Chance of flooding over 30 yrs
- 0.0%
- Est. flood insurance / yr
- $507 – $1,088
Fire risk 1/10 · Minimal
- Est. fire insurance / yr
- $1,222 – $2,270
Heat risk 7/10 · Major
- Hot days now (above 110°F)
- 7 days/yr
- Hot days in 30 yrs
- 24 days/yr
Wind risk 6/10 · Moderate
- Chance of severe wind over 30 yrs
- 27.0%
Air-quality risk 2/10 · Minimal
- Unhealthy air days now
- 2 days/yr
- Unhealthy air days in 30 yrs
- 2 days/yr
Risk factors via First Street. Map © Google.
Why this score? — see what drove the D grade
The composite is a weighted blend of 9 inputs, each scored 0–100. Each bar is that input's sub-score; the figure is the points it added to the 100-point composite (weight × sub-score).
- ARV discount +15.0/15.0
- Cash flow +8.7/30.0
- Livability +4.0/5.0
- 1% rule +3.6/10.0
- Schools +2.8/10.0
- Condition / age +2.5/5.0
- DSCR +2.4/10.0
- Rent growth +2.4/5.0
- Appreciation +0.0/10.0
$199,000
🖨 Deal sheet (PDF) 📄 Offer letter ✓ Due diligence
Listing remarks
Step inside this beautifully remodeled 3-bedroom, 2-bath home offering 1,602 sq. ft. of stylish living space. The open-concept layout features new flooring throughout and a sleek, modern kitchen complete with a gas range and contemporary finishes. Spacious bedrooms provide generous closet space, ensuring comfort and functionality for the whole family. Nestled in a well-established neighborhood, this home offers an easy commute to downtown Dallas—perfect for those seeking both convenience and charm. With recent upgrades and attention to detail, this move-in-ready home is a true standout. Don’t miss your opportunity to make this gem yours!
Key facts
- 7,797 sq ft lot
- Parking
- Built 1962
Property features AI
Finance
- Other: Listing status: Active; Possession at closing/funding; Exclusive right to sell listing agreement
- Financial info: Treat as clear loan type; No second mortgage
- HOA & community: No association
Exterior
- Parking: Driveway; 1 covered parking space; 1 carport space; No garage spaces
- Security: No smart home features
- Utilities: City water; City sewer; Not in a municipal utility district
- Home design: Single family residence; Residential property; Property attached: Yes; Built in 1962
- Construction: Built in 1962
- Exterior features: Lot smaller than 0.5 acre; Subdivision: PRAIRIE CREEK RD 335.6FR SCYENE
Interior
- Kitchen: Other appliances
- Bedrooms: 3 bedrooms; Primary bedroom on main level
- Flooring: No flooring details provided
- Bathrooms: 2 full bathrooms
- Heating & cooling: No heating or cooling details provided
- Interior features: One-level layout; One living area; One dining area; Other interior features
- Laundry & utility: No specific laundry details provided
Neighborhood map
What this means for you Summary
Snapshot
- This is a 2-bed/1.0-bath single-family listed at $199k.
Deal economics
- At list price, monthly cash flow is $-166 ($-2k/yr) — negative.
- To cash-flow at today's rent, offer at most $170k (14.7% below list).
- To meet the 1% rule (rent ≥ 1% of price), the offer needs to be $172k (13.6% below list).
- Recommended offer: $170k (14.7% below list) — sets the bar for cash-flow.
- Cap rate 5.3% vs local median 2.3% in Dallas — top-decile yield for the area; either an underpriced asset or a hidden risk that comps aren't pricing in. Stress-test before assuming the spread holds.
Location & tenants
- Location reads 81/100 on livability (#24 in TX, #1,380 nationally) — a professional / high-income tenant draw. Strengths: amenities A+, commute A+, housing A+; Watch: crime F.
- Dallas ISD (urban): math 31% / reading 36% proficiency, ranked #559 of 826 in TX (top 68%) — families likely to look elsewhere, expect single-tenant / working-renter base with shorter leases; 83% free/reduced lunch — lower-income household profile, screen leases tightly.
- Zoned schools: Annie Webb Blanton El (math 45% / reading 41%, grade F, #1,283 of 4,322 statewide, top 30%, 663 students, 95% FRL); Piedmont Global Academy (math 21% / reading 20%, grade F, #1,407 of 1,662 statewide, top 86%, 784 students, 96% FRL); W W Samuell H S (math 24% / reading 25%, grade F, #1,264 of 1,632 statewide, top 82%, 1,871 students, 95% FRL).
- Market conditions: Rents soft (-0.4%/yr); 181 active listings in the ZIP; 34 comparable units currently listed for rent nearby; rentals at typical pace (median 27d on market — plan ~3-4 weeks tenant-placement turnaround); 44% of comp listings sitting > 30 days — soft ceiling on asking rent; 12,577 units permitted in Dallas County in 2024 (6,829 in 5+ unit buildings).
- This rent runs 32% of the median local income ($64k/yr) — at the standard rent-burdened threshold; future hikes will face affordability resistance.
Forward outlook
- Local home prices are declining (-3.0%/yr); year-one equity from $1k of loan paydown is wiped out by about $6k of value loss. Plan a longer hold.
- Dallas County population projected at +35% by 2050 — long-run rental-demand tailwind backs the buy-and-hold thesis.
Negotiation context
- It's been on market 45 days — a 3% lower offer ($193k) is reasonable based on typical stale-listing flexibility.
- 3 sale attempts since 2y ago with the ask held roughly flat each time — persistent listings suggest the price (not the market) is what's stuck; bring a comps-based counter.
Risks & watch-outs
- Climate carrying-cost: major wind risk, 27% chance of damaging wind over 30y; extreme-heat days projected 7→24/yr by 2055 (HVAC capex compounding) — expect insurance premiums to compound above CPI over the hold.
Questions for the listing agent
- What do current leases actually rent for vs. the listed asking? Can we see a recent rent roll and the last 12 months of T-12 income?
- It's been on market 45 days. Have you received any prior offers? Is the seller open to a 15% concession, seller financing, or rate buy-down credit?
- Built in 1962 — when were the roof, HVAC, electrical panel, plumbing, and water heater last replaced?
- Is there a deadline driving the sale (1031 exchange, divorce, estate, relocation)? That informs how much negotiation room exists.
- Crime grade is F in this area — have there been break-ins, vandalism, or insurance claims at this property in the last 3 years? What carrier currently insures it and at what premium?
- The area grade is low — what's the realistic commute time and amenity access for the typical tenant pool here? Any planned neighborhood developments (good or bad) we should know about?
- What's the average days-on-market for RENTAL listings here right now (not sales)? A rising rental-DOM trend means longer vacancies and softer asking-rent achievability than the comps imply.
- What's the recent tenant-quality profile in this submarket — average credit score on applications, eviction rate, late-payment / NSF rate, and stable-employment percentage? A property-management company in the area should have these aggregated.
- How much new for-sale + rental construction is in the pipeline within 1–3 miles? Heavy new supply typically softens prices + rents 12–24 months out; constrained supply supports both.
Investment metrics
- 1% rule
- 0.86% ✗
- Cap rate
- 5.29%
- Cash-on-cash
- -3.57%
- DSCR
- 0.84
- GRM
- 9.6
CMA / ARV
- ARV (median comp)
- $262,724
- List price
- $199,000
- Delta
- -24.25%
- Verdict
- UNDERPRICED
- Comps
- 20 within 1.0 mi
Show comp detail 12 sales within ~0.75 mi
| Address | Dist | Beds/Ba | Sqft | Sold | Price | $/sf | Match |
|---|---|---|---|---|---|---|---|
| 2933 Curvilinear Ct | 0.19mi | 3/2.0 (+1) | 1,467 (-8%) | 4mo | $259,999 | $177 | 65 |
| 9419 Briggs St | 0.31mi | 3/2.0 (+1) | 1,488 (-7%) | 1mo | $350,000 | $235 | 64 |
| 3726 Cypress Ave | 0.53mi | 3/2.0 (+1) | 1,568 (-2%) | 1mo | $269,990 | $172 | 62 |
| 8706 Reva St | 0.62mi | 3/2.0 (+1) | 1,590 (-1%) | 2mo | $187,500 | $118 | 60 |
| 9229 Bentham Ct | 0.59mi | 3/2.0 (+1) | 1,638 (+2%) | 1mo | $240,000 | $147 | 59 |
| 9239 Jennie Lee Ln | 0.46mi | 3/2.0 (+1) | 1,564 (-2%) | 9mo | $280,000 | $179 | 58 |
| 3726 Saddleback Dr | 0.71mi | 3/2.0 (+1) | 1,614 (+1%) | 6mo | $265,000 | $164 | 51 |
| 8558 Bearden St | 0.58mi | 3/2.0 (+1) | 1,482 (-8%) | 9mo | $285,000 | $192 | 44 |
| 8610 Cedar Post Ct | 0.64mi | 3/2.0 (+1) | 1,684 (+5%) | 10mo | $275,000 | $163 | 44 |
| 9431 Jill Ln | 0.57mi | 3/2.0 (+1) | 1,415 (-12%) | 2mo | $166,000 | $117 | 43 |
| 8627 Cedar Post Ct | 0.64mi | 3/2.0 (+1) | 1,398 (-13%) | 4mo | $263,000 | $188 | 36 |
| 9638 Briggs St | 0.63mi | 3/2.0 (+1) | 1,367 (-15%) | 3mo | $245,000 | $179 | 34 |
Match score weights: distance 35% · size 25% · config 20% · recency 20%. Top-matched comps best support the ARV.
Projected returns pro-forma
-3.0% appreciation · 0.0% rent growth · sell at horizon
- IRR
- -26.1%
- Equity multiple
- 0.14×
- Total profit
- $-47,734
- Equity at exit
- $29,672
- IRR
- -39.3%
- Equity multiple
- -0.33×
- Total profit
- $-74,164
- Equity at exit
- $17,206
Cash invested: $55,720 (down + closing). Projections, not guarantees.
Landlord ↔ Tenant lean methodology
- Overall (STATE)
- 87 Strongly Landlord-Friendly
- State Texas
- 87 Strongly Landlord-Friendly · R+5
- County
- — inherits STATE
- City
- — inherits STATE
ZIP-level market 75227
- Home prices YoY
- -30.9%
- Rents YoY
- -0.4%
- Active inventory
- 181
- Price-to-rent
- 9.6×
Monthly cashflow live
- Estimated rent
- $1,719 high interval (Pro) →
- Mortgage (P&I)
- −$1,044
- Tax from tax record
- −$397 /mo · $4,769/yr
- Insurance
- −$83
- HOA
- −$0
- Vacancy / Maint / Mgmt
- −$361
- Net cashflow
- $-166
Break-even live
Sensitivity live
| Price | -10% $-53 | -5% $-110 | +0% $-166 | +5% $-222 | +10% $-279 |
|---|---|---|---|---|---|
| Rent | -10% $-302 | -5% $-234 | +0% $-166 | +5% $-98 | +10% $-30 |
| Rate | -1.0pp $-66 | -0.5pp $-115 | base $-166 | +0.5pp $-217 | +1.0pp $-270 |
UW: 25.0% down · 7.5% · 30yr · 1.5% tax · 5.0% vac · 8.0% maint · 8.0% mgmt
Financing live
Cash to close
- Down payment
- $49,750
- Closing costs
- $5,970
- Reserves months
- —
- Total cash needed
- —
Loan-product check · same deal, 3 products live
Conventional
25% down · 7.5% · 30yr
- Down + closing
- —
- Monthly P&I
- —
- Monthly cashflow
- —
- DSCR
- —
- Eligible?
- —
Personal DTI + credit; lowest rate.
DSCR
20% down · 8.5% · 30yr
- Down + closing
- —
- Monthly P&I
- —
- Monthly cashflow
- —
- DSCR
- —
- Eligible?
- —
No personal income docs; deal must DSCR.
Hard money
10% down · 12.0% · 12mo
- Down + closing
- —
- Monthly P&I
- —
- Monthly cashflow
- —
- DSCR
- —
- Eligible?
- —
Short-term bridge; refi at stabilization.
Rent comps 34 comps
| Address | Beds | Baths | Sqft | Rent | $/sqft | DOM | Units | Dist |
|---|---|---|---|---|---|---|---|---|
| 9456 Culberson St Dallas, TX | 3.0 | 2.0 | 1170 | $1,800 | $1.54 | 45d | 1 | 0.41mi |
| 9575 Gonzales Dr Dallas, TX | 2.0 | 2.0 | 1259 | $1,450 | $1.15 | 16d | 1 | 0.58mi |
| 8534 Bearden Ln Dallas, TX | 3.0 | 2.0 | 1332 | $1,600 | $1.20 | 26d | 1 | 0.64mi |
| 8609 Jennie Lee Ln Dallas, TX | 3.0 | 2.0 | 1863 | $2,300 | $1.23 | 7d | 1 | 0.68mi |
| 9740 Stonewood Dr Dallas, TX | 3.0 | 2.0 | 1250 | $1,961 | $1.57 | 8d | 1 | 0.73mi |
| 9415 Rutherglen Dr Dallas, TX | 3.0 | 2.0 | 1334 | $1,850 | $1.39 | 9d | 1 | 0.78mi |
| 3509 Apple Valley Way Dallas, TX | 3.0 | 2.5 | 1653 | $2,300 | $1.39 | 45d | 1 | 0.78mi |
| 9467 Olde Towne Row Dallas, TX | 2.0 | 1.5 | 1110 | $975 | $0.88 | 45d | 1 | 0.79mi |
| 9503 Olde Towne Row Dallas, TX | 2.0 | 2.5 | 1140 | $1,350 | $1.18 | 45d | 1 | 0.80mi |
| 9911 Crystal Valley Way Dallas, TX | 3.0 | 2.0 | 1192 | $1,750 | $1.47 | 26d | 1 | 0.82mi |
| 2198 Aspen Dr Dallas, TX | 2.0 | 1.5 | 1110 | $1,300 | $1.17 | 1d | 1 | 0.85mi |
| 2198 Aspen Dr Dallas, TX | 2.0 | 1.5 | 1110 | $1,300 | $1.17 | 6d | 1 | 0.85mi |
| 9913 Chilmark Way Dallas, TX | 3.0 | 2.5 | 1777 | $2,255 | $1.27 | 45d | 1 | 0.85mi |
| 2194 Aspen Dr Dallas, TX | 2.0 | 1.5 | 1110 | $1,200 | $1.08 | 9d | 1 | 0.85mi |
| 4051 Renee Dr Dallas, TX | 2.0 | 1.0 | 1056 | $2,050 | $1.94 | 45d | 1 | 0.88mi |
| 9415 Bruton Rd Dallas, TX | 1.0–3.0 | 1.0–2.0 | 885 | $924 | $1.04 | 45d | 1 | 0.95mi |
| 4116 O B Crowe Dr Dallas, TX | 3.0 | 2.0 | 1516 | $2,115 | $1.40 | 45d | 1 | 0.99mi |
| 10212 Hillhouse Ln Dallas, TX | 2.0 | 1.0 | 1183 | $1,499 | $1.27 | 9d | 1 | 1.14mi |
| 2708 Briarbank Cir Dallas, TX | 3.0 | 2.0 | 1349 | $1,840 | $1.36 | 5d | 1 | 1.16mi |
| 10236 Hillhouse Ln Dallas, TX | 3.0 | 2.0 | 1323 | $1,600 | $1.21 | 45d | 1 | 1.18mi |
| 10348 Wood Heights Dr Dallas, TX | 3.0 | 2.5 | 1358 | $2,000 | $1.47 | 45d | 1 | 1.18mi |
| 10216 Blackjack Oaks Dr Dallas, TX | 3.0 | 2.0 | 1453 | $1,860 | $1.28 | 1d | 1 | 1.21mi |
| 1937 Red Cloud Dr Dallas, TX | 3.0 | 2.0 | 1196 | $1,695 | $1.42 | 45d | 1 | 1.26mi |
| 101 Crystalwood Dr Mesquite, TX | 3.0 | 2.0 | 1500 | $2,090 | $1.39 | 22d | 1 | 1.29mi |
| 9921 Cedar Mountain Cir Dallas, TX | 3.0 | 2.0 | 1202 | $1,895 | $1.58 | 45d | 1 | 1.30mi |
| 9645 Limestone Dr Dallas, TX | 3.0 | 2.0 | 1178 | $2,000 | $1.70 | 45d | 1 | 1.30mi |
| 2540 Prichard Ln Dallas, TX | 3.0 | 2.0 | 1888 | $2,475 | $1.31 | 26d | 1 | 1.33mi |
| 10340 Blackjack Oaks Dr Dallas, TX | 3.0 | 2.0 | 1182 | $1,650 | $1.40 | 0d | 1 | 1.35mi |
| 10340 Blackjack Oaks Dr Dallas, TX | 3.0 | 2.0 | 1182 | $1,650 | $1.40 | 1d | 1 | 1.35mi |
| 1939 Naira Dr Dallas, TX | 3.0 | 2.0 | 1415 | $1,850 | $1.31 | 45d | 1 | 1.37mi |
| 2703 Oak Bend Ln Dallas, TX | 3.0 | 2.0 | 1611 | $2,035 | $1.26 | 45d | 1 | 1.38mi |
| 2315 Summit Ln Dallas, TX | 3.0 | 2.0 | 1200 | $1,800 | $1.50 | 9d | 1 | 1.43mi |
| 2041 New Haven Dr Dallas, TX | 3.0 | 1.5 | 1362 | $1,720 | $1.26 | 19d | 1 | 1.44mi |
| 2722 Spiceberry Ln Mesquite, TX | 3.0 | 2.0 | 1270 | $2,085 | $1.64 | 5d | 1 | 1.44mi |
Listing history 23 events
-
2026-06-21days on market $199,000 Active 45 DOM
-
2026-06-18days on market $199,000 Active 42 DOM
-
2026-06-17days on market $199,000 Active 41 DOM
-
2026-06-16days on market $199,000 Active 40 DOM
-
2026-06-15days on market $199,000 Active 39 DOM
-
2026-06-13days on market $199,000 Active 37 DOM
-
2026-06-09days on market $199,000 Active 33 DOM
-
2026-06-08days on market $199,000 Active 32 DOM
-
2026-06-07days on market $199,000 Active 31 DOM
-
2026-06-04days on market $199,000 Active 28 DOM
-
2026-06-03days on market $199,000 Active 27 DOM
-
2026-06-02days on market $199,000 Active 26 DOM
-
2026-06-01days on market $199,000 Active 25 DOM
-
2026-05-31days on market $199,000 Active 24 DOM
-
2026-05-07$199,000 Active 657-char remark
-
2026-04-30historical
-
2026-02-04price $209,000
-
2025-12-04price $219,500
-
2025-10-30$230,000 Active
-
2024-12-31historical
-
2024-09-23price $258,000
-
2024-05-20price $268,000
-
2024-04-04$298,000 Active
ⓘ Source: listings_history table (triggers on properties + properties_extension) + one-shot
backfill from property_details.listing_events for pre-trigger history.
Tax reassessment forecast TX · Resets to sale price
- Current annual tax
- $4,769 · $397/mo
- Projected year-2 tax
- $4,769 · $397/mo
- Expected delta
- $0/yr ($0/mo · 0.0%)
ⓘ Screening estimate from a state-policy table — verify with the county assessor before closing.
Climate risk First Street
- Flood 1/10 Low FEMA zone X (unshaded) · 0% chance over 30 yrs
- Wildfire 1/10 Low
- Heat 7/10 Severe 7 d/yr ≥110°F today · 24 d/yr by 30 yrs out
- Wind 6/10 Major 27% chance of damaging wind over 30 yrs
- Air quality 2/10 Low 2 unhealthy d/yr today · 2 by 30 yrs out
Nearby sold comps map
Loading sold comps map…
Walkable amenities ~0.75 mi
Loading nearby amenities…
Taxation est. · year 1
- Rental income
- $20,628
- − Mortgage interest
- −$11,147
- − Property taxes
- −$4,769
- − Insurance
- −$995
- − Repairs & maintenance
- −$1,650
- − Management
- −$1,650
- − Depreciation
- −$5,789
- Taxable loss
- −$5,373
- Est. tax savings @ 24.0%
- +$1,289
- After-tax cash flow
- $-701/yr
For passive investors: Depreciation is non-cash, so a rental often shows a tax loss while cash-flowing — sheltering income. Rental losses are passive: they offset passive income freely, and up to $25,000/yr can offset ordinary (W-2) income if you actively participate and your MAGI is under $100k (phasing out to $0 by $150k); unused losses carry forward. On sale, claimed depreciation is recaptured at up to 25%, and gains may owe capital-gains tax (a 1031 exchange can defer both). Figures are a year-1 estimate at your 24.0% rate — not tax advice; consult a CPA.
Schools (NCES district)
- District
- Dallas ISD
- NCES district ID
- 4816230
- Math proficiency
- 31% ▼ -16.00%
- Reading proficiency
- 36% ▼ -4.00%
- Median HH income
- $42,881
- Composite
- 28.41/100
- National rank
- #6763
- State rank
- #559 of 826 in TX
Livability — Dallas
- Score
- 81/100
- State rank
- #24
- US rank
- #1380
Category grades
Schools grade is shown separately in the Schools card above.
Census & demographics
- Census place
- Dallas, TX
- County
- Dallas County · 2,612,404 people
- City population
- 1,168,437
- Metro
- Dallas-Fort Worth-Arlington, TX
- Population (ZIP)
- 58,319
- Household income
- $64,008
- Rent vs Own
- Severe rent burden
- 1679.0
Population outlook (Dallas County) Hauer SSP2
- Today (2025)
- 2,979,839 people
- By 2030
- 3,191,823 · +7.1%
- By 2040
- 3,619,611 · +21.5%
- By 2050
- 4,026,915 · +35.1%
- By 2075
- 4,957,073 · +66.4%
- By 2100
- 5,508,725 · +84.9%
Race, ethnicity, and origin ACS 2023
- Neighborhood character
- Majority Hispanic (62%)
- Race & ethnicity
- Hispanic / Latino 62% Two or more races 35% Black 28% White 8%
- Hispanic origin (detail)
- Mexican 56%
- Foreign-born
- 27% · Canada, Vietnam
- Languages at home
- 44% English-only · Spanish 55%
Political lean MEDSL · Dallas
- 2024 margin
- Strong D (+22.2) · D 60.2% · R 38.0% · Other 1.8%
- 2008→2024 swing
- +6.9pp toward D · 2008: 15.3pp · 2024: 22.2pp
- All cycles
- 2024: D+22.2 2020: D+31.6 2016: D+26.2 2012: D+15.4 2008: D+15.3
Not yet ingested
- Civics
- —
Market trends
- HPI YoY
- ▼ -148.56%
- Current HPI
- 332.3303
- Rent YoY
- ▼ -0.36%
- Metro
- Dallas-Fort Worth-Arlington, TX
- State GDP YoY
- ▲ 3.95%
- F500 in state
- 110
Industry mix (Fortune 500 HQ in TX)
| Industry | F500 HQs | Revenue |
|---|---|---|
| Energy | 16 | $1,198B |
|
||
| Technology | 5 | $198B |
|
||
| Engineering / Construction | 4 | $72B |
|
||
| Energy Services | 3 | $60B |
|
||
| Utilities | 3 | $41B |
|
||
| Healthcare | 2 | $330B |
|
||
Price history
-33.2% since first listed9 events — show timeline
- 2026-05-07 Listed $199,000 NTREIS
- 2026-04-30 Listing Removed — NTREIS
- 2026-02-04 Price Changed $209,000 NTREIS
- 2025-12-04 Price Changed $219,500 NTREIS
- 2025-10-30 Listed $230,000 NTREIS
- 2024-12-31 Listing Removed — NTREIS
- 2024-09-23 Price Changed $258,000 NTREIS
- 2024-05-20 Price Changed $268,000 NTREIS
- 2024-04-04 Listed $298,000 NTREIS
Property tax history
+6.1%/yrLatest (2025): $4,769 · -13.9% YoY. Source: county tax records.
Cash-flow waterfall
monthlySold comps — $/sqft
last 12 mo · ≤1 miLoading sold comps…