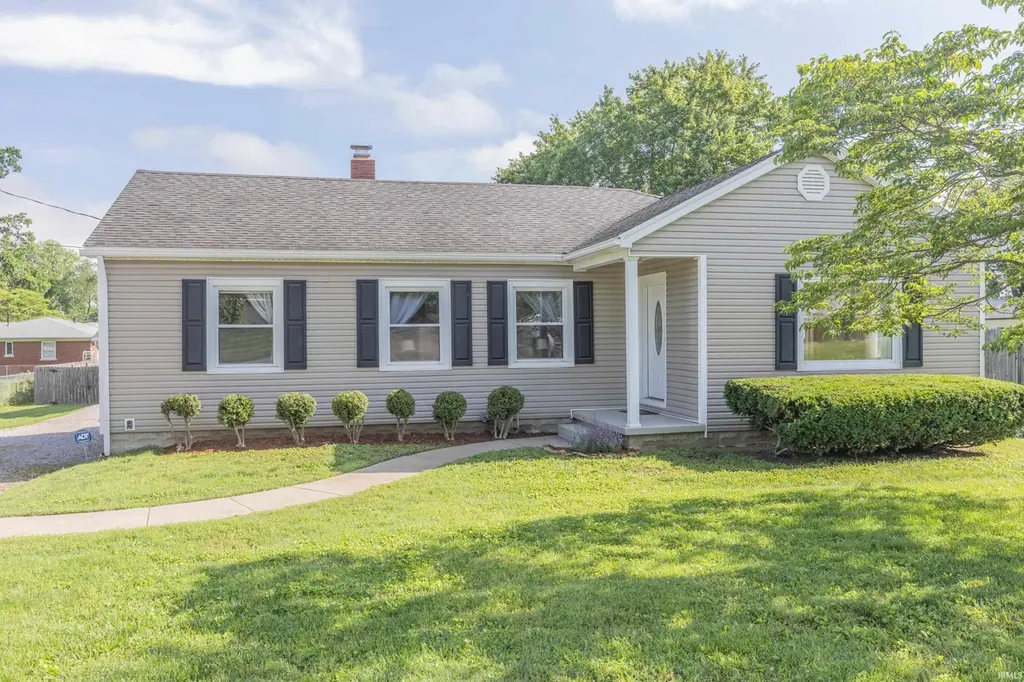
10100 State Road 662 Rd · Newburgh, IN
Flood risk 1/10 · Minimal
- FEMA flood zone
- X (unshaded)
- Chance of flooding over 30 yrs
- 0.0%
- Est. flood insurance / yr
- $473 – $860
Fire risk 1/10 · Minimal
- Est. fire insurance / yr
- $717 – $1,331
Heat risk 5/10 · Moderate
- Hot days now (above 106°F)
- 7 days/yr
- Hot days in 30 yrs
- 19 days/yr
Wind risk 2/10 · Minimal
- Chance of severe wind over 30 yrs
- 4.0%
Air-quality risk 4/10 · Minor
- Unhealthy air days now
- 4 days/yr
- Unhealthy air days in 30 yrs
- 6 days/yr
Risk factors via First Street. Map © Google.
Why this score? — see what drove the D grade
The composite is a weighted blend of 9 inputs, each scored 0–100. Each bar is that input's sub-score; the figure is the points it added to the 100-point composite (weight × sub-score).
- ARV discount +15.0/15.0
- Cash flow +7.1/30.0
- Schools +4.9/10.0
- Rent growth +4.7/5.0
- Livability +4.0/5.0
- Condition / age +2.5/5.0
- DSCR +1.3/10.0
- 1% rule +0.8/10.0
- Appreciation +0.0/10.0
$279,900
🖨 Deal sheet 📄 Offer letter ✓ Due diligence
Listing remarks MLS
Beautifully updated 2-3 bedroom ranch home on a large . 40 acre fenced lot. This home offers a spacious open floor plan with a large living room with wood floors. The updated kitchen opens up to an eating area and a cozy family room with a fireplace. 2 bedrooms and spacious full bath as well as a half bath on the main level. The basement has a large bedroom, utility room and large closet for extra storage. There is 2 car carport with storage and a huge deck overlooking the yard. Fence has double gate for access to put an RV or boat in the back yard.
Key facts
- Large deck
- Quick access to i 69
- Carport
Tags
Property features AI
Exterior
- Parking: Has garage (2 spaces); Carport
- Utilities: Public water; Septic tank
- Home design: Single-family residence (site-built); One story; Shingle roof; Block foundation
- Construction: Vinyl siding; Home warranty included
- Exterior features: Deck; Privacy wood fencing; Shed(s)
Interior
- Kitchen: Dishwasher; Microwave; Refrigerator; Electric range
- Bedrooms: Total rooms: 7
- Flooring: Carpet; Vinyl
- Bathrooms: One full bathroom; One half bathroom; Two bathrooms on the main level
- Heating & cooling: Forced air heating (natural gas); Central air; Ceiling fan(s)
- Interior features: Breakfast bar; Beamed ceilings; Laminate counters; Built-in features; Finished basement (partial); Sump pump in basement; One fireplace in family room
- Laundry & utility: Washer hookup; Electric dryer hookup; Laundry in basement; Gas water heater
Neighborhood map
What this means for you Summary
Snapshot
- This is a 2-bed/1.5-bath single-family listed at $280k.
Deal economics
- At list price, monthly cash flow is $-395 ($-5k/yr) — negative.
- To cash-flow at today's rent, offer at most $210k (25.0% below list).
- To meet the 1% rule (rent ≥ 1% of price), the offer needs to be $161k (42.4% below list).
- Recommended offer: $161k (42.4% below list) — sets the bar for 1% rule.
Location & tenants
- Location reads 80/100 on livability (#21 in IN, #1,922 nationally) — a professional / high-income tenant draw. Strengths: crime A+, cost of living A+, housing A+; Watch: amenities F, commute F.
- Warrick County School Corporation (suburban): math 54% / reading 59% proficiency, ranked #24 of 301 in IN (top 8%) — acceptable for families but not a draw, mixed tenant base, ~2y average lease.
- Zoned schools: Newburgh Elementary School (math 70% / reading 63%, grade B+, #65 of 994 statewide, top 7%, 629 students, 32% FRL); Castle South Middle School (math 43% / reading 57%, grade C, #48 of 330 statewide, top 15%, 712 students, 34% FRL); Castle High School (math 56% / reading 80%, grade B, #22 of 369 statewide, top 6%, 1,961 students, 26% FRL).
- Market conditions: Rents rising fast (+8.7%/yr); 383 active listings in the ZIP; 1 comparable units currently listed for rent nearby; solid renter incomes; 249 units permitted in Warrick County in 2024 (0 in 5+ unit buildings).
Forward outlook
- Local home prices are declining (-3.0%/yr); year-one equity from $2k of loan paydown is wiped out by about $8k of value loss. Plan a longer hold.
- Warrick County population projected at +9% by 2050 — modest demand growth; plan on rents tracking national, not racing it.
Negotiation context
- Only 10 days on market — expect competitive offers; lowballing is unlikely to land.
- 2 sale attempts since 6y ago with the ask held roughly flat each time — persistent listings suggest the price (not the market) is what's stuck; bring a comps-based counter.
- Current owner paid $175k; list at $280k implies a 60% gain — meaningful room to come down on a strong offer.
Risks & watch-outs
- Watch-outs: built in 1940 — expect roof / HVAC / electrical / plumbing capex.
- Climate carrying-cost: extreme-heat days projected 7→19/yr by 2055 (HVAC capex compounding) — expect insurance premiums to compound above CPI over the hold.
Questions for the listing agent
- What do current leases actually rent for vs. the listed asking? Can we see a recent rent roll and the last 12 months of T-12 income?
- Built in 1940 — when were the roof, HVAC, electrical panel, plumbing, and water heater last replaced?
- Is there a deadline driving the sale (1031 exchange, divorce, estate, relocation)? That informs how much negotiation room exists.
- Schools are A-rated — typically a magnet for longer-tenancy family renters. What's the average tenant stay here, and is there a school-zone premium baked into asking?
- The area grade is low — what's the realistic commute time and amenity access for the typical tenant pool here? Any planned neighborhood developments (good or bad) we should know about?
- What's the average days-on-market for RENTAL listings here right now (not sales)? A rising rental-DOM trend means longer vacancies and softer asking-rent achievability than the comps imply.
- What's the recent tenant-quality profile in this submarket — average credit score on applications, eviction rate, late-payment / NSF rate, and stable-employment percentage? A property-management company in the area should have these aggregated.
- How much new for-sale + rental construction is in the pipeline within 1–3 miles? Heavy new supply typically softens prices + rents 12–24 months out; constrained supply supports both.
Investment metrics
- 1% rule
- 0.58% ✗
- Cap rate
- 4.60%
- Cash-on-cash
- -6.06%
- DSCR
- 0.73
- GRM
- 14.5
CMA / ARV
- ARV (on-the-fly)
- $344,544
- Comps found
- 10
Show comp detail 10 sales within ~0.75 mi
| Address | Dist | Beds/Ba | Sqft | Sold | Price | $/sf | Match |
|---|---|---|---|---|---|---|---|
| 10177 Kimberly Ln | 0.41mi | 3/2.5 (+1) | 2,295 (-1%) | 2mo | $345,000 | $150 | 68 |
| 5566 Grimm Rd | 0.14mi | 3/2.5 (+1) | 2,626 (+13%) | 8mo | $335,000 | $128 | 56 |
| 472 Westbriar Cir | 0.53mi | 3/2.0 (+1) | 2,272 (-2%) | 12mo | $585,000 | $257 | 55 |
| 10211 Kimberly Ln | 0.41mi | 3/2.5 (+1) | 2,144 (-8%) | 9mo | $269,000 | $125 | 51 |
| 5111 Tippecanoe Dr | 0.58mi | 3/2.5 (+1) | 2,448 (+5%) | 6mo | $355,000 | $145 | 50 |
| 10533 Williamsburg Dr | 0.59mi | 3/2.5 (+1) | 2,160 (-7%) | 10mo | $280,000 | $130 | 43 |
| 169 Driftwood Ln | 0.70mi | 3/3.0 (+1) | 2,370 (+2%) | 20mo | $480,000 | $203 | 36 |
| 10066 Marquette St | 0.59mi | 3/2.5 (+1) | 2,189 (-6%) | 22mo | $325,000 | $148 | 35 |
| 10722 Willow Creek Rd | 0.62mi | 3/2.5 (+1) | 1,989 (-15%) | 11mo | $325,000 | $163 | 29 |
| 5133 Epworth Rd | 0.66mi | 3/3.0 (+1) | 2,596 (+12%) | 20mo | $280,000 | $108 | 22 |
Match score weights: distance 35% · size 25% · config 20% · recency 20%. Top-matched comps best support the ARV.
Projected returns pro-forma
-3.0% appreciation · 8.0% rent growth · sell at horizon
- IRR
- -22.3%
- Equity multiple
- 0.21×
- Total profit
- $-62,161
- Equity at exit
- $41,734
- IRR
- -8.4%
- Equity multiple
- 0.38×
- Total profit
- $-48,342
- Equity at exit
- $24,201
Cash invested: $78,372 (down + closing). Projections, not guarantees.
Landlord ↔ Tenant lean methodology
- Overall (STATE)
- 90 Strongly Landlord-Friendly
- State Indiana
- 90 Strongly Landlord-Friendly · R+11
- County
- — inherits STATE
- City
- — inherits STATE
ZIP-level market 47630
- Rents YoY
- 8.7%
- Active inventory
- 383
- Price-to-rent
- 14.5×
Monthly cashflow live
- Estimated rent
- $1,612 medium interval (Pro) →
- Mortgage (P&I)
- −$1,468
- Tax from tax record
- −$85 /mo · $1,018/yr
- Insurance
- −$117
- HOA
- −$0
- Vacancy / Maint / Mgmt
- −$339
- Net cashflow
- $-395
Break-even live
UW: 25.0% down · 7.5% · 30yr · 1.5% tax · 5.0% vac · 8.0% maint · 8.0% mgmt
Financing live
Cash to close
- Down payment
- $69,975
- Closing costs
- $8,397
- Reserves months
- —
- Total cash needed
- —
Loan-product check · same deal, 3 products live
Conventional
25% down · 7.5% · 30yr
- Down + closing
- —
- Monthly P&I
- —
- Monthly cashflow
- —
- DSCR
- —
- Eligible?
- —
Personal DTI + credit; lowest rate.
DSCR
20% down · 8.5% · 30yr
- Down + closing
- —
- Monthly P&I
- —
- Monthly cashflow
- —
- DSCR
- —
- Eligible?
- —
No personal income docs; deal must DSCR.
Hard money
10% down · 12.0% · 12mo
- Down + closing
- —
- Monthly P&I
- —
- Monthly cashflow
- —
- DSCR
- —
- Eligible?
- —
Short-term bridge; refi at stabilization.
Rent comps 1 comps
| Address | Beds | Baths | Sqft | Rent | $/sqft | DOM | Units | Dist |
|---|---|---|---|---|---|---|---|---|
| 603 W Water St Newburgh, IN | 3.0 | 2.0 | 2810 | $3,700 | $1.32 | 43d | 1 | 1.19mi |
Listing history 8 events
-
2026-06-09status $279,900 Pending 10 DOM
-
2026-06-08days on market $279,900 Active 10 DOM
-
2026-06-07pricedays on market $279,900 Active 9 DOM
-
2026-06-02days on market $289,900 Active 4 DOM
-
2026-06-01days on market $289,900 Active 3 DOM
-
2026-05-31days on market $289,900 Active 2 DOM
-
2026-05-30remarks 699-char remark
-
2026-05-30$289,900 Active 1 DOM
ⓘ Source: listings_history table (triggers on properties + properties_extension) + one-shot
backfill from property_details.listing_events for pre-trigger history.
Tax reassessment forecast IN · Partial reset (capped growth)
- Current annual tax
- $1,018 · $85/mo
- Projected year-2 tax
- $1,699 · $142/mo
- Expected delta
- +$681/yr (+$57/mo · 66.8%)
ⓘ Screening estimate from a state-policy table — verify with the county assessor before closing.
Climate risk First Street
- Flood 1/10 Low FEMA zone X (unshaded) · 0% chance over 30 yrs
- Wildfire 1/10 Low
- Heat 5/10 Major 7 d/yr ≥106°F today · 19 d/yr by 30 yrs out
- Wind 2/10 Low 4% chance of damaging wind over 30 yrs
- Air quality 4/10 Moderate 4 unhealthy d/yr today · 6 by 30 yrs out
Nearby sold comps map
Loading sold comps map…
Walkable amenities ~0.75 mi
Loading nearby amenities…
Taxation est. · year 1
- Rental income
- $19,349
- − Mortgage interest
- −$15,679
- − Property taxes
- −$1,018
- − Insurance
- −$1,400
- − Repairs & maintenance
- −$1,548
- − Management
- −$1,548
- − Depreciation
- −$8,143
- Taxable loss
- −$9,986
- Est. tax savings @ 24.0%
- +$2,397
- After-tax cash flow
- $-2,349/yr
For passive investors: Depreciation is non-cash, so a rental often shows a tax loss while cash-flowing — sheltering income. Rental losses are passive: they offset passive income freely, and up to $25,000/yr can offset ordinary (W-2) income if you actively participate and your MAGI is under $100k (phasing out to $0 by $150k); unused losses carry forward. On sale, claimed depreciation is recaptured at up to 25%, and gains may owe capital-gains tax (a 1031 exchange can defer both). Figures are a year-1 estimate at your 24.0% rate — not tax advice; consult a CPA.
Schools (NCES district)
- District
- Warrick County School Corporation
- NCES district ID
- 1812390
- Math proficiency
- 54% ▼ -8.00%
- Reading proficiency
- 59% ▼ -6.00%
- Median HH income
- $62,801
- Composite
- 49.38/100
- National rank
- #2014
- State rank
- #24 of 301 in IN
Livability — Newburgh
- Score
- 80/100
- State rank
- #21
- US rank
- #1922
Category grades
Schools grade is shown separately in the Schools card above.
Census & demographics
- County
- Warrick County · 39,818 people
- City population
- 39,818
- Metro
- Evansville, IN-KY
- Population (ZIP)
- 39,818
- Household income
- $94,162
- Rent vs Own
- Severe rent burden
- 770.0
Population outlook (Warrick County) Hauer SSP2
- Today (2025)
- 66,569 people
- By 2030
- 68,404 · +2.8%
- By 2040
- 71,131 · +6.9%
- By 2050
- 72,743 · +9.3%
- By 2075
- 76,088 · +14.3%
- By 2100
- 72,261 · +8.6%
Race, ethnicity, and origin ACS 2023
- Neighborhood character
- Predominantly White (88%)
- Race & ethnicity
- White 88% Two or more races 5% Black 3% Hispanic / Latino 3% Asian 3%
- Common ancestry
- Italian 3% Lithuanian 2% Romanian 2%
- Foreign-born
- 5% · Canada, China
- Languages at home
- 96% English-only · Spanish 2% Other Indo-European 1%
Political lean MEDSL · Warrick
- 2024 margin
- Solid R (+30.2) · D 34.1% · R 64.3% · Other 1.5%
- 2008→2024 swing
- -17.4pp toward R · 2008: -12.8pp · 2024: -30.2pp
- All cycles
- 2024: R+30.2 2020: R+27.8 2016: R+33.9 2012: R+26.6 2008: R+12.8
Not yet ingested
- Civics
- —
Market trends
- HPI YoY
- ▼ -187.44%
- Current HPI
- 185.7643
- Rent YoY
- ▲ 8.69%
- Metro
- Evansville, IN-KY
- State GDP YoY
- ▲ 2.90%
- F500 in state
- 18
Industry mix (Fortune 500 HQ in IN)
| Industry | F500 HQs | Revenue |
|---|---|---|
| Industrial Machinery | 2 | $37B |
|
||
| Healthcare | 1 | $177B |
|
||
| Pharmaceuticals | 1 | $45B |
|
||
| Metals / Steel | 1 | $18B |
|
||
| Agriculture | 1 | $17B |
|
||
| Packaging | 1 | $12B |
|
||
Price history
+65.8% since first listed3 events — show timeline
- 2026-05-29 Listed $289,900 IRMLS
- 2020-06-11 Sold (MLS) $174,900 IRMLS
- 2020-02-21 Listed $174,900 IRMLS
Property tax history
+8.5%/yrLatest (2024): $1,018 · +3.2% YoY. Source: county tax records.
Cash-flow waterfall
monthlySold comps — $/sqft
last 12 mo · ≤1 miLoading sold comps…