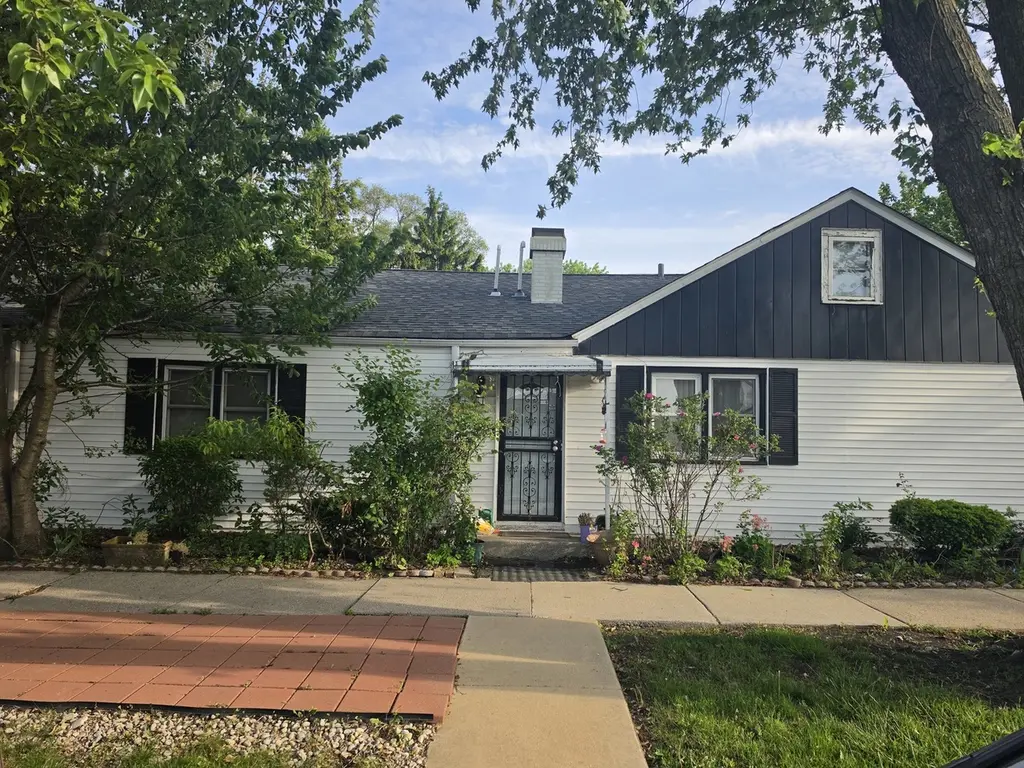
7601 Laramie Ave · Burbank, IL
Flood risk 1/10 · Minimal
- FEMA flood zone
- X (unshaded)
- Chance of flooding over 30 yrs
- 0.0%
- Est. flood insurance / yr
- $507 – $1,088
Fire risk 1/10 · Minimal
- Est. fire insurance / yr
- $804 – $1,492
Heat risk 3/10 · Minor
- Hot days now (above 100°F)
- 7 days/yr
- Hot days in 30 yrs
- 15 days/yr
Wind risk 2/10 · Minimal
- Chance of severe wind over 30 yrs
- 0.0%
Air-quality risk 4/10 · Minor
- Unhealthy air days now
- 3 days/yr
- Unhealthy air days in 30 yrs
- 5 days/yr
Risk factors via First Street. Map © Google.
Why this score? — see what drove the B grade
The composite is a weighted blend of 9 inputs, each scored 0–100. Each bar is that input's sub-score; the figure is the points it added to the 100-point composite (weight × sub-score).
- Cash flow +29.3/30.0
- ARV discount +15.0/15.0
- DSCR +10.0/10.0
- 1% rule +7.8/10.0
- Livability +3.9/5.0
- Rent growth +2.5/5.0
- Condition / age +2.5/5.0
- Schools +1.8/10.0
- Appreciation +0.0/10.0
$299,999
🖨 Deal sheet 📄 Offer letter ✓ Due diligence
Listing remarks
LARGE 4 BEDROOM RANCH HOME. CORNER HOUSE SITS ON 2 LOTS. HOME IS BIGGER THAN WHAT IT APPEARS FROM THE OUTSIDE, LARGER FENCED BACKYARD. HUGE FAMILY ROOM. 2 1/2 CAR ATTACHED GARAGE. BONUS ROOM IN ATTIC. NEWER ROOF AND WATER HEATER. CLOSE TO SHOPPING, TRANSPORTATION AND SCHOOLS. HOME IS BEING SOLD AS IS . Interior pictures coming soon. Property is priced to sell! Main level sq ft 2136, attached garage 484
Key facts
- Newer roof
- Huge family room
- Bonus room in attic
Tags
Property features AI
Finance
- Other: Not currently leased; Possession at closing or immediate
- HOA & community: No master association fee required; Community features include sidewalks, street lights, and paved streets
Exterior
- Parking: Attached garage on concrete; 2 garage/total parking spaces
- Utilities: Water from Lake Michigan / public; Public sewer; Electric with circuit breakers
- Home design: Detached single-family home; One-story ranch; Fee simple ownership; Built approximately 71–80 years ago; Asphalt roof; Facing/directions: use local directions
- Construction: Vinyl siding; Concrete perimeter foundation; Built before 1978
- Exterior features: Patio; Corner lot; Lot dimensions approximately 50 x 137
Interior
- Kitchen: Kitchen with ceramic tile flooring (14 x 11); Refrigerator
- Bedrooms: 4 bedrooms (master and three additional bedrooms on main level); Attic (15 x 17) — finished and usable space
- Flooring: Carpet in living room, family room, master and three bedrooms; Vinyl flooring in attic; Ceramic tile in kitchen
- Bathrooms: 1 full bathroom; 1 half bathroom
- Heating & cooling: Natural gas forced-air heating; Central air conditioning
- Interior features: First-floor bedroom; First-floor full bath; Finished attic; Crawl space basement; 8 total rooms
- Laundry & utility: Main-level laundry; Gas dryer hookup; Washer; Dryer
Neighborhood map
What this means for you Summary
Snapshot
- This is a 4-bed/2.5-bath single-family listed at $300k.
Deal economics
- At list price, monthly cash flow is $1k ($13k/yr) — positive.
- The deal already cash-flows at list — no discount required.
- Meets the 1% rule at list price ($4k rent vs $300k).
- Cap rate 10.5% vs local median 5.4% in Burbank — top-decile yield for the area; either an underpriced asset or a hidden risk that comps aren't pricing in. Stress-test before assuming the spread holds.
Location & tenants
- Location reads 78/100 on livability (#132 in IL, #2,422 nationally) — a middle-class / working-renter tenant base. Strengths: commute A+, housing A+, employment A-; Watch: health & safety C-, schools D-, amenities F.
- Reavis Twp Hsd 220 (suburban): math 18% / reading 21% proficiency, ranked #420 of 620 in IL (top 68%) — low school quality limits family demand, transient renter base, plan for 1-2y turnover.
- Market conditions: 51 active listings in the ZIP; 2 comparable units currently listed for rent nearby; 6,272 units permitted in Cook County in 2024 (4,658 in 5+ unit buildings).
Forward outlook
- Local home prices are declining (-3.0%/yr); year-one equity from $2k of loan paydown is wiped out by about $9k of value loss. Plan a longer hold.
- At projected returns (-3.0% appreciation + 3.0% rent growth), your $84k cash investment doubles in ~8 years — after that, you're playing with house money.
Negotiation context
- Only 2 days on market — expect competitive offers; lowballing is unlikely to land.
- 4 sale attempts since 19y ago with the ask held roughly flat each time — persistent listings suggest the price (not the market) is what's stuck; bring a comps-based counter.
- Current owner paid $133k; list at $300k implies a 126% gain — meaningful room to come down on a strong offer.
Risks & watch-outs
- Watch-outs: built in 1953 — expect roof / HVAC / electrical / plumbing capex.
Questions for the listing agent
- Built in 1953 — when were the roof, HVAC, electrical panel, plumbing, and water heater last replaced?
- Is there a deadline driving the sale (1031 exchange, divorce, estate, relocation)? That informs how much negotiation room exists.
- Schools are D-rated, which usually means shorter tenancies and higher turnover. Who's the typical renter profile here, and what's been the actual vacancy rate?
- What's the average days-on-market for RENTAL listings here right now (not sales)? A rising rental-DOM trend means longer vacancies and softer asking-rent achievability than the comps imply.
- What's the recent tenant-quality profile in this submarket — average credit score on applications, eviction rate, late-payment / NSF rate, and stable-employment percentage? A property-management company in the area should have these aggregated.
- How much new for-sale + rental construction is in the pipeline within 1–3 miles? Heavy new supply typically softens prices + rents 12–24 months out; constrained supply supports both.
Investment metrics
- 1% rule
- 1.28% ✓
- Cap rate
- 10.50%
- Cash-on-cash
- 15.03%
- DSCR
- 1.67
- GRM
- 6.5
CMA / ARV
- ARV (on-the-fly)
- $371,800
- Comps found
- 4
Show comp detail 4 sales within ~0.75 mi
| Address | Dist | Beds/Ba | Sqft | Sold | Price | $/sf | Match |
|---|---|---|---|---|---|---|---|
| 7772 Lawler Ave | 0.27mi | 5/2.0 (+1) | 2,500 (-4%) | 10mo | $357,000 | $143 | 66 |
| 7701 Leamington Ave | 0.14mi | 5/3.5 (+1) | 2,750 (+6%) | 12mo | $519,900 | $189 | 65 |
| 8023 Lavergne Ave | 0.71mi | 4/2.5 | 2,330 (-10%) | 20mo | $333,900 | $143 | 33 |
| 7744 Major Ave | 0.70mi | 3/2.0 (-1) | 2,304 (-11%) | 12mo | $319,900 | $139 | 31 |
Match score weights: distance 35% · size 25% · config 20% · recency 20%. Top-matched comps best support the ARV.
Projected returns pro-forma
-3.0% appreciation · 3.0% rent growth · sell at horizon
- IRR
- 5.6%
- Equity multiple
- 1.22×
- Total profit
- $18,407
- Equity at exit
- $44,731
- IRR
- 15.1%
- Equity multiple
- 2.22×
- Total profit
- $102,344
- Equity at exit
- $25,938
Cash invested: $84,000 (down + closing). Projections, not guarantees.
Landlord ↔ Tenant lean methodology
- Overall (STATE)
- 43 Moderately Tenant-Leaning
- State Illinois
- 43 Moderately Tenant-Leaning · D+7
- County
- — inherits STATE
- City
- — inherits STATE
ZIP-level market 60459
- Active inventory
- 51
- Price-to-rent
- 6.5×
Monthly cashflow live
- Estimated rent
- $3,850 medium interval (Pro) →
- Mortgage (P&I)
- −$1,573
- Tax from tax record
- −$291 /mo · $3,489/yr
- Insurance
- −$125
- HOA
- −$0
- Vacancy / Maint / Mgmt
- −$808
- Net cashflow
- $1,052
Break-even live
UW: 25.0% down · 7.5% · 30yr · 1.5% tax · 5.0% vac · 8.0% maint · 8.0% mgmt
Financing live
Cash to close
- Down payment
- $75,000
- Closing costs
- $9,000
- Reserves months
- —
- Total cash needed
- —
Loan-product check · same deal, 3 products live
Conventional
25% down · 7.5% · 30yr
- Down + closing
- —
- Monthly P&I
- —
- Monthly cashflow
- —
- DSCR
- —
- Eligible?
- —
Personal DTI + credit; lowest rate.
DSCR
20% down · 8.5% · 30yr
- Down + closing
- —
- Monthly P&I
- —
- Monthly cashflow
- —
- DSCR
- —
- Eligible?
- —
No personal income docs; deal must DSCR.
Hard money
10% down · 12.0% · 12mo
- Down + closing
- —
- Monthly P&I
- —
- Monthly cashflow
- —
- DSCR
- —
- Eligible?
- —
Short-term bridge; refi at stabilization.
Rent comps 2 comps
| Address | Beds | Baths | Sqft | Rent | $/sqft | DOM | Units | Dist |
|---|---|---|---|---|---|---|---|---|
| 5330 W 86th St Burbank, IL | 4.0 | 2.0 | 2300 | $4,100 | $1.78 | 1d | 1 | 1.22mi |
| 5212 Avery Pl Unit 1545958P Oak Lawn, IL | 3.0 | 1.0 | 2195 | $3,548 | $1.62 | 10d | 1 | 1.41mi |
Listing history 14 events
-
2026-06-18days on market $299,999 Active 2 DOM
-
2026-06-17remarks 407-char remark
-
2026-06-17pricedays on market $299,999 Active 1 DOM
-
2026-06-15days on market $315,000 Active 17 DOM
-
2026-06-13days on market $315,000 Active 15 DOM
-
2026-06-13days on market $315,000 Active 14 DOM
-
2026-06-09days on market $315,000 Active 11 DOM
-
2026-06-08days on market $315,000 Active 10 DOM
-
2026-06-07days on market $315,000 Active 9 DOM
-
2026-06-04days on market $315,000 Active 6 DOM
-
2026-06-03days on market $315,000 Active 5 DOM
-
2026-06-02days on market $315,000 Active 4 DOM
-
2026-06-01days on market $315,000 Active 3 DOM
-
2026-05-31days on market $315,000 Active 2 DOM
ⓘ Source: listings_history table (triggers on properties + properties_extension) + one-shot
backfill from property_details.listing_events for pre-trigger history.
Tax reassessment forecast IL · Partial reset (capped growth)
- Current annual tax
- $3,489 · $291/mo
- Projected year-2 tax
- $5,150 · $429/mo
- Expected delta
- +$1,660/yr (+$138/mo · 47.6%)
ⓘ Screening estimate from a state-policy table — verify with the county assessor before closing.
Climate risk First Street
- Flood 1/10 Low FEMA zone X (unshaded) · 0% chance over 30 yrs
- Wildfire 1/10 Low
- Heat 3/10 Moderate 7 d/yr ≥100°F today · 15 d/yr by 30 yrs out
- Wind 2/10 Low 0% chance of damaging wind over 30 yrs
- Air quality 4/10 Moderate 3 unhealthy d/yr today · 5 by 30 yrs out
Nearby sold comps map
Loading sold comps map…
Walkable amenities ~0.75 mi
Loading nearby amenities…
Taxation est. · year 1
- Rental income
- $46,195
- − Mortgage interest
- −$16,805
- − Property taxes
- −$3,489
- − Insurance
- −$1,500
- − Repairs & maintenance
- −$3,696
- − Management
- −$3,696
- − Depreciation
- −$8,727
- Taxable income
- $8,283
- Est. tax owed @ 24.0%
- −$1,988
- After-tax cash flow
- $10,638/yr
For passive investors: Depreciation is non-cash, so a rental often shows a tax loss while cash-flowing — sheltering income. Rental losses are passive: they offset passive income freely, and up to $25,000/yr can offset ordinary (W-2) income if you actively participate and your MAGI is under $100k (phasing out to $0 by $150k); unused losses carry forward. On sale, claimed depreciation is recaptured at up to 25%, and gains may owe capital-gains tax (a 1031 exchange can defer both). Figures are a year-1 estimate at your 24.0% rate — not tax advice; consult a CPA.
Schools (NCES district)
- District
- Reavis Twp Hsd 220
- NCES district ID
- 1733270
- Math proficiency
- 18% ▼ -3.00%
- Reading proficiency
- 21% ▼ -4.00%
- Median HH income
- $54,732
- Composite
- 17.94/100
- National rank
- #8994
- State rank
- #420 of 620 in IL
Livability — Burbank
- Score
- 78/100
- State rank
- #132
- US rank
- #2422
Category grades
Schools grade is shown separately in the Schools card above.
Census & demographics
- Census place
- Burbank, IL
- City population
- 28,822
- Population (ZIP)
- 28,822
Population outlook (Cook County) Hauer SSP2
- Today (2025)
- 5,347,519 people
- By 2030
- 5,357,703 · +0.2%
- By 2040
- 5,324,924 · -0.4%
- By 2050
- 5,230,762 · -2.2%
- By 2075
- 4,785,735 · -10.5%
- By 2100
- 4,188,836 · -21.7%
Race, ethnicity, and origin ACS 2023
- Neighborhood character
- Diverse neighborhood (Simpson 0.56)
- Race & ethnicity
- Hispanic / Latino 50% White 44% Two or more races 21% Asian 3% Black 1%
- Hispanic origin (detail)
- Mexican 45% Puerto Rican 2%
- Common ancestry
- Romanian 17% Armenian 1% Iranian 1%
- Foreign-born
- 32% · Canada, Jamaica, Vietnam
- Languages at home
- 40% English-only · Spanish 39% Russian/Polish/Slavic 12% Arabic 5%
Political lean MEDSL · Cook
- 2024 margin
- Solid D (+42.0) · D 70.4% · R 28.4% · Other 1.2%
- 2008→2024 swing
- -11.4pp toward R · 2008: 53.4pp · 2024: 42.0pp
- All cycles
- 2024: D+42.0 2020: D+50.3 2016: D+53.0 2012: D+49.4 2008: D+53.4
Not yet ingested
- Civics
- —
Market trends
- HPI YoY
- ▼ -188.56%
- Current HPI
- 223.2294
- Rent YoY
- —
- Metro
- —
- State GDP YoY
- ▲ 1.59%
- F500 in state
- 60
Industry mix (Fortune 500 HQ in IL)
| Industry | F500 HQs | Revenue |
|---|---|---|
| Insurance | 4 | $201B |
|
||
| Consumer Goods | 4 | $87B |
|
||
| Industrial Machinery | 3 | $64B |
|
||
| Healthcare | 2 | $55B |
|
||
| Retail / Pharmacy | 1 | $148B |
|
||
| Agriculture / Food | 1 | $86B |
|
||
Price history
+136.8% since first listed9 events — show timeline
- 2026-05-29 Listed $315,000 MRED as Distributed by MLS Grid
- 2009-07-31 Listing Removed — MRED as Distributed by MLS Grid
- 2009-03-01 Price Changed — MRED as Distributed by MLS Grid
- 2008-12-27 Listed — MRED as Distributed by MLS Grid
- 2008-11-13 Listing Removed — MRED as Distributed by MLS Grid
- 2008-05-12 Listed — MRED as Distributed by MLS Grid
- 2008-05-06 Listing Removed — MRED as Distributed by MLS Grid
- 2007-06-07 Listed — MRED as Distributed by MLS Grid
- 2001-02-01 Sold (Public Records) $133,000 Public Records
Property tax history
+6.2%/yrLatest (2023): $3,489 · +239.7% YoY. Source: county tax records.
Cash-flow waterfall
monthlySold comps — $/sqft
last 12 mo · ≤1 miLoading sold comps…