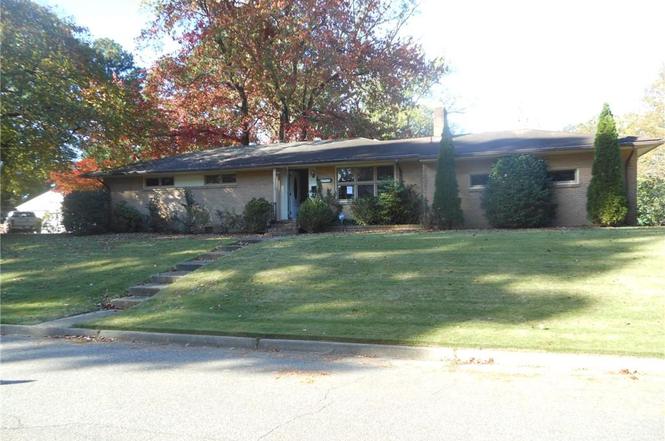
115 Glade Rd · Newport News, VA
Flood risk 1/10 · Minimal
- FEMA flood zone
- X (unshaded)
- Chance of flooding over 30 yrs
- 0.0%
- Est. flood insurance / yr
- $507 – $1,088
Fire risk 1/10 · Minimal
- Est. fire insurance / yr
- $666 – $1,236
Heat risk 9/10 · Severe
- Hot days now (above 105°F)
- 7 days/yr
- Hot days in 30 yrs
- 17 days/yr
Wind risk 8/10 · Major
- Chance of severe wind over 30 yrs
- 80.0%
Air-quality risk 2/10 · Minimal
- Unhealthy air days now
- 0 days/yr
- Unhealthy air days in 30 yrs
- 1 days/yr
Risk factors via First Street. Map © Google.
Why this score? — see what drove the D+ grade
The composite is a weighted blend of 9 inputs, each scored 0–100. Each bar is that input's sub-score; the figure is the points it added to the 100-point composite (weight × sub-score).
- ARV discount +15.0/15.0
- Cash flow +12.7/30.0
- Rent growth +4.3/5.0
- DSCR +3.8/10.0
- Schools +3.8/10.0
- Livability +3.8/5.0
- 1% rule +3.5/10.0
- Condition / age +2.5/5.0
- Appreciation +0.0/10.0
$230,000
🖨 Deal sheet (PDF) 📄 Offer letter ✓ Due diligence
Listing remarks
Property Sold as-is. No concessions No Repairs. All Brick Ranch home with 1257sf of living space, 4 bedroom, 1.5 bathrooms, 2 car garage, large storage shed, oversized corner lot, convenient Newport News location near CNU, Mariners Park & Museum, Riverside Hospital, shopping and restaurants. Excellent Value! Must see to appreciate!
Key facts
- Oversized corner lot
- All brick ranch
- Large storage shed
Tags
Neighborhood map
What this means for you Summary
Snapshot
- This is a 3-bed/1.5-bath single-family listed at $230k.
Deal economics
- At list price, monthly cash flow is $-25 ($-303/yr) — negative.
- To cash-flow at today's rent, offer at most $226k (1.9% below list).
- To meet the 1% rule (rent ≥ 1% of price), the offer needs to be $196k (14.9% below list).
- Recommended offer: $196k (14.9% below list) — sets the bar for 1% rule.
- Cap rate 6.2% vs local median 4.2% in Newport News — top-decile yield for the area; either an underpriced asset or a hidden risk that comps aren't pricing in. Stress-test before assuming the spread holds.
Location & tenants
- Location reads 75/100 on livability (#123 in VA, #4,018 nationally) — a middle-class / working-renter tenant base. Strengths: health & safety A+, cost of living A, housing A; Watch: crime F, commute F.
- Newport News City Public School District (urban): math 34% / reading 54% proficiency, ranked #112 of 131 in VA (top 86%) — families likely to look elsewhere, expect single-tenant / working-renter base with shorter leases.
- Zoned schools: Hidenwood Elementary (math 25% / reading 47%, grade F, #958 of 1,108 statewide, top 87%, 522 students, 91% FRL); Ethel M. Gildersleeve Middle (math 47% / reading 58%, grade C+, #216 of 342 statewide, top 63%, 1,130 students, 89% FRL); Menchville High (math 39% / reading 79%, grade C+, #256 of 319 statewide, top 81%, 1,788 students, 87% FRL) — zoned schools average 89% FRL vs 55% district-wide (34 pts higher); higher-poverty schools than district average — tighter screening recommended.
- Market conditions: Rents rising fast (+7.4%/yr); 102 active listings in the ZIP; 26 comparable units currently listed for rent nearby; rentals at typical pace (median 17d on market — plan ~3-4 weeks tenant-placement turnaround); 522 units permitted in Newport News city in 2024 (458 in 5+ unit buildings).
- This rent runs 32% of the median local income ($73k/yr) — at the standard rent-burdened threshold; future hikes will face affordability resistance.
Forward outlook
- Local home prices are declining (-3.0%/yr); year-one equity from $2k of loan paydown is wiped out by about $7k of value loss. Plan a longer hold.
- Newport News County population projected to shrink 8% by 2050 — rents likely to lag national; underwrite the cash flow, not the appreciation.
Negotiation context
- Only 8 days on market — expect competitive offers; lowballing is unlikely to land.
- Current owner paid $23k; list at $230k implies a 915% gain — meaningful room to come down on a strong offer.
Risks & watch-outs
- Climate carrying-cost: severe wind risk, 80% chance of damaging wind over 30y; extreme-heat days projected 7→17/yr by 2055 (HVAC capex compounding) — expect insurance premiums to compound above CPI over the hold.
Questions for the listing agent
- What do current leases actually rent for vs. the listed asking? Can we see a recent rent roll and the last 12 months of T-12 income?
- Built in 1962 — when were the roof, HVAC, electrical panel, plumbing, and water heater last replaced?
- Is there a deadline driving the sale (1031 exchange, divorce, estate, relocation)? That informs how much negotiation room exists.
- Schools are B-rated — typically a magnet for longer-tenancy family renters. What's the average tenant stay here, and is there a school-zone premium baked into asking?
- Crime grade is F in this area — have there been break-ins, vandalism, or insurance claims at this property in the last 3 years? What carrier currently insures it and at what premium?
- The area grade is low — what's the realistic commute time and amenity access for the typical tenant pool here? Any planned neighborhood developments (good or bad) we should know about?
- What's the average days-on-market for RENTAL listings here right now (not sales)? A rising rental-DOM trend means longer vacancies and softer asking-rent achievability than the comps imply.
- What's the recent tenant-quality profile in this submarket — average credit score on applications, eviction rate, late-payment / NSF rate, and stable-employment percentage? A property-management company in the area should have these aggregated.
- How much new for-sale + rental construction is in the pipeline within 1–3 miles? Heavy new supply typically softens prices + rents 12–24 months out; constrained supply supports both.
Investment metrics
- 1% rule
- 0.85% ✗
- Cap rate
- 6.16%
- Cash-on-cash
- -0.47%
- DSCR
- 0.98
- GRM
- 9.8
CMA / ARV
- ARV (on-the-fly)
- $286,368
- Comps found
- 12
Show comp detail 12 sales within ~0.75 mi
| Address | Dist | Beds/Ba | Sqft | Sold | Price | $/sf | Match |
|---|---|---|---|---|---|---|---|
| 8 Gay Dr | 0.30mi | 3/1.0 | 1,290 (+3%) | 0mo | $300,000 | $233 | 79 |
| 47 Carolyn Dr | 0.17mi | 3/2.0 | 1,377 (+10%) | 11mo | $335,000 | $243 | 65 |
| 36 Pennington Ave | 0.44mi | 3/2.0 | 1,327 (+6%) | 5mo | $287,000 | $216 | 64 |
| 52 Peters Ln | 0.57mi | 3/2.0 | 1,210 (-4%) | 7mo | $306,500 | $253 | 60 |
| 22 Oxford Rd | 0.59mi | 3/2.0 | 1,243 (-1%) | 11mo | $250,500 | $202 | 59 |
| 32 Pennington Ave | 0.46mi | 3/2.0 | 1,357 (+8%) | 7mo | $310,000 | $228 | 57 |
| 12 Carriage Ln | 0.51mi | 4/2.0 (+1) | 1,309 (+4%) | 9mo | $299,900 | $229 | 55 |
| 58 Peters Ln | 0.53mi | 3/1.0 | 1,071 (-15%) | 1mo | $230,000 | $215 | 48 |
| 13 Rugby Rd | 0.50mi | 3/1.5 | 1,097 (-13%) | 10mo | $300,000 | $273 | 47 |
| 46 Oxford Rd | 0.57mi | 3/1.5 | 1,120 (-11%) | 10mo | $245,000 | $219 | 47 |
| 31 Whites Ln | 0.62mi | 3/2.0 | 1,418 (+13%) | 16mo | $315,000 | $222 | 34 |
| 7A Mellon St | 0.74mi | 3/2.0 | 1,421 (+13%) | 13mo | $253,000 | $178 | 31 |
Match score weights: distance 35% · size 25% · config 20% · recency 20%. Top-matched comps best support the ARV.
Projected returns pro-forma
-3.0% appreciation · 7.37% rent growth · sell at horizon
- IRR
- -12.3%
- Equity multiple
- 0.54×
- Total profit
- $-29,876
- Equity at exit
- $34,294
- IRR
- 2.3%
- Equity multiple
- 1.19×
- Total profit
- $12,346
- Equity at exit
- $19,886
Cash invested: $64,400 (down + closing). Projections, not guarantees.
Landlord ↔ Tenant lean methodology
- Overall (STATE)
- 55 Moderately Landlord-Leaning
- State Virginia
- 55 Moderately Landlord-Leaning · D+2
- County
- — inherits STATE
- City
- — inherits STATE
ZIP-level market 23606
- Rents YoY
- 7.4%
- Active inventory
- 102
- Price-to-rent
- 9.8×
Monthly cashflow live
- Estimated rent
- $1,958 high interval (Pro) →
- Mortgage (P&I)
- −$1,206
- Tax from tax record
- −$270 /mo · $3,237/yr
- Insurance
- −$96
- HOA
- −$0
- Vacancy / Maint / Mgmt
- −$411
- Net cashflow
- $-25
Break-even live
Sensitivity live
| Price | -10% $105 | -5% $40 | +0% $-25 | +5% $-90 | +10% $-155 |
|---|---|---|---|---|---|
| Rent | -10% $-180 | -5% $-103 | +0% $-25 | +5% $52 | +10% $129 |
| Rate | -1.0pp $91 | -0.5pp $33 | base $-25 | +0.5pp $-85 | +1.0pp $-146 |
UW: 25.0% down · 7.5% · 30yr · 1.5% tax · 5.0% vac · 8.0% maint · 8.0% mgmt
Financing live
Cash to close
- Down payment
- $57,500
- Closing costs
- $6,900
- Reserves months
- —
- Total cash needed
- —
Loan-product check · same deal, 3 products live
Conventional
25% down · 7.5% · 30yr
- Down + closing
- —
- Monthly P&I
- —
- Monthly cashflow
- —
- DSCR
- —
- Eligible?
- —
Personal DTI + credit; lowest rate.
DSCR
20% down · 8.5% · 30yr
- Down + closing
- —
- Monthly P&I
- —
- Monthly cashflow
- —
- DSCR
- —
- Eligible?
- —
No personal income docs; deal must DSCR.
Hard money
10% down · 12.0% · 12mo
- Down + closing
- —
- Monthly P&I
- —
- Monthly cashflow
- —
- DSCR
- —
- Eligible?
- —
Short-term bridge; refi at stabilization.
Rent comps 26 comps
| Address | Beds | Baths | Sqft | Rent | $/sqft | DOM | Units | Dist |
|---|---|---|---|---|---|---|---|---|
| 201 Kingstowne Dr Newport News, VA | 1.0–2.0 | 1.0–2.0 | 900 | $1,799 | $2.00 | 4d | 25 | 0.39mi |
| 550 Saint Michaels Way Newport News, VA | 1.0–2.0 | 1.0–2.0 | 784 | $1,791 | $2.28 | 4d | 14 | 0.50mi |
| 126 Candlewood Way Newport News, VA | 1.0–2.0 | 1.0–1.5 | 768 | $1,312 | $1.71 | 6d | 5 | 0.51mi |
| 39 Whites Ln Unit A Newport News, VA | 2.0 | 1.0 | 1049 | $1,395 | $1.33 | 4d | 1 | 0.55mi |
| 27 Nutmeg Quarter Pl Newport News, VA | 3.0 | 2.0 | 1608 | $2,600 | $1.62 | 9d | 1 | 0.59mi |
| 414 Turlington Rd Newport News, VA | 1.0–2.0 | 1.0 | 925 | $1,115 | $1.21 | 4d | 24 | 0.73mi |
| 102 Americana Dr Newport News, VA | 1.0–2.0 | 1.0 | 875 | $1,135 | $1.30 | 4d | 17 | 0.75mi |
| 156 Sloane Pl Newport News, VA | 3.0 | 2.5 | 1480 | $1,750 | $1.18 | 45d | 1 | 0.76mi |
| 500 Waters Edge Dr Newport News, VA | 1.0–3.0 | 1.0–2.0 | 958 | $2,033 | $2.12 | 4d | 34 | 0.76mi |
| 154 Kenilworth Dr Newport News, VA | 2.0 | 1.5 | 1312 | $1,795 | $1.37 | 25d | 1 | 0.81mi |
| 72 Ferguson Ln Newport News, VA | 3.0 | 2.0 | 1473 | $2,200 | $1.49 | 4d | 1 | 0.89mi |
| 390 Hiden Blvd Newport News, VA | 4.0 | 1.5 | 1631 | $1,950 | $1.20 | 45d | 1 | 0.90mi |
| 104 Tidal Dr Newport News, VA | 2.0 | 2.0 | 1198 | $3,550 | $2.96 | 45d | 1 | 0.95mi |
| 301 Nat Turner Blvd S Newport News, VA | 1.0–4.0 | 1.0–4.0 | 1487 | $681 | $0.46 | 16d | 1 | 0.97mi |
| 301 Nat Turner Blvd S Newport News, VA | 1.0–4.0 | 1.0–4.0 | 1487 | $681 | $0.46 | 18d | 4 | 0.97mi |
| 13 Frances St Newport News, VA | 3.0 | 1.0 | 1016 | $1,595 | $1.57 | 45d | 1 | 1.04mi |
| 670 Town Center Dr Newport News, VA | 1.0–2.0 | 1.0–2.0 | 1442 | $2,300 | $1.59 | 45d | 2 | 1.05mi |
| 670 Town Center Dr Newport News, VA | 1.0–2.0 | 1.0–2.0 | 1442 | $2,150 | $1.49 | 16d | 2 | 1.05mi |
| 670 Town Center Dr #405 Newport News, VA | 2.0 | 2.0 | 1861 | $2,150 | $1.16 | 14d | 1 | 1.06mi |
| 4 Fairway Ln Newport News, VA | 3.0 | 1.5 | 1470 | $2,100 | $1.43 | 45d | 1 | 1.08mi |
| 19 Port Lndg Newport News, VA | 1.0–3.0 | 1.0 | 975 | $1,825 | $1.87 | 45d | 8 | 1.11mi |
| 19 Port Lndg Newport News, VA | 1.0–3.0 | 1.0–1.5 | 975 | $1,825 | $1.87 | 3d | 24 | 1.11mi |
| 7 Conway Rd Newport News, VA | 3.0 | 2.5 | 1500 | $1,995 | $1.33 | 16d | 1 | 1.22mi |
| 900 Lakefront Cmns Newport News, VA | 1.0–2.0 | 1.0–2.0 | 1114 | $2,144 | $1.92 | 3d | 12 | 1.25mi |
| 311 Mimosa Dr Newport News, VA | 4.0 | 2.0 | 1754 | $2,350 | $1.34 | 45d | 1 | 1.35mi |
| 404 Lennon Dr Newport News, VA | 3.0 | 2.0 | 1193 | $1,500 | $1.26 | 46d | 1 | 1.42mi |
Listing history 3 events
-
2025-11-11status Under Contract
-
2025-11-03$230,000 Active
-
1968-07-26soldstatus $22,660
ⓘ Source: listings_history table (triggers on properties + properties_extension) + one-shot
backfill from property_details.listing_events for pre-trigger history.
Tax reassessment forecast VA · Resets to sale price
- Current annual tax
- $3,237 · $270/mo
- Projected year-2 tax
- $3,237 · $270/mo
- Expected delta
- $0/yr ($0/mo · 0.0%)
ⓘ Screening estimate from a state-policy table — verify with the county assessor before closing.
Climate risk First Street
- Flood 1/10 Low FEMA zone X (unshaded) · 0% chance over 30 yrs
- Wildfire 1/10 Low
- Heat 9/10 Extreme 7 d/yr ≥105°F today · 17 d/yr by 30 yrs out
- Wind 8/10 Severe 80% chance of damaging wind over 30 yrs
- Air quality 2/10 Low 0 unhealthy d/yr today · 1 by 30 yrs out
Nearby sold comps map
Loading sold comps map…
Walkable amenities ~0.75 mi
Loading nearby amenities…
Taxation est. · year 1
- Rental income
- $23,491
- − Mortgage interest
- −$12,884
- − Property taxes
- −$3,237
- − Insurance
- −$1,150
- − Repairs & maintenance
- −$1,879
- − Management
- −$1,879
- − Depreciation
- −$6,691
- Taxable loss
- −$4,230
- Est. tax savings @ 24.0%
- +$1,015
- After-tax cash flow
- $712/yr
For passive investors: Depreciation is non-cash, so a rental often shows a tax loss while cash-flowing — sheltering income. Rental losses are passive: they offset passive income freely, and up to $25,000/yr can offset ordinary (W-2) income if you actively participate and your MAGI is under $100k (phasing out to $0 by $150k); unused losses carry forward. On sale, claimed depreciation is recaptured at up to 25%, and gains may owe capital-gains tax (a 1031 exchange can defer both). Figures are a year-1 estimate at your 24.0% rate — not tax advice; consult a CPA.
Schools (NCES district)
- District
- Newport News City Public School District
- NCES district ID
- 5102640
- Math proficiency
- 34% ▼ -37.00%
- Reading proficiency
- 54% ▼ -10.00%
- Median HH income
- $49,644
- Composite
- 37.7/100
- National rank
- #4360
- State rank
- #112 of 131 in VA
Livability — Newport News
- Score
- 75/100
- State rank
- #123
- US rank
- #4018
Category grades
Schools grade is shown separately in the Schools card above.
Census & demographics
- Census place
- Newport News, VA
- County
- Newport News City · 178,950 people
- City population
- 178,950
- Metro
- Virginia Beach-Norfolk-Newport News, VA-NC
- Population (ZIP)
- 29,971
- Household income
- $72,874
- Rent vs Own
- Severe rent burden
- 1395.0
Population outlook (Newport News County) Hauer SSP2
- Today (2025)
- 181,076 people
- By 2030
- 179,683 · -0.8%
- By 2040
- 174,649 · -3.5%
- By 2050
- 167,407 · -7.5%
- By 2075
- 147,597 · -18.5%
- By 2100
- 122,144 · -32.5%
Race, ethnicity, and origin ACS 2023
- Neighborhood character
- Diverse neighborhood (Simpson 0.61)
- Race & ethnicity
- White 56% Black 23% Hispanic / Latino 13% Two or more races 12% Asian 3%
- Hispanic origin (detail)
- Mexican 5% Puerto Rican 3%
- Common ancestry
- Romanian 3% Slovak 2% Lithuanian 2%
- Foreign-born
- 10% · Canada, China, Jamaica
- Languages at home
- 86% English-only · Spanish 10% Other Indo-European 1% Other Asian/Pacific 1%
Political lean MEDSL · Newport News
- 2024 margin
- Strong D (+28.8) · D 63.7% · R 34.9% · Other 1.4%
- 2008→2024 swing
- +0.1pp no change · 2008: 28.7pp · 2024: 28.8pp
- All cycles
- 2024: D+28.8 2020: D+32.9 2016: D+25.4 2012: D+30.0 2008: D+28.7
Not yet ingested
- Civics
- —
Market trends
- HPI YoY
- ▼ -170.91%
- Current HPI
- 273.5811
- Rent YoY
- ▲ 7.37%
- Metro
- Virginia Beach-Norfolk-Newport News, VA-NC
- State GDP YoY
- ▲ 2.40%
- F500 in state
- 50
Industry mix (Fortune 500 HQ in VA)
| Industry | F500 HQs | Revenue |
|---|---|---|
| Aerospace / Defense | 4 | $236B |
|
||
| Technology / Defense | 3 | $32B |
|
||
| Financial Services | 2 | $176B |
|
||
| Utilities | 2 | $27B |
|
||
| Insurance | 2 | $25B |
|
||
| Technology | 2 | $15B |
|
||
Price history
+915.0% since first listed3 events — show timeline
- 2025-11-11 Pending — REINMLS
- 2025-11-03 Listed $230,000 REINMLS
- 1968-07-26 Sold (Public Records) $22,660 Public Records
Property tax history
+3.6%/yrLatest (2026): $3,237 · +10.3% YoY. Source: county tax records.
Cash-flow waterfall
monthlySold comps — $/sqft
last 12 mo · ≤1 miLoading sold comps…