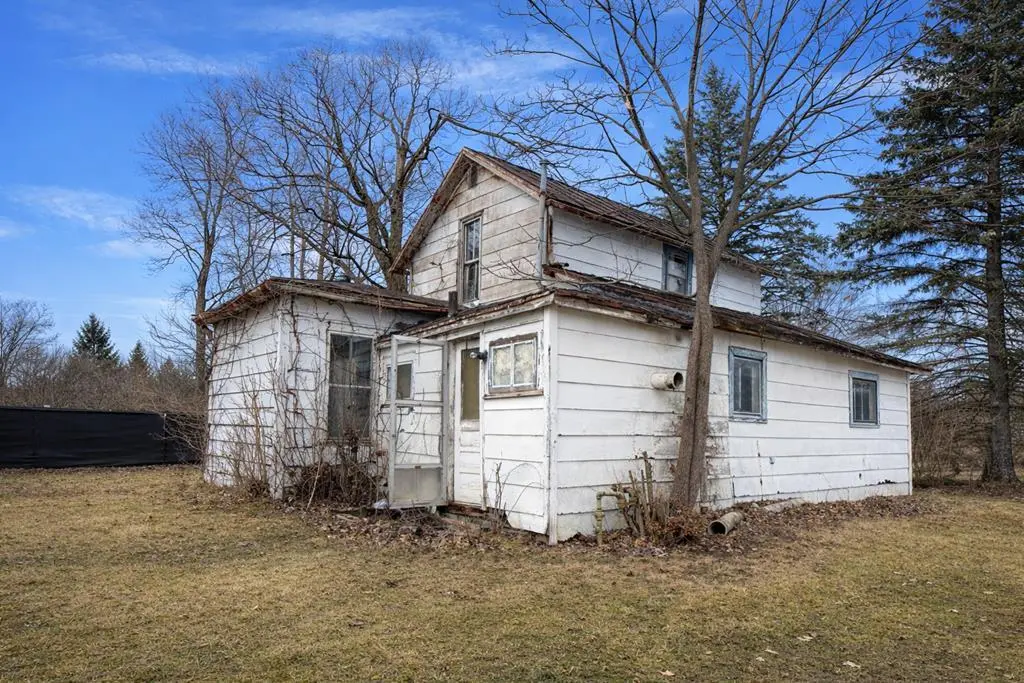
883 Rosewood Dr · Galion, OH
Flood risk 1/10 · Minimal
- FEMA flood zone
- X (unshaded)
- Chance of flooding over 30 yrs
- 0.0%
- Est. flood insurance / yr
- $507 – $1,088
Fire risk 1/10 · Minimal
- Est. fire insurance / yr
- $713 – $1,323
Heat risk 3/10 · Minor
- Hot days now (above 98°F)
- 7 days/yr
- Hot days in 30 yrs
- 17 days/yr
Wind risk 2/10 · Minimal
- Chance of severe wind over 30 yrs
- —
Air-quality risk 2/10 · Minimal
- Unhealthy air days now
- 1 days/yr
- Unhealthy air days in 30 yrs
- 1 days/yr
Risk factors via First Street. Map © Google.
Why this score? — see what drove the B- grade
The composite is a weighted blend of 9 inputs, each scored 0–100. Each bar is that input's sub-score; the figure is the points it added to the 100-point composite (weight × sub-score).
- Cash flow +30.0/30.0
- 1% rule +10.0/10.0
- DSCR +10.0/10.0
- ARV discount +7.5/15.0
- Schools +3.8/10.0
- Livability +3.2/5.0
- Rent growth +2.5/5.0
- Condition / age +2.5/5.0
- Appreciation +0.0/10.0
$29,900
🖨 Deal sheet 📄 Offer letter ✓ Due diligence
Listing remarks MLS
Investor special, with exceptional potential on a desirable corner lot, in a great neighborhood! This property offers solid bones and an ideal layout for your next renovation or investment project. Featuring a main-floor bedroom and convenient main-floor washer and dryer hookup, it provides a functional foundation that today's buyers appreciate. With vision and updates, this home can be transformed into something truly beautiful. Opportunities like this in such a prime location don't come along often—don't miss your chance to unlock its full potential.
Key facts
- Corner lot
- Built 1900
- Listed 118 days
Tags
Neighborhood map
What this means for you Summary
Snapshot
- This is a 2-bed/1.0-bath single-family listed at $30k.
Deal economics
- At list price, monthly cash flow is $686 ($8k/yr) — positive.
- The deal already cash-flows at list — no discount required.
- Meets the 1% rule at list price ($1k rent vs $30k).
- Recommended offer: $27k (9.0% below list) — sets the bar for market timing.
- Cap rate 33.8% vs local median 4.8% in Galion — top-decile yield for the area; either an underpriced asset or a hidden risk that comps aren't pricing in. Stress-test before assuming the spread holds.
Location & tenants
- Location reads 63/100 on livability (#833 in OH) — a middle-class / working-renter tenant base. Strengths: cost of living A+, housing A+, crime A-; Watch: schools C-, amenities F, commute F.
- Galion City (town): math 36% / reading 56% proficiency, ranked #499 of 656 in OH (top 76%) — families likely to look elsewhere, expect single-tenant / working-renter base with shorter leases.
- Market conditions: 76 active listings in the ZIP; 8 units permitted in Crawford County in 2024 (0 in 5+ unit buildings).
Forward outlook
- Local home prices are declining (-3.0%/yr); year-one equity from $207 of loan paydown is wiped out by about $897 of value loss. Plan a longer hold.
- Crawford County population projected at -22% by 2050 — secular population decline; favor cash flow + early exit over multi-decade hold.
- At projected returns (-3.0% appreciation + 3.0% rent growth), your $8k cash investment doubles in ~2 years — after that, you're playing with house money.
Negotiation context
- It's been on market 119 days — a 9% lower offer ($27k) is reasonable based on typical stale-listing flexibility.
- Current owner paid $22k; 36% above their basis — modest negotiation headroom, anchor on the comps not their cost.
Risks & watch-outs
- Watch-outs: built in 1900 — expect roof / HVAC / electrical / plumbing capex.
Questions for the listing agent
- It's been on market 119 days. Have you received any prior offers? Is the seller open to a 9% concession, seller financing, or rate buy-down credit?
- Built in 1900 — when were the roof, HVAC, electrical panel, plumbing, and water heater last replaced?
- Why hasn't it sold? Are there any deal-killer items the seller is aware of (foundation, flood, title, zoning, code violations)?
- Is there a deadline driving the sale (1031 exchange, divorce, estate, relocation)? That informs how much negotiation room exists.
- What's the average days-on-market for RENTAL listings here right now (not sales)? A rising rental-DOM trend means longer vacancies and softer asking-rent achievability than the comps imply.
- What's the recent tenant-quality profile in this submarket — average credit score on applications, eviction rate, late-payment / NSF rate, and stable-employment percentage? A property-management company in the area should have these aggregated.
- How much new for-sale + rental construction is in the pipeline within 1–3 miles? Heavy new supply typically softens prices + rents 12–24 months out; constrained supply supports both.
Investment metrics
- 1% rule
- 3.79% ✓
- Cap rate
- 33.82%
- Cash-on-cash
- 98.32%
- DSCR
- 5.37
- GRM
- 2.2
CMA / ARV
- ARV (median comp)
- $191,292
- List price
- $29,900
- Delta
- -84.37%
- Verdict
- UNDERPRICED
- Comps
- 20 within 1.0 mi
Show comp detail 12 sales within ~0.75 mi
| Address | Dist | Beds/Ba | Sqft | Sold | Price | $/sf | Match |
|---|---|---|---|---|---|---|---|
| 424 John St | 0.39mi | 2/1.0 | 1,294 (-1%) | 4mo | $20,690 | $16 | 77 |
| 283 Hessenauer Dr | 0.29mi | 3/2.0 (+1) | 1,292 (-1%) | 14mo | $170,000 | $132 | 64 |
| 157 Rensch Ave | 0.36mi | 2/2.0 | 1,236 (-5%) | 17mo | $115,000 | $93 | 56 |
| 522 Grand St | 0.49mi | 2/1.0 | 1,222 (-6%) | 13mo | $137,000 | $112 | 56 |
| 763 Sunnyside Dr | 0.28mi | 3/2.5 (+1) | 1,156 (-12%) | 11mo | $199,000 | $172 | 48 |
| 501 Virgil St | 0.53mi | 3/1.0 (+1) | 1,248 (-4%) | 20mo | $153,900 | $123 | 47 |
| 604 Cherry St | 0.56mi | 3/1.0 (+1) | 1,260 (-4%) | 21mo | $127,900 | $102 | 45 |
| 334 West Railroad St | 0.67mi | 3/1.0 (+1) | 1,349 (+3%) | 19mo | $80,000 | $59 | 42 |
| 337 Grove Ave | 0.68mi | 3/1.0 (+1) | 1,494 (+14%) | 0mo | $118,000 | $79 | 39 |
| 985 Highland Ave | 0.71mi | 3/2.0 (+1) | 1,476 (+13%) | 0mo | $190,000 | $129 | 36 |
| 624 W Church St | 0.69mi | 3/1.5 (+1) | 1,480 (+13%) | 15mo | $40,000 | $27 | 26 |
| 139 Arlington Ave | 0.67mi | 3/2.0 (+1) | 1,130 (-14%) | 15mo | $180,000 | $159 | 24 |
Match score weights: distance 35% · size 25% · config 20% · recency 20%. Top-matched comps best support the ARV.
Projected returns pro-forma
-3.0% appreciation · 3.0% rent growth · sell at horizon
- IRR
- 99.3%
- Equity multiple
- 5.64×
- Total profit
- $38,862
- Equity at exit
- $4,458
- IRR
- —
- Equity multiple
- 11.77×
- Total profit
- $90,174
- Equity at exit
- $2,585
Cash invested: $8,372 (down + closing). Projections, not guarantees.
Landlord ↔ Tenant lean methodology
- Overall (STATE)
- 73 Landlord-Friendly
- State Ohio
- 73 Landlord-Friendly · R+6
- County
- — inherits STATE
- City
- — inherits STATE
ZIP-level market 44833
- Home prices YoY
- -27.9%
- Active inventory
- 76
- Price-to-rent
- 2.2×
Monthly cashflow live
- Estimated rent
- $1,134 medium interval (Pro) →
- Mortgage (P&I)
- −$157
- Tax from tax record
- −$41 /mo · $490/yr
- Insurance
- −$12
- HOA
- −$0
- Vacancy / Maint / Mgmt
- −$238
- Net cashflow
- $686
Break-even live
UW: 25.0% down · 7.5% · 30yr · 1.5% tax · 5.0% vac · 8.0% maint · 8.0% mgmt
Financing live
Cash to close
- Down payment
- $7,475
- Closing costs
- $897
- Reserves months
- —
- Total cash needed
- —
Loan-product check · same deal, 3 products live
Conventional
25% down · 7.5% · 30yr
- Down + closing
- —
- Monthly P&I
- —
- Monthly cashflow
- —
- DSCR
- —
- Eligible?
- —
Personal DTI + credit; lowest rate.
DSCR
20% down · 8.5% · 30yr
- Down + closing
- —
- Monthly P&I
- —
- Monthly cashflow
- —
- DSCR
- —
- Eligible?
- —
No personal income docs; deal must DSCR.
Hard money
10% down · 12.0% · 12mo
- Down + closing
- —
- Monthly P&I
- —
- Monthly cashflow
- —
- DSCR
- —
- Eligible?
- —
Short-term bridge; refi at stabilization.
Listing history 17 events
-
2026-06-19days on market $29,900 Active 119 DOM
-
2026-06-18days on market $29,900 Active 118 DOM
-
2026-06-17days on market $29,900 Active 117 DOM
-
2026-06-16days on market $29,900 Active 116 DOM
-
2026-06-15days on market $29,900 Active 115 DOM
-
2026-06-14days on market $29,900 Active 113 DOM
-
2026-06-12days on market $29,900 Active 112 DOM
-
2026-06-09days on market $29,900 Active 109 DOM
-
2026-06-08days on market $29,900 Active 108 DOM
-
2026-06-07days on market $29,900 Active 107 DOM
-
2026-06-02days on market $29,900 Active 102 DOM
-
2026-06-01days on market $29,900 Active 101 DOM
-
2026-05-31days on market $29,900 Active 100 DOM
-
2026-05-30days on market $29,900 Active 99 DOM
-
2026-05-08price $29,900 564-char remark
Show marketing remark (564 chars)
Investor special, with exceptional potential on a desirable corner lot, in a great neighborhood! This property offers solid bones and an ideal layout for your next renovation or investment project. Featuring a main-floor bedroom and convenient main-floor washer and dryer hookup, it provides a functional foundation that today's buyers appreciate. With vision and updates, this home can be transformed into something truly beautiful. Opportunities like this in such a prime location don't come along often—don't miss your chance to unlock its full potential.
-
2026-02-20$34,900 Active 564-char remark
Show marketing remark (564 chars)
Investor special, with exceptional potential on a desirable corner lot, in a great neighborhood! This property offers solid bones and an ideal layout for your next renovation or investment project. Featuring a main-floor bedroom and convenient main-floor washer and dryer hookup, it provides a functional foundation that today's buyers appreciate. With vision and updates, this home can be transformed into something truly beautiful. Opportunities like this in such a prime location don't come along often—don't miss your chance to unlock its full potential.
-
2008-04-25soldstatus $22,000
ⓘ Source: listings_history table (triggers on properties + properties_extension) + one-shot
backfill from property_details.listing_events for pre-trigger history.
Tax reassessment forecast OH · Partial reset (capped growth)
- Current annual tax
- $490 · $41/mo
- Projected year-2 tax
- $490 · $41/mo
- Expected delta
- $0/yr ($0/mo · -0.0%)
ⓘ Screening estimate from a state-policy table — verify with the county assessor before closing.
Climate risk First Street
- Flood 1/10 Low FEMA zone X (unshaded) · 0% chance over 30 yrs
- Wildfire 1/10 Low
- Heat 3/10 Moderate 7 d/yr ≥98°F today · 17 d/yr by 30 yrs out
- Wind 2/10 Low
- Air quality 2/10 Low 1 unhealthy d/yr today · 1 by 30 yrs out
Nearby sold comps map
Loading sold comps map…
Walkable amenities ~0.75 mi
Loading nearby amenities…
Taxation est. · year 1
- Rental income
- $13,611
- − Mortgage interest
- −$1,675
- − Property taxes
- −$490
- − Insurance
- −$150
- − Repairs & maintenance
- −$1,089
- − Management
- −$1,089
- − Depreciation
- −$870
- Taxable income
- $8,249
- Est. tax owed @ 24.0%
- −$1,980
- After-tax cash flow
- $6,252/yr
For passive investors: Depreciation is non-cash, so a rental often shows a tax loss while cash-flowing — sheltering income. Rental losses are passive: they offset passive income freely, and up to $25,000/yr can offset ordinary (W-2) income if you actively participate and your MAGI is under $100k (phasing out to $0 by $150k); unused losses carry forward. On sale, claimed depreciation is recaptured at up to 25%, and gains may owe capital-gains tax (a 1031 exchange can defer both). Figures are a year-1 estimate at your 24.0% rate — not tax advice; consult a CPA.
Schools (NCES district)
- District
- Galion City
- NCES district ID
- 3904402
- Math proficiency
- 36% ▼ -12.00%
- Reading proficiency
- 56% ▬ 0.00%
- Median HH income
- $36,331
- Composite
- 38.08/100
- National rank
- #4279
- State rank
- #499 of 656 in OH
Livability — Galion
- Score
- 63/100
- State rank
- #833
- US rank
- #15587
Category grades
Schools grade is shown separately in the Schools card above.
Census & demographics
- Census place
- Galion, OH
- County
- Morrow · 41,908 people
- City population
- 16,641
- Metro
- Columbus, OH
- Population (ZIP)
- 16,641
- Household income
- $57,234
- Rent vs Own
- Severe rent burden
- 3.8
Population outlook (Crawford County) Hauer SSP2
- Today (2025)
- 39,421 people
- By 2030
- 37,656 · -4.5%
- By 2040
- 34,043 · -13.6%
- By 2050
- 30,617 · -22.3%
- By 2075
- 23,652 · -40.0%
- By 2100
- 17,786 · -54.9%
Race, ethnicity, and origin ACS 2023
- Neighborhood character
- Predominantly White (96%)
- Race & ethnicity
- White 96% Two or more races 2% Hispanic / Latino 2%
- Common ancestry
- Slovak 2% Romanian 2% Lithuanian 2%
- Foreign-born
- 1% · Canada
- Languages at home
- 98% English-only · Spanish 1% German/W. Germanic 1%
Political lean MEDSL · Crawford
- 2024 margin
- Solid R (+53.0) · D 23.1% · R 76.1%
- 2008→2024 swing
- -33.9pp toward R · 2008: -19.0pp · 2024: -53.0pp
- All cycles
- 2024: R+53.0 2020: R+50.9 2016: R+46.8 2012: R+22.7 2008: R+19.0
Not yet ingested
- Civics
- —
Market trends
- HPI YoY
- ▼ -84.57%
- Current HPI
- 218.195
- Rent YoY
- —
- Metro
- —
- State GDP YoY
- ▲ 1.98%
- F500 in state
- 48
Industry mix (Fortune 500 HQ in OH)
| Industry | F500 HQs | Revenue |
|---|---|---|
| Insurance | 3 | $145B |
|
||
| Industrial Machinery | 3 | $49B |
|
||
| Financial Services | 3 | $24B |
|
||
| Consumer Goods | 2 | $93B |
|
||
| Aerospace / Defense | 2 | $47B |
|
||
| Utilities | 2 | $33B |
|
||
Price history
+35.9% since first listed3 events — show timeline
- 2026-05-08 Price Changed $29,900 MARMLS
- 2026-02-20 Listed $34,900 MARMLS
- 2008-04-25 Sold (Public Records) $22,000 Public Records
Property tax history
+1.2%/yrLatest (2025): $490 · -0.3% YoY. Source: county tax records.
Cash-flow waterfall
monthlySold comps — $/sqft
last 12 mo · ≤1 miLoading sold comps…