 Fourplex
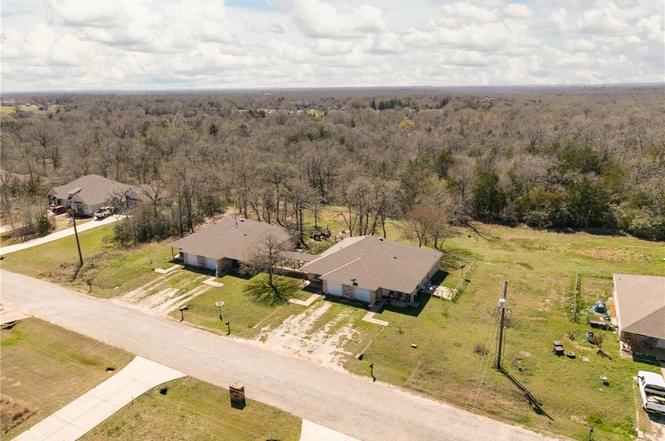
17292-17298 Cedar Rock Ct Ct · College Station, TX
Flood risk 1/10 · Minimal
- FEMA flood zone
- X (unshaded)
- Chance of flooding over 30 yrs
- 0.0%
- Est. flood insurance / yr
- $507 – $1,088
Fire risk 4/10 · Minor
- Est. fire insurance / yr
- $1,222 – $2,270
Heat risk 8/10 · Major
- Hot days now (above 111°F)
- 7 days/yr
- Hot days in 30 yrs
- 23 days/yr
Wind risk 8/10 · Major
- Chance of severe wind over 30 yrs
- 92.0%
Air-quality risk 1/10 · Minimal
- Unhealthy air days now
- 0 days/yr
- Unhealthy air days in 30 yrs
- 0 days/yr
Risk factors via First Street. Map © Google.
Why this score? — see what drove the D+ grade
The composite is a weighted blend of 9 inputs, each scored 0–100. Each bar is that input's sub-score; the figure is the points it added to the 100-point composite (weight × sub-score).
- Cash flow +17.5/30.0
- ARV discount +7.5/15.0
- DSCR +5.5/10.0
- 1% rule +4.9/10.0
- Schools +4.7/10.0
- Livability +4.2/5.0
- Rent growth +3.3/5.0
- Condition / age +2.5/5.0
- Appreciation +0.0/10.0
$525,000
🖨 Deal sheet 📄 Offer letter ✓ Due diligence
Multi-family units
County records classify this as Multi-Family (2-4 Unit). Listing-text estimate: 4 units. confirmed
Listing remarks
Investor opportunity in College Station! This fully leased fourplex on Cedar Rock Ct offers a rare combination of strong rental income, privacy, and location. Each of the four units includes 2 bedrooms, 1.5 baths, spacious living areas, separate dining rooms, functional kitchens, and attached garages. Tenants enjoy large private fenced backyards, giving them the space and comfort of a single-family home while living in a multi-family property. The property sits on 1 acre in a quiet cul-de-sac, providing a peaceful country feel while still being just minutes from College Station and Texas A & M University. Recent upgrades include a new roof (June 2025) and three new water heaters (Octobe
Key facts
- Recent upgrades
- Quiet cul-de-sac
- Strong rental income
Tags
Property features AI
Finance
- Financial info: Actual rents listed for units: three units at $950 and one unit at $1,100
Exterior
- Home design: Residential income property; Quadruplex; Single-story
- Construction: Brick veneer construction
- Exterior features: Chain link fencing; Shingle roof
Interior
- Kitchen: Dishwasher; Electric range; Microwave; Refrigerator
- Bedrooms: Four 2-bedroom units
- Flooring: Carpet; Tile; Vinyl
- Bathrooms: Four 2-bathroom units
- Heating & cooling: Central heating (electric); Central air conditioning (electric)
- Interior features: Unfurnished; Dishwasher; Electric range; Microwave; Refrigerator; Electric water heater; Washer hookup
- Laundry & utility: Washer hookup; Electric water heater
Neighborhood map
What this means for you Summary
Snapshot
- This is a 4 × 2.0-bed/1.5-bath units multifamily listed at $525k.
Deal economics
- At list price, monthly cash flow is $403 ($5k/yr) — positive. Per door: $101/mo.
- The deal already cash-flows at list — no discount required.
- To meet the 1% rule (rent ≥ 1% of price), the offer needs to be $518k (1.4% below list).
- Recommended offer: $494k (6.0% below list) — sets the bar for market timing.
- Cap rate 7.2% vs local median 3.3% in College Station — top-decile yield for the area; either an underpriced asset or a hidden risk that comps aren't pricing in. Stress-test before assuming the spread holds.
Location & tenants
- Location reads 83/100 on livability (#11 in TX, #994 nationally) — a professional / high-income tenant draw. Strengths: amenities A+, commute A+, crime A-; Watch: employment C-.
- College Station ISD (urban): math 58% / reading 54% proficiency, ranked #113 of 826 in TX (top 14%) — acceptable for families but not a draw, mixed tenant base, ~2y average lease.
- Market conditions: Rents rising (+3.1%/yr); 1168 active listings in the ZIP; solid renter incomes; 2,211 units permitted in Brazos County in 2024 (768 in 5+ unit buildings).
- At $5,179/mo this rent would consume 70% of the median local household income ($89k/yr) (locally 3329% of renters already pay >50% of income on rent) — very limited rent-growth headroom before tenants either downsize or default.
Forward outlook
- Local home prices are declining (-3.0%/yr); year-one equity from $4k of loan paydown is wiped out by about $16k of value loss. Plan a longer hold.
- Brazos County population projected at +55% by 2050 — long-run rental-demand tailwind backs the buy-and-hold thesis.
Negotiation context
- It's been on market 67 days — a 6% lower offer ($494k) is reasonable based on typical stale-listing flexibility.
Risks & watch-outs
- Climate carrying-cost: severe wind risk, 92% chance of damaging wind over 30y; extreme-heat days projected 7→23/yr by 2055 (HVAC capex compounding) — expect insurance premiums to compound above CPI over the hold.
Questions for the listing agent
- It's been on market 67 days. Have you received any prior offers? Is the seller open to a 6% concession, seller financing, or rate buy-down credit?
- Can we see the unit-by-unit rent roll, current vacancy, and any below-market leases? What's the average tenancy length?
- What capital expenditures (roof, boiler, parking lot, exteriors) have been made in the last 5 years, and what's planned in the next 2?
- Why hasn't it sold? Are there any deal-killer items the seller is aware of (foundation, flood, title, zoning, code violations)?
- Is there a deadline driving the sale (1031 exchange, divorce, estate, relocation)? That informs how much negotiation room exists.
- Schools are B-rated — typically a magnet for longer-tenancy family renters. What's the average tenant stay here, and is there a school-zone premium baked into asking?
- The area grade is low — what's the realistic commute time and amenity access for the typical tenant pool here? Any planned neighborhood developments (good or bad) we should know about?
- What's the average days-on-market for RENTAL listings here right now (not sales)? A rising rental-DOM trend means longer vacancies and softer asking-rent achievability than the comps imply.
- What's the recent tenant-quality profile in this submarket — average credit score on applications, eviction rate, late-payment / NSF rate, and stable-employment percentage? A property-management company in the area should have these aggregated.
- How much new apartment / multifamily construction is in the pipeline within 1–3 miles? Heavy new supply (>2% of stock underway) typically softens rents 12–24 months out; light construction supports rent growth.
Investment metrics
- 1% rule
- 0.99% ✗
- Cap rate
- 7.21%
- Cash-on-cash
- 3.29%
- DSCR
- 1.15
- GRM
- 8.4
CMA / ARV
No comps found within radius.
Projected returns pro-forma
-3.0% appreciation · 3.13% rent growth · sell at horizon
- IRR
- -11.0%
- Equity multiple
- 0.60×
- Total profit
- $-58,637
- Equity at exit
- $78,279
- IRR
- -1.5%
- Equity multiple
- 0.90×
- Total profit
- $-14,783
- Equity at exit
- $45,392
Cash invested: $147,000 (down + closing). Projections, not guarantees.
Landlord ↔ Tenant lean methodology
- Overall (STATE)
- 87 Strongly Landlord-Friendly
- State Texas
- 87 Strongly Landlord-Friendly · R+5
- County
- — inherits STATE
- City
- — inherits STATE
ZIP-level market 77845
- Rents YoY
- 3.1%
- Active inventory
- 1168
- Price-to-rent
- 33.8×
Monthly cashflow live
- Estimated rent
- $5,179 medium interval (Pro) →
- Mortgage (P&I)
- −$2,753
- Tax from tax record
- −$717 /mo · $8,603/yr
- Insurance
- −$219
- HOA
- −$0
- Vacancy / Maint / Mgmt
- −$1,088
- Net cashflow
- $403
Break-even live
4-unit breakdown (identical units grouped — click to expand)
| Units | Beds | Baths | Est. rent |
|---|---|---|---|
| 4× units | 2.0 | 1.5 | $5,180 |
| #1 | 2.0 | 1.5 | $1,295 |
| #2 | 2.0 | 1.5 | $1,295 |
| #3 | 2.0 | 1.5 | $1,295 |
| #4 | 2.0 | 1.5 | $1,295 |
| Total (4 units) | $5,179 | ||
UW: 25.0% down · 7.5% · 30yr · 1.5% tax · 5.0% vac · 8.0% maint · 8.0% mgmt
Financing live
Cash to close
- Down payment
- $131,250
- Closing costs
- $15,750
- Reserves months
- —
- Total cash needed
- —
Loan-product check · same deal, 3 products live
Conventional
25% down · 7.5% · 30yr
- Down + closing
- —
- Monthly P&I
- —
- Monthly cashflow
- —
- DSCR
- —
- Eligible?
- —
Personal DTI + credit; lowest rate.
DSCR
20% down · 8.5% · 30yr
- Down + closing
- —
- Monthly P&I
- —
- Monthly cashflow
- —
- DSCR
- —
- Eligible?
- —
No personal income docs; deal must DSCR.
Hard money
10% down · 12.0% · 12mo
- Down + closing
- —
- Monthly P&I
- —
- Monthly cashflow
- —
- DSCR
- —
- Eligible?
- —
Short-term bridge; refi at stabilization.
Listing history 4 events
-
2026-05-13status Pending
-
2026-04-28historical Active Under Contract
-
2026-03-06$525,000 Active
-
2007-07-23soldstatus
ⓘ Source: listings_history table (triggers on properties + properties_extension) + one-shot
backfill from property_details.listing_events for pre-trigger history.
Tax reassessment forecast TX · Resets to sale price
- Current annual tax
- $8,603 · $717/mo
- Projected year-2 tax
- $9,608 · $801/mo
- Expected delta
- +$1,005/yr (+$84/mo · 11.7%)
ⓘ Screening estimate from a state-policy table — verify with the county assessor before closing.
Climate risk First Street
- Flood 1/10 Low FEMA zone X (unshaded) · 0% chance over 30 yrs
- Wildfire 4/10 Moderate
- Heat 8/10 Severe 7 d/yr ≥111°F today · 23 d/yr by 30 yrs out
- Wind 8/10 Severe 92% chance of damaging wind over 30 yrs
- Air quality 1/10 Low 0 unhealthy d/yr today · 0 by 30 yrs out
Nearby sold comps map
Loading sold comps map…
Walkable amenities ~0.75 mi
Loading nearby amenities…
Taxation est. · year 1
- Rental income
- $62,148
- − Mortgage interest
- −$29,408
- − Property taxes
- −$8,603
- − Insurance
- −$2,625
- − Repairs & maintenance
- −$4,972
- − Management
- −$4,972
- − Depreciation
- −$15,273
- Taxable loss
- −$3,704
- Est. tax savings @ 24.0%
- +$889
- After-tax cash flow
- $5,720/yr
For passive investors: Depreciation is non-cash, so a rental often shows a tax loss while cash-flowing — sheltering income. Rental losses are passive: they offset passive income freely, and up to $25,000/yr can offset ordinary (W-2) income if you actively participate and your MAGI is under $100k (phasing out to $0 by $150k); unused losses carry forward. On sale, claimed depreciation is recaptured at up to 25%, and gains may owe capital-gains tax (a 1031 exchange can defer both). Figures are a year-1 estimate at your 24.0% rate — not tax advice; consult a CPA.
Schools (NCES district)
- District
- College Station ISD
- NCES district ID
- 4807350
- Math proficiency
- 58% ▼ -4.00%
- Reading proficiency
- 54% ▼ -2.00%
- Median HH income
- $36,991
- Composite
- 46.54/100
- National rank
- #2428
- State rank
- #113 of 826 in TX
Livability — College Station
- Score
- 83/100
- State rank
- #11
- US rank
- #994
Category grades
Schools grade is shown separately in the Schools card above.
Census & demographics
- County
- Brazos County · 233,400 people
- City population
- 131,628
- Metro
- College Station-Bryan, TX
- Population (ZIP)
- 76,764
- Household income
- $88,851
- Rent vs Own
- Severe rent burden
- 3329.0
Population outlook (Brazos County) Hauer SSP2
- Today (2025)
- 267,942 people
- By 2030
- 296,630 · +10.7%
- By 2040
- 354,560 · +32.3%
- By 2050
- 414,616 · +54.7%
- By 2075
- 562,158 · +109.8%
- By 2100
- 678,828 · +153.3%
Race, ethnicity, and origin ACS 2023
- Neighborhood character
- Predominantly White (69%)
- Race & ethnicity
- White 69% Hispanic / Latino 16% Two or more races 9% Asian 8% Black 5%
- Hispanic origin (detail)
- Mexican 12%
- Common ancestry
- Lithuanian 2% Romanian 2% Italian 2%
- Foreign-born
- 11% · Canada, China, South Korea
- Languages at home
- 83% English-only · Spanish 8% Other Indo-European 3% Chinese 2%
Political lean MEDSL · Brazos
- 2024 margin
- Strong R (+24.9) · D 36.9% · R 61.7% · Other 1.4%
- 2008→2024 swing
- +4.1pp toward D · 2008: -28.9pp · 2024: -24.9pp
- All cycles
- 2024: R+24.9 2020: R+14.3 2016: R+23.7 2012: R+35.3 2008: R+28.9
Not yet ingested
- Civics
- —
Market trends
- HPI YoY
- ▼ -133.31%
- Current HPI
- 175.9669
- Rent YoY
- ▲ 3.13%
- Metro
- College Station-Bryan, TX
- State GDP YoY
- ▲ 3.95%
- F500 in state
- 110
Industry mix (Fortune 500 HQ in TX)
| Industry | F500 HQs | Revenue |
|---|---|---|
| Energy | 16 | $1,198B |
|
||
| Technology | 5 | $198B |
|
||
| Engineering / Construction | 4 | $72B |
|
||
| Energy Services | 3 | $60B |
|
||
| Utilities | 3 | $41B |
|
||
| Healthcare | 2 | $330B |
|
||
Price history
4 events — show timeline
- 2026-05-13 Pending — BCSRMLS
- 2026-04-28 Contingent — BCSRMLS
- 2026-03-06 Listed $525,000 BCSRMLS
- 2007-07-23 Sold (Public Records) — Public Records
Property tax history
+3.0%/yrLatest (2025): $8,603 · +11.7% YoY. Source: county tax records.
Cash-flow waterfall
monthlySold comps — $/sqft
last 12 mo · ≤1 miLoading sold comps…