 Multi-family
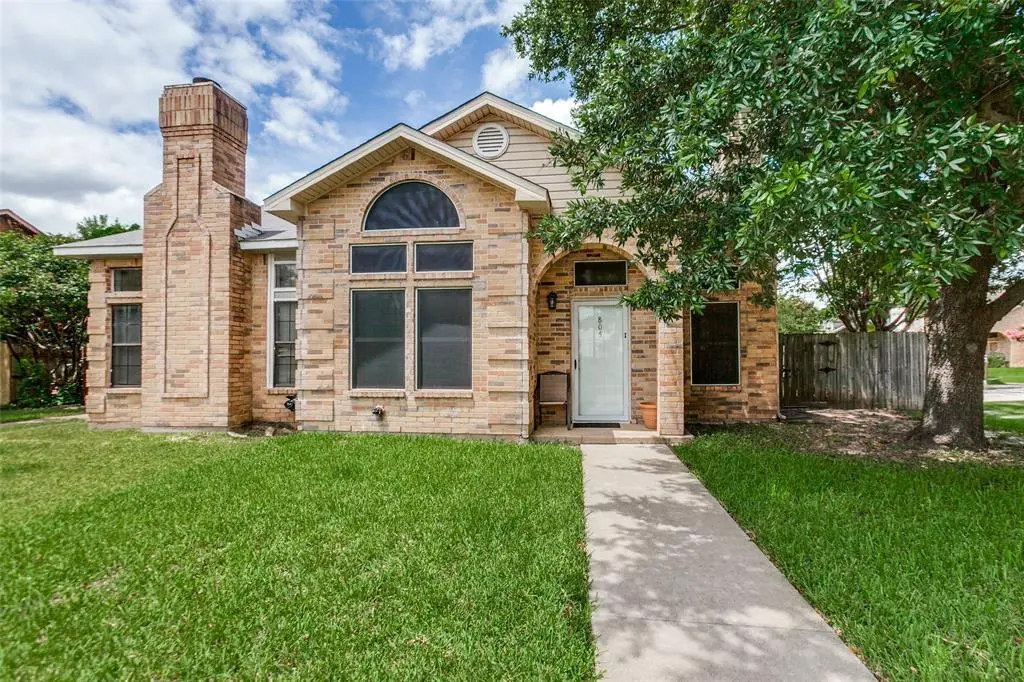
805 Brockden Dr · Mesquite, TX
Flood risk 1/10 · Minimal
- FEMA flood zone
- X (unshaded)
- Chance of flooding over 30 yrs
- 0.0%
- Est. flood insurance / yr
- $507 – $1,088
Fire risk 1/10 · Minimal
- Est. fire insurance / yr
- $1,222 – $2,270
Heat risk 8/10 · Major
- Hot days now (above 111°F)
- 7 days/yr
- Hot days in 30 yrs
- 24 days/yr
Wind risk 6/10 · Moderate
- Chance of severe wind over 30 yrs
- 27.0%
Air-quality risk 2/10 · Minimal
- Unhealthy air days now
- 1 days/yr
- Unhealthy air days in 30 yrs
- 2 days/yr
Risk factors via First Street. Map © Google.
Why this score? — see what drove the C- grade
The composite is a weighted blend of 9 inputs, each scored 0–100. Each bar is that input's sub-score; the figure is the points it added to the 100-point composite (weight × sub-score).
- Cash flow +19.6/30.0
- ARV discount +7.5/15.0
- 1% rule +6.7/10.0
- DSCR +6.2/10.0
- Livability +3.5/5.0
- Schools +2.9/10.0
- Rent growth +2.6/5.0
- Condition / age +2.5/5.0
- Appreciation +0.0/10.0
$149,000
🖨 Deal sheet 📄 Offer letter ✓ Due diligence
Multi-family units
County records classify this as Multi-Family (2-4 Unit). Listing-text estimate: 1 unit. estimate disagrees with records
Listing remarks
MULTIPLE OFFERS RECEIVED - DEADLINE FOR BEST AND FINAL OFFERS IS THURSDAY JUNE 18TH AT 7PM. INVESTOR OPPORTUNITY IN MESQUITE! Corner-lot duplex featuring 3 bedrooms, 2 bathrooms, vaulted ceilings, a fireplace, private yard, covered carport parking, and convenient alley access. The functional floorplan includes two bedrooms and a full bathroom on the first floor, with a private primary suite occupying the second level, offering added privacy and flexibility. Abundant natural light, attractive curb appeal, and a desirable layout create strong value-add potential for investors or buyers looking to build equity through improvements. Conveniently located with easy access to shopping, dining, sch
Key facts
- Alley access
- Private yard
- Functional floorplan
Tags
Property features AI
Finance
- Financial info: Listing accepts Cash, Conventional and Other financing
- HOA & community: No homeowners association
Exterior
- Parking: Covered carport (2 spaces); Driveway parking
- Utilities: City water; City sewer; Electricity available; Cable available; Curbs
- Home design: Single-family residence (attached); Built in 1987; Shingle/composition roof; Slab foundation; Facing information not provided
- Construction: Composition/Shingle roof; Slab foundation; Built in 1987
- Exterior features: Private yard; Storage shed(s); Wood fencing with gate around backyard; Corner lot with landscaping and few trees; Level lot
Interior
- Kitchen: Galley kitchen with breakfast bar; Electric range; Dishwasher; Disposal; Refrigerator; Electric water heater
- Bedrooms: Primary bedroom on upper level with ensuite bath, garden tub and linen closet; Two additional bedrooms on main level
- Flooring: Carpet; Laminate; Tile
- Bathrooms: Two full bathrooms; Primary bathroom with garden tub
- Heating & cooling: Central air; Electric heating; Fireplace(s) for supplemental heat
- Interior features: Cathedral ceilings; Cable TV available; Bay window; Skylights; Window coverings; 8 total rooms; 1 living area; 1 dining area; One-and-one-half levels
- Laundry & utility: Full-size washer/dryer area; Electric dryer hookup
Neighborhood map
What this means for you Summary
Snapshot
- This is a 3-bed/2.0-bath multifamily listed at $149k.
Deal economics
- At list price, monthly cash flow is $173 ($2k/yr) — positive.
- The deal already cash-flows at list — no discount required.
- Meets the 1% rule at list price ($2k rent vs $149k).
- Cap rate 7.7% vs local median 4.4% in Mesquite — top-decile yield for the area; either an underpriced asset or a hidden risk that comps aren't pricing in. Stress-test before assuming the spread holds.
Location & tenants
- Location reads 70/100 on livability (#358 in TX) — a middle-class / working-renter tenant base. Strengths: cost of living A+, housing A+, health & safety A-; Watch: crime F, commute F.
- Mesquite ISD (suburban): math 35% / reading 32% proficiency, ranked #536 of 826 in TX (top 65%) — families likely to look elsewhere, expect single-tenant / working-renter base with shorter leases; 63% free/reduced lunch — lower-income household profile, screen leases tightly.
- Zoned schools: Hanby El (math 35% / reading 30%, grade F, #2,234 of 4,322 statewide, top 52%, 756 students, 90% FRL) — zoned schools average 90% FRL vs 63% district-wide (27 pts higher); higher-poverty schools than district average — tighter screening recommended.
- Market conditions: Rents flat; 340 active listings in the ZIP; 36 comparable units currently listed for rent nearby; rentals at typical pace (median 17d on market — plan ~3-4 weeks tenant-placement turnaround); 12,577 units permitted in Dallas County in 2024 (6,829 in 5+ unit buildings).
Forward outlook
- Local home prices are declining (-3.0%/yr); year-one equity from $1k of loan paydown is wiped out by about $4k of value loss. Plan a longer hold.
- Dallas County population projected at +35% by 2050 — long-run rental-demand tailwind backs the buy-and-hold thesis.
Negotiation context
- Only 6 days on market — expect competitive offers; lowballing is unlikely to land.
Risks & watch-outs
- Watch-outs: property tax is 2.9% of price.
- Climate carrying-cost: major wind risk, 27% chance of damaging wind over 30y; extreme-heat days projected 7→24/yr by 2055 (HVAC capex compounding) — expect insurance premiums to compound above CPI over the hold.
Questions for the listing agent
- Property tax is high relative to price — has the assessment been appealed recently, and will the sale trigger a re-assessment?
- Is there a deadline driving the sale (1031 exchange, divorce, estate, relocation)? That informs how much negotiation room exists.
- Crime grade is F in this area — have there been break-ins, vandalism, or insurance claims at this property in the last 3 years? What carrier currently insures it and at what premium?
- What's the average days-on-market for RENTAL listings here right now (not sales)? A rising rental-DOM trend means longer vacancies and softer asking-rent achievability than the comps imply.
- What's the recent tenant-quality profile in this submarket — average credit score on applications, eviction rate, late-payment / NSF rate, and stable-employment percentage? A property-management company in the area should have these aggregated.
- How much new apartment / multifamily construction is in the pipeline within 1–3 miles? Heavy new supply (>2% of stock underway) typically softens rents 12–24 months out; light construction supports rent growth.
Investment metrics
- 1% rule
- 1.17% ✓
- Cap rate
- 7.69%
- Cash-on-cash
- 4.98%
- DSCR
- 1.22
- GRM
- 7.1
CMA / ARV
No comps found within radius.
Projected returns pro-forma
-3.0% appreciation · 0.22% rent growth · sell at horizon
- IRR
- -12.1%
- Equity multiple
- 0.58×
- Total profit
- $-17,718
- Equity at exit
- $22,216
- IRR
- -8.5%
- Equity multiple
- 0.54×
- Total profit
- $-19,060
- Equity at exit
- $12,883
Cash invested: $41,720 (down + closing). Projections, not guarantees.
Landlord ↔ Tenant lean methodology
- Overall (STATE)
- 87 Strongly Landlord-Friendly
- State Texas
- 87 Strongly Landlord-Friendly · R+5
- County
- — inherits STATE
- City
- — inherits STATE
ZIP-level market 75149
- Home prices YoY
- -27.4%
- Rents YoY
- 0.2%
- Active inventory
- 340
- Price-to-rent
- 7.1×
Monthly cashflow live
- Estimated rent
- $1,738 high interval (Pro) →
- Mortgage (P&I)
- −$781
- Tax from tax record
- −$357 /mo · $4,278/yr
- Insurance
- −$62
- HOA
- −$0
- Vacancy / Maint / Mgmt
- −$365
- Net cashflow
- $173
Break-even live
UW: 25.0% down · 7.5% · 30yr · 1.5% tax · 5.0% vac · 8.0% maint · 8.0% mgmt
Financing live
Cash to close
- Down payment
- $37,250
- Closing costs
- $4,470
- Reserves months
- —
- Total cash needed
- —
Loan-product check · same deal, 3 products live
Conventional
25% down · 7.5% · 30yr
- Down + closing
- —
- Monthly P&I
- —
- Monthly cashflow
- —
- DSCR
- —
- Eligible?
- —
Personal DTI + credit; lowest rate.
DSCR
20% down · 8.5% · 30yr
- Down + closing
- —
- Monthly P&I
- —
- Monthly cashflow
- —
- DSCR
- —
- Eligible?
- —
No personal income docs; deal must DSCR.
Hard money
10% down · 12.0% · 12mo
- Down + closing
- —
- Monthly P&I
- —
- Monthly cashflow
- —
- DSCR
- —
- Eligible?
- —
Short-term bridge; refi at stabilization.
Rent comps 36 comps
| Address | Beds | Baths | Sqft | Rent | $/sqft | DOM | Units | Dist |
|---|---|---|---|---|---|---|---|---|
| 732 Versailles St Mesquite, TX | 3.0 | 2.0 | 1325 | $1,649 | $1.24 | 7d | 1 | 0.07mi |
| 822 Colchester Dr Mesquite, TX | 2.0 | 2.0 | 1064 | $1,650 | $1.55 | 7d | 1 | 0.13mi |
| 701 Lee St Unit 2A Mesquite, TX | 2.0 | 1.5 | 1073 | $1,600 | $1.49 | 12d | 1 | 0.14mi |
| 817 Denmark Dr Mesquite, TX | 3.0 | 2.0 | 1229 | $1,625 | $1.32 | 7d | 1 | 0.18mi |
| 804 W Grubb Dr Mesquite, TX | 3.0 | 1.5 | 1314 | $1,800 | $1.37 | 11d | 1 | 0.23mi |
| 1021 Irene Dr Mesquite, TX | 3.0 | 1.0 | 1065 | $1,745 | $1.64 | 2d | 1 | 0.41mi |
| 400 Highland Village Dr Unit 520 Mesquite, TX | 2.0 | 1.0 | 953 | $1,349 | $1.42 | 43d | 1 | 0.44mi |
| 400 Highland Village Dr Unit 633 Mesquite, TX | 2.0 | 1.0 | 853 | $1,480 | $1.74 | 43d | 1 | 0.44mi |
| 400 Highland Village Dr Unit 649 Mesquite, TX | 2.0 | 1.0 | 853 | $1,425 | $1.67 | 12d | 1 | 0.44mi |
| 400 Highland Village Dr Unit 565 Mesquite, TX | 2.0 | 1.0 | 953 | $1,399 | $1.47 | 43d | 1 | 0.44mi |
| 1218 Gate Lane Dr Mesquite, TX | 3.0 | 1.0 | 950 | $1,495 | $1.57 | 16d | 1 | 0.62mi |
| 1218 Gate Lane Dr Mesquite, TX | 3.0 | 1.0 | 950 | $1,495 | $1.57 | 24d | 1 | 0.62mi |
| 724 Melinda Dr Mesquite, TX | 3.0 | 2.0 | 1400 | $1,950 | $1.39 | 1d | 1 | 0.67mi |
| 324 Crooked Ln Mesquite, TX | 2.0 | 2.0 | 1248 | $1,700 | $1.36 | 12d | 1 | 0.72mi |
| 1528 Longview St Mesquite, TX | 3.0 | 1.0 | 989 | $1,790 | $1.81 | 16d | 1 | 0.75mi |
| 232 Alexandria St Mesquite, TX | 3.0 | 2.5 | 1370 | $1,795 | $1.31 | 43d | 1 | 0.76mi |
| 1529 Longview St Mesquite, TX | 3.0 | 1.5 | 1160 | $1,695 | $1.46 | 43d | 1 | 0.78mi |
| 211 Athel Dr Mesquite, TX | 3.0 | 2.0 | 1362 | $2,100 | $1.54 | 7d | 1 | 0.81mi |
| 226 Wilderness Trl Mesquite, TX | 2.0 | 2.0 | 1136 | $1,650 | $1.45 | 43d | 1 | 0.81mi |
| 337 Conger Dr Mesquite, TX | 3.0 | 2.0 | 1177 | $1,900 | $1.61 | 16d | 1 | 0.82mi |
| 1504 Valley View St Mesquite, TX | 3.0 | 1.0 | 1240 | $1,555 | $1.25 | 2d | 1 | 0.82mi |
| 1504 Valley View St Mesquite, TX | 3.0 | 1.0 | 1240 | $1,621 | $1.31 | 7d | 1 | 0.82mi |
| 1520 Valley View St Unit Labs Mesquite, TX | 4.0 | 2.0 | 1240 | $1,800 | $1.45 | 5d | 1 | 0.84mi |
| 115 Wilderness Trl Mesquite, TX | 3.0 | 2.0 | 1350 | $1,845 | $1.37 | 43d | 1 | 0.88mi |
| 1232 Redman Ave Mesquite, TX | 3.0 | 2.0 | 1250 | $1,750 | $1.40 | 43d | 1 | 1.04mi |
| 1213 Redman Ave Mesquite, TX | 3.0 | 2.0 | 1225 | $1,650 | $1.35 | 12d | 1 | 1.08mi |
| 1149 Redman Ave Mesquite, TX | 3.0 | 2.0 | 1225 | $1,750 | $1.43 | 43d | 1 | 1.08mi |
| 1513 Liberty Ln Mesquite, TX | 3.0 | 2.5 | 1393 | $1,925 | $1.38 | 7d | 1 | 1.09mi |
| 334 Freeman St Mesquite, TX | 3.0 | 2.0 | 1330 | $2,180 | $1.64 | 7d | 1 | 1.10mi |
| 1917 Buffalo Hill Dr Mesquite, TX | 3.0 | 2.5 | 1409 | $2,300 | $1.63 | 24d | 1 | 1.15mi |
| 1817 Belmont St Mesquite, TX | 4.0 | 2.0 | 1338 | $1,950 | $1.46 | 43d | 1 | 1.16mi |
| 2020 Ridgeview Plz Mesquite, TX | 3.0 | 2.0 | 1355 | $2,000 | $1.48 | 43d | 1 | 1.34mi |
| 2225 Janice St Mesquite, TX | 3.0 | 1.5 | 1392 | $1,695 | $1.22 | 24d | 1 | 1.35mi |
| 112 Derby Ln Mesquite, TX | 3.0 | 1.0 | 1104 | $1,650 | $1.49 | 16d | 1 | 1.46mi |
| 2001 Juniper Pass Way Mesquite, TX | 3.0 | 2.5 | 1409 | $2,200 | $1.56 | 24d | 1 | 1.48mi |
| 1029 Kory Dr Mesquite, TX | 3.0 | 2.0 | 1463 | $1,950 | $1.33 | 43d | 1 | 1.48mi |
Listing history 6 events
-
2026-06-18days on market $149,000 Active 6 DOM
-
2026-06-17days on market $149,000 Active 5 DOM
-
2026-06-16days on market $149,000 Active 4 DOM
-
2026-06-15days on market $149,000 Active 3 DOM
-
2026-06-13remarks 699-char remark
-
2026-06-13$149,000 Active 1 DOM
ⓘ Source: listings_history table (triggers on properties + properties_extension) + one-shot
backfill from property_details.listing_events for pre-trigger history.
Tax reassessment forecast TX · Resets to sale price
- Current annual tax
- $4,278 · $357/mo
- Projected year-2 tax
- $4,278 · $357/mo
- Expected delta
- $0/yr ($0/mo · 0.0%)
ⓘ Screening estimate from a state-policy table — verify with the county assessor before closing.
Climate risk First Street
- Flood 1/10 Low FEMA zone X (unshaded) · 0% chance over 30 yrs
- Wildfire 1/10 Low
- Heat 8/10 Severe 7 d/yr ≥111°F today · 24 d/yr by 30 yrs out
- Wind 6/10 Major 27% chance of damaging wind over 30 yrs
- Air quality 2/10 Low 1 unhealthy d/yr today · 2 by 30 yrs out
Nearby sold comps map
Loading sold comps map…
Walkable amenities ~0.75 mi
Loading nearby amenities…
Taxation est. · year 1
- Rental income
- $20,857
- − Mortgage interest
- −$8,346
- − Property taxes
- −$4,278
- − Insurance
- −$745
- − Repairs & maintenance
- −$1,669
- − Management
- −$1,669
- − Depreciation
- −$4,335
- Taxable loss
- −$184
- Est. tax savings @ 24.0%
- +$44
- After-tax cash flow
- $2,122/yr
For passive investors: Depreciation is non-cash, so a rental often shows a tax loss while cash-flowing — sheltering income. Rental losses are passive: they offset passive income freely, and up to $25,000/yr can offset ordinary (W-2) income if you actively participate and your MAGI is under $100k (phasing out to $0 by $150k); unused losses carry forward. On sale, claimed depreciation is recaptured at up to 25%, and gains may owe capital-gains tax (a 1031 exchange can defer both). Figures are a year-1 estimate at your 24.0% rate — not tax advice; consult a CPA.
Schools (NCES district)
- District
- Mesquite ISD
- NCES district ID
- 4830390
- Math proficiency
- 35% ▼ -11.00%
- Reading proficiency
- 32% ▼ -7.00%
- Median HH income
- $49,372
- Composite
- 29.06/100
- National rank
- #6606
- State rank
- #536 of 826 in TX
Livability — Mesquite
- Score
- 70/100
- State rank
- #358
- US rank
- #7743
Category grades
Schools grade is shown separately in the Schools card above.
Census & demographics
- Census place
- Mesquite, TX
- County
- Dallas County · 2,612,404 people
- City population
- 150,788
- Metro
- Dallas-Fort Worth-Arlington, TX
- Population (ZIP)
- 58,262
- Household income
- $70,774
- Rent vs Own
- Severe rent burden
- 2266.0
Population outlook (Dallas County) Hauer SSP2
- Today (2025)
- 2,979,839 people
- By 2030
- 3,191,823 · +7.1%
- By 2040
- 3,619,611 · +21.5%
- By 2050
- 4,026,915 · +35.1%
- By 2075
- 4,957,073 · +66.4%
- By 2100
- 5,508,725 · +84.9%
Race, ethnicity, and origin ACS 2023
- Neighborhood character
- Diverse neighborhood (Simpson 0.65)
- Race & ethnicity
- Hispanic / Latino 49% White 25% Two or more races 21% Black 20% Asian 2% Native American 1%
- Hispanic origin (detail)
- Mexican 42% Cuban 1%
- Common ancestry
- Italian 1% Iranian 1% Serbian 1%
- Foreign-born
- 22% · Canada, Vietnam
- Languages at home
- 58% English-only · Spanish 39% Other Asian/Pacific 1% Vietnamese 1%
Political lean MEDSL · Dallas
- 2024 margin
- Strong D (+22.2) · D 60.2% · R 38.0% · Other 1.8%
- 2008→2024 swing
- +6.9pp toward D · 2008: 15.3pp · 2024: 22.2pp
- All cycles
- 2024: D+22.2 2020: D+31.6 2016: D+26.2 2012: D+15.4 2008: D+15.3
Not yet ingested
- Civics
- —
Market trends
- HPI YoY
- ▼ -130.12%
- Current HPI
- 345.6606
- Rent YoY
- ▲ 0.22%
- Metro
- Dallas-Fort Worth-Arlington, TX
- State GDP YoY
- ▲ 3.95%
- F500 in state
- 110
Industry mix (Fortune 500 HQ in TX)
| Industry | F500 HQs | Revenue |
|---|---|---|
| Energy | 16 | $1,198B |
|
||
| Technology | 5 | $198B |
|
||
| Engineering / Construction | 4 | $72B |
|
||
| Energy Services | 3 | $60B |
|
||
| Utilities | 3 | $41B |
|
||
| Healthcare | 2 | $330B |
|
||
Price history
2 events — show timeline
- 2026-06-08 Listed $149,000 NTREIS
- 1998-06-17 Sold (Public Records) — Public Records
Property tax history
+6.5%/yrLatest (2025): $4,278 · +1.1% YoY. Source: county tax records.
Cash-flow waterfall
monthlySold comps — $/sqft
last 12 mo · ≤1 miLoading sold comps…