250 Kinney Hill Rd · Newark, VT
Flood risk 1/10 · Minimal
- FEMA flood zone
- X
- Chance of flooding over 30 yrs
- 0.0%
- Est. flood insurance / yr
- $473 – $860
Fire risk 1/10 · Minimal
- Est. fire insurance / yr
- $480 – $892
Heat risk 1/10 · Minimal
- Hot days now (above 87°F)
- 5 days/yr
- Hot days in 30 yrs
- 12 days/yr
Wind risk 2/10 · Minimal
- Chance of severe wind over 30 yrs
- 2.0%
Air-quality risk 2/10 · Minimal
- Unhealthy air days now
- 1 days/yr
- Unhealthy air days in 30 yrs
- 1 days/yr
Risk factors via First Street. Map © Google.
Why this score? — see what drove the B grade
The composite is a weighted blend of 9 inputs, each scored 0–100. Each bar is that input's sub-score; the figure is the points it added to the 100-point composite (weight × sub-score).
- Cash flow +22.6/30.0
- ARV discount +15.0/15.0
- Appreciation +7.9/10.0
- DSCR +7.2/10.0
- 1% rule +5.7/10.0
- Schools +5.0/10.0
- Rent growth +2.5/5.0
- Livability +2.5/5.0
- Condition / age +2.5/5.0
$130,000
🖨 Deal sheet 📄 Offer letter ✓ Due diligence
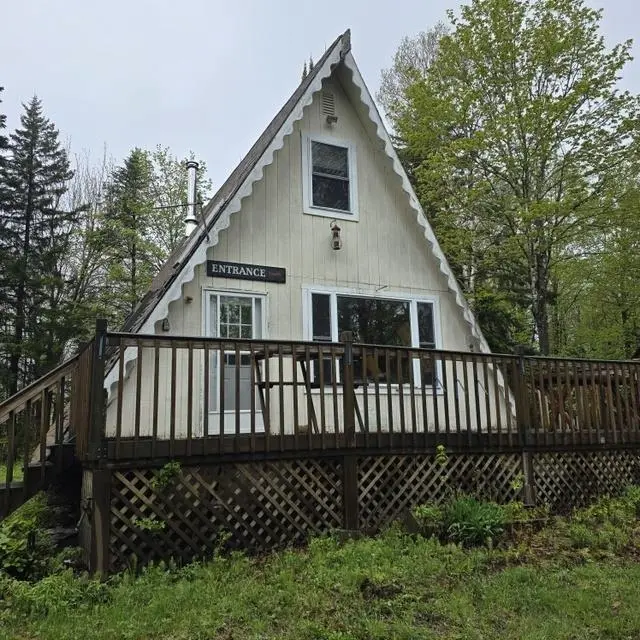
Listing remarks MLS
Remote Vacation or home property. Off-grid. 2 to 3 bedrooms. 3/4 bath. Nice front deck. Propane heater, wood stove. Generator, wired for solar lights. Woodshed, Bunkroom, Storage shed. Firepit.
Key facts
- Front deck
- Propane heater
- Wood stove
Tags
Neighborhood map
What this means for you Summary
Snapshot
- This is a 3-bed/1.0-bath single-family listed at $130k.
Deal economics
- At list price, monthly cash flow is $221 ($3k/yr) — positive.
- The deal already cash-flows at list — no discount required.
- Meets the 1% rule at list price ($1k rent vs $130k).
- Recommended offer: $114k (12.0% below list) — sets the bar for market timing.
Location & tenants
- Location reads: area grade B — affects rentability + tenant quality, not the cash-flow math above.
- Market conditions: 21 active listings in the ZIP; 112 units permitted in Caledonia County in 2024 (15 in 5+ unit buildings).
Forward outlook
- In year one you build about $8k of equity ($899 loan paydown + $8k appreciation (5.8% local appreciation)).
- Caledonia County population projected at -20% by 2050 — secular population decline; favor cash flow + early exit over multi-decade hold.
- At projected returns (5.8% appreciation + 3.0% rent growth), your $36k cash investment doubles in ~4 years — after that, you're playing with house money.
- By year 5, paydown + projected appreciation supports a ~$37k cash-out refi (75% LTV) — recoverable capital for the next deal without selling this one.
Negotiation context
- It's been on market 366 days — a 12% lower offer ($114k) is reasonable based on typical stale-listing flexibility.
- 2 sale attempts since 24y ago; this cycle's ask has dropped $15k (10%) from the opening price — seller is motivated, your offer sets the floor, not the list.
- Current owner paid $60k; list at $130k implies a 117% gain — meaningful room to come down on a strong offer.
Questions for the listing agent
- It's been on market 366 days. Have you received any prior offers? Is the seller open to a 12% concession, seller financing, or rate buy-down credit?
- Why hasn't it sold? Are there any deal-killer items the seller is aware of (foundation, flood, title, zoning, code violations)?
- Is there a deadline driving the sale (1031 exchange, divorce, estate, relocation)? That informs how much negotiation room exists.
- What's the average days-on-market for RENTAL listings here right now (not sales)? A rising rental-DOM trend means longer vacancies and softer asking-rent achievability than the comps imply.
- What's the recent tenant-quality profile in this submarket — average credit score on applications, eviction rate, late-payment / NSF rate, and stable-employment percentage? A property-management company in the area should have these aggregated.
- How much new for-sale + rental construction is in the pipeline within 1–3 miles? Heavy new supply typically softens prices + rents 12–24 months out; constrained supply supports both.
Investment metrics
- 1% rule
- 1.07% ✓
- Cap rate
- 8.33%
- Cash-on-cash
- 7.27%
- DSCR
- 1.32
- GRM
- 7.8
CMA / ARV
- ARV (median comp)
- $245,841
- List price
- $130,000
- Delta
- -47.12%
- Verdict
- UNDERPRICED
- Comps
- 2 within 1.0 mi
Projected returns pro-forma
5.84% appreciation · 3.0% rent growth · sell at horizon
- IRR
- 21.0%
- Equity multiple
- 2.38×
- Total profit
- $50,315
- Equity at exit
- $80,368
- IRR
- 20.2%
- Equity multiple
- 4.77×
- Total profit
- $137,371
- Equity at exit
- $144,589
Cash invested: $36,400 (down + closing). Projections, not guarantees.
Landlord ↔ Tenant lean methodology
- Overall (STATE)
- 41 Moderately Tenant-Leaning
- State Vermont
- 41 Moderately Tenant-Leaning · D+15
- County
- — inherits STATE
- City
- — inherits STATE
ZIP-level market 05871
- Home prices YoY
- 2.1%
- Active inventory
- 21
- Price-to-rent
- 7.8×
Monthly cashflow live
- Estimated rent
- $1,395 medium interval (Pro) →
- Mortgage (P&I)
- −$682
- Tax from tax record
- −$145 /mo · $1,744/yr
- Insurance
- −$54
- HOA
- −$0
- Vacancy / Maint / Mgmt
- −$293
- Net cashflow
- $221
Break-even live
UW: 25.0% down · 7.5% · 30yr · 1.5% tax · 5.0% vac · 8.0% maint · 8.0% mgmt
Financing live
Cash to close
- Down payment
- $32,500
- Closing costs
- $3,900
- Reserves months
- —
- Total cash needed
- —
Loan-product check · same deal, 3 products live
Conventional
25% down · 7.5% · 30yr
- Down + closing
- —
- Monthly P&I
- —
- Monthly cashflow
- —
- DSCR
- —
- Eligible?
- —
Personal DTI + credit; lowest rate.
DSCR
20% down · 8.5% · 30yr
- Down + closing
- —
- Monthly P&I
- —
- Monthly cashflow
- —
- DSCR
- —
- Eligible?
- —
No personal income docs; deal must DSCR.
Hard money
10% down · 12.0% · 12mo
- Down + closing
- —
- Monthly P&I
- —
- Monthly cashflow
- —
- DSCR
- —
- Eligible?
- —
Short-term bridge; refi at stabilization.
Listing history 18 events
-
2026-06-18days on market $130,000 Active 366 DOM
-
2026-06-17days on market $130,000 Active 365 DOM
-
2026-06-16days on market $130,000 Active 364 DOM
-
2026-06-15days on market $130,000 Active 363 DOM
-
2026-06-15days on market $130,000 Active 362 DOM
-
2026-06-13days on market $130,000 Active 361 DOM
-
2026-06-12pricedays on market $130,000 Active 360 DOM
-
2026-06-09days on market $145,000 Active 357 DOM
-
2026-06-08days on market $145,000 Active 356 DOM
-
2026-06-08days on market $145,000 Active 355 DOM
-
2026-06-07days on market $145,000 Active 354 DOM
-
2026-06-03days on market $145,000 Active 351 DOM
-
2026-06-02days on market $145,000 Active 350 DOM
-
2026-06-01days on market $145,000 Active 349 DOM
-
2026-05-31days on market $145,000 Active 348 DOM
-
2025-06-17$145,000 Active 193-char remark
Show marketing remark (193 chars)
Remote Vacation or home property. Off-grid. 2 to 3 bedrooms. 3/4 bath. Nice front deck. Propane heater, wood stove. Generator, wired for solar lights. Woodshed, Bunkroom, Storage shed. Firepit.
-
2003-07-31soldstatus $60,000 114-char remark
Show marketing remark (114 chars)
NICELY MAINTAINED YEAR ROUND VACATION OR HUNTING LODGE ON 10 REMOTE ACRES. . WOODSTOVE, NEW WINDOWS, KILLER VIEWS.
-
2002-10-10$67,000 114-char remark
Show marketing remark (114 chars)
NICELY MAINTAINED YEAR ROUND VACATION OR HUNTING LODGE ON 10 REMOTE ACRES. . WOODSTOVE, NEW WINDOWS, KILLER VIEWS.
ⓘ Source: listings_history table (triggers on properties + properties_extension) + one-shot
backfill from property_details.listing_events for pre-trigger history.
Tax reassessment forecast VT · Partial reset (capped growth)
- Current annual tax
- $1,744 · $145/mo
- Projected year-2 tax
- $2,107 · $176/mo
- Expected delta
- +$363/yr (+$30/mo · 20.8%)
ⓘ Screening estimate from a state-policy table — verify with the county assessor before closing.
Climate risk First Street
- Flood 1/10 Low FEMA zone X · 0% chance over 30 yrs
- Wildfire 1/10 Low
- Heat 1/10 Low 5 d/yr ≥87°F today · 12 d/yr by 30 yrs out
- Wind 2/10 Low 2% chance of damaging wind over 30 yrs
- Air quality 2/10 Low 1 unhealthy d/yr today · 1 by 30 yrs out
Nearby sold comps map
Loading sold comps map…
Walkable amenities ~0.75 mi
Loading nearby amenities…
Taxation est. · year 1
- Rental income
- $16,735
- − Mortgage interest
- −$7,282
- − Property taxes
- −$1,744
- − Insurance
- −$650
- − Repairs & maintenance
- −$1,339
- − Management
- −$1,339
- − Depreciation
- −$3,782
- Taxable income
- $600
- Est. tax owed @ 24.0%
- −$144
- After-tax cash flow
- $2,502/yr
For passive investors: Depreciation is non-cash, so a rental often shows a tax loss while cash-flowing — sheltering income. Rental losses are passive: they offset passive income freely, and up to $25,000/yr can offset ordinary (W-2) income if you actively participate and your MAGI is under $100k (phasing out to $0 by $150k); unused losses carry forward. On sale, claimed depreciation is recaptured at up to 25%, and gains may owe capital-gains tax (a 1031 exchange can defer both). Figures are a year-1 estimate at your 24.0% rate — not tax advice; consult a CPA.
Schools (NCES district)
No district data.
Livability — Newark
No livability data for this city. (Only ~50 U.S. cities are tracked.)
Census & demographics
- Population (ZIP)
- 1,369
Population outlook (Caledonia County) Hauer SSP2
- Today (2025)
- 29,828 people
- By 2030
- 28,820 · -3.4%
- By 2040
- 26,262 · -12.0%
- By 2050
- 23,780 · -20.3%
- By 2075
- 18,516 · -37.9%
- By 2100
- 13,647 · -54.2%
Race, ethnicity, and origin ACS 2023
- Neighborhood character
- Predominantly White (96%)
- Race & ethnicity
- White 96% Two or more races 1% Hispanic / Latino 1%
- Common ancestry
- Romanian 10% Lithuanian 6% German 3%
- Foreign-born
- 0%
- Languages at home
- 98% English-only · Spanish 1%
Political lean MEDSL · Caledonia
- 2024 margin
- D (+12.4) · D 54.5% · R 42.0% · Other 3.5%
- 2008→2024 swing
- -10.8pp toward R · 2008: 23.3pp · 2024: 12.4pp
- All cycles
- 2024: D+12.4 2020: D+15.2 2016: D+7.0 2012: D+22.9 2008: D+23.3
Not yet ingested
- Civics
- —
Market trends
- HPI YoY
- ▲ 5.84%
- Current HPI
- 286.7647
- Rent YoY
- —
- Metro
- —
- State GDP YoY
- —
- F500 in state
- 0
Price history
+116.4% since first listed3 events — show timeline
- 2025-06-17 Listed $145,000 PrimeMLS
- 2003-07-31 Sold (MLS) $60,000 PrimeMLS
- 2002-10-10 Listed $67,000 PrimeMLS
Property tax history
+0.1%/yrLatest (2024): $1,744 · +9.8% YoY. Source: county tax records.
Cash-flow waterfall
monthlySold comps — $/sqft
last 12 mo · ≤1 miLoading sold comps…