 🏷️ Likely Rental
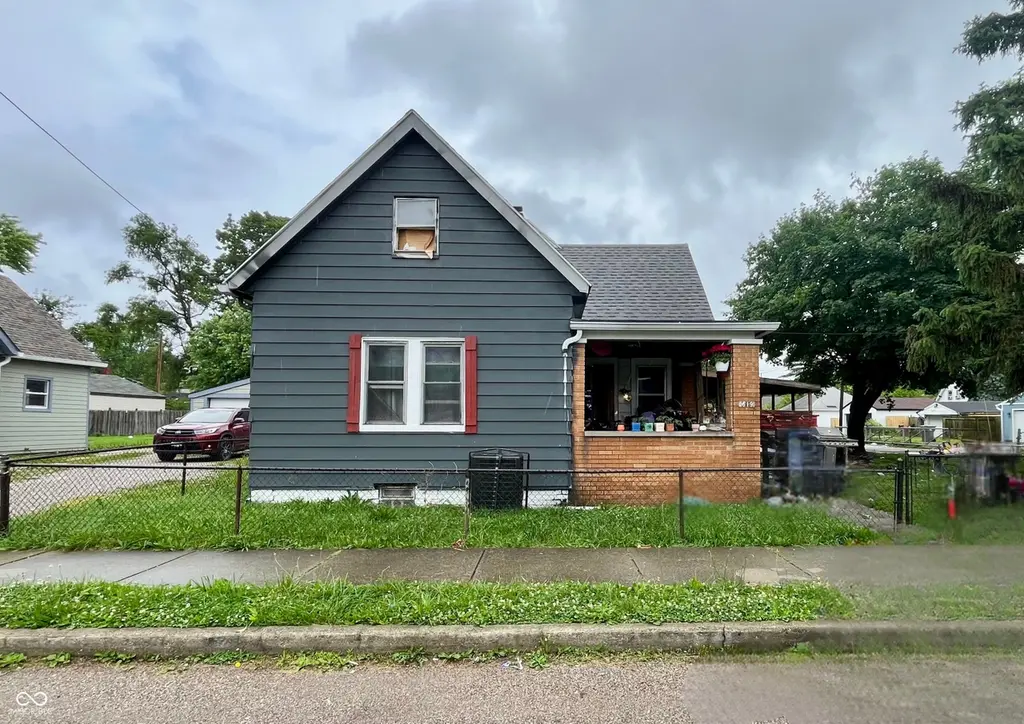
619 St Paul St · Indianapolis city (balance), IN
Flood risk 3/10 · Minor
- FEMA flood zone
- X (unshaded)
- Chance of flooding over 30 yrs
- 0.2%
- Est. flood insurance / yr
- $507 – $1,088
Fire risk 1/10 · Minimal
- Est. fire insurance / yr
- $717 – $1,331
Heat risk 4/10 · Minor
- Hot days now (above 101°F)
- 7 days/yr
- Hot days in 30 yrs
- 19 days/yr
Wind risk 2/10 · Minimal
- Chance of severe wind over 30 yrs
- 1.0%
Air-quality risk 4/10 · Minor
- Unhealthy air days now
- 5 days/yr
- Unhealthy air days in 30 yrs
- 7 days/yr
Risk factors via First Street. Map © Google.
Why this score? — see what drove the C+ grade
The composite is a weighted blend of 9 inputs, each scored 0–100. Each bar is that input's sub-score; the figure is the points it added to the 100-point composite (weight × sub-score).
- Cash flow +28.1/30.0
- DSCR +10.0/10.0
- 1% rule +8.2/10.0
- ARV discount +7.5/15.0
- Rent growth +3.2/5.0
- Livability +2.5/5.0
- Condition / age +2.5/5.0
- Schools +1.4/10.0
- Appreciation +0.0/10.0
$144,000
🖨 Deal sheet 📄 Offer letter ✓ Due diligence
Listing remarks MLS
Turn-Key Investment Opportunity! This income-generating property is currently producing $2,000/month in rental revenue! Whether you're a seasoned investor or just starting out, this is a low-maintenance, high-return asset perfect for building steady cash flow from day one.
Key facts
- Tenant occupied
- Fully fenced
- Interior layout
Tags
Neighborhood map
What this means for you Summary
Snapshot
- This is a 2-bed/2.0-bath single-family listed at $144k.
Deal economics
- At list price, monthly cash flow is $454 ($5k/yr) — positive.
- The deal already cash-flows at list — no discount required.
- Meets the 1% rule at list price ($2k rent vs $144k).
- Recommended offer: $127k (12.0% below list) — sets the bar for market timing.
- Cap rate 10.1% vs local median 4.4% in Indianapolis city (balance) — top-decile yield for the area; either an underpriced asset or a hidden risk that comps aren't pricing in. Stress-test before assuming the spread holds.
Location & tenants
- Location reads: area grade C — affects rentability + tenant quality, not the cash-flow math above.
- Indianapolis Public Schools (urban): math 14% / reading 20% proficiency, ranked #286 of 301 in IN (top 95%) — low school quality limits family demand, transient renter base, plan for 1-2y turnover; 77% free/reduced lunch — lower-income household profile, screen leases tightly.
- Market conditions: Rents rising (+2.9%/yr); 493 active listings in the ZIP; 40 comparable units currently listed for rent nearby; rentals at typical pace (median 24d on market — plan ~3-4 weeks tenant-placement turnaround); 1,906 units permitted in Marion County in 2024 (621 in 5+ unit buildings).
- This rent runs 40% of the median local income ($57k/yr) — at the standard rent-burdened threshold; future hikes will face affordability resistance.
Forward outlook
- Local home prices are declining (-3.0%/yr); year-one equity from $996 of loan paydown is wiped out by about $4k of value loss. Plan a longer hold.
- Marion County population projected at +18% by 2050 — long-run rental-demand tailwind backs the buy-and-hold thesis.
- At projected returns (-3.0% appreciation + 2.9% rent growth), your $40k cash investment doubles in ~9 years — after that, you're playing with house money.
Negotiation context
- It's been on market 320 days — a 12% lower offer ($127k) is reasonable based on typical stale-listing flexibility.
- 3 sale attempts since 3y ago; this cycle's ask has dropped $96k (40%) from the opening price — seller is motivated, your offer sets the floor, not the list.
- Current owner paid $120k; 20% above their basis — modest negotiation headroom, anchor on the comps not their cost.
Risks & watch-outs
- Watch-outs: built in 1920 — expect roof / HVAC / electrical / plumbing capex.
Questions for the listing agent
- It's been on market 320 days. Have you received any prior offers? Is the seller open to a 12% concession, seller financing, or rate buy-down credit?
- Built in 1920 — when were the roof, HVAC, electrical panel, plumbing, and water heater last replaced?
- Why hasn't it sold? Are there any deal-killer items the seller is aware of (foundation, flood, title, zoning, code violations)?
- Is there a deadline driving the sale (1031 exchange, divorce, estate, relocation)? That informs how much negotiation room exists.
- What's the average days-on-market for RENTAL listings here right now (not sales)? A rising rental-DOM trend means longer vacancies and softer asking-rent achievability than the comps imply.
- What's the recent tenant-quality profile in this submarket — average credit score on applications, eviction rate, late-payment / NSF rate, and stable-employment percentage? A property-management company in the area should have these aggregated.
- How much new for-sale + rental construction is in the pipeline within 1–3 miles? Heavy new supply typically softens prices + rents 12–24 months out; constrained supply supports both.
Investment metrics
- 1% rule
- 1.32% ✓
- Cap rate
- 10.08%
- Cash-on-cash
- 13.51%
- DSCR
- 1.60
- GRM
- 6.3
CMA / ARV
- ARV (median comp)
- $351,370
- List price
- $144,000
- Delta
- -59.02%
- Verdict
- UNDERPRICED
- Comps
- 20 within 1.0 mi
Show comp detail 12 sales within ~0.75 mi
| Address | Dist | Beds/Ba | Sqft | Sold | Price | $/sf | Match |
|---|---|---|---|---|---|---|---|
| 1824 S Woodlawn Ave | 0.38mi | 2/2.0 | 2,408 (+4%) | 0mo | $320,000 | $133 | 74 |
| 1903 Hoyt Ave | 0.27mi | 3/1.5 (+1) | 2,504 (+9%) | 3mo | $170,000 | $68 | 63 |
| 1652 Spann Ave | 0.40mi | 3/2.5 (+1) | 2,454 (+6%) | 1mo | $222,330 | $91 | 62 |
| 908 Dawson St | 0.40mi | 3/2.0 (+1) | 2,047 (-11%) | 2mo | $316,000 | $154 | 56 |
| 1038 Saint Peter St | 0.34mi | 3/3.5 (+1) | 2,100 (-9%) | 3mo | $385,000 | $183 | 56 |
| 1432 Lexington Ave | 0.62mi | 2/1.5 | 2,478 (+8%) | 2mo | $175,000 | $71 | 55 |
| 1317 Spann Ave | 0.71mi | 3/3.5 (+1) | 2,400 (+4%) | 2mo | $575,000 | $240 | 47 |
| 1627 Pleasant St | 0.48mi | 3/3.0 (+1) | 2,636 (+14%) | 1mo | $381,000 | $145 | 43 |
| 1429 Fletcher Ave | 0.61mi | 2/2.5 | 2,647 (+15%) | 2mo | $340,000 | $128 | 43 |
| 1502 Bates St | 0.61mi | 3/2.0 (+1) | 2,012 (-13%) | 2mo | $268,000 | $133 | 43 |
| 1431 Pleasant St | 0.65mi | 2/1.0 | 1,991 (-14%) | 2mo | $259,000 | $130 | 42 |
| 1406 Fletcher Ave | 0.65mi | 3/2.0 (+1) | 2,640 (+15%) | 2mo | $440,000 | $167 | 38 |
Match score weights: distance 35% · size 25% · config 20% · recency 20%. Top-matched comps best support the ARV.
Projected returns pro-forma
-3.0% appreciation · 2.88% rent growth · sell at horizon
- IRR
- 3.5%
- Equity multiple
- 1.13×
- Total profit
- $5,408
- Equity at exit
- $21,471
- IRR
- 12.9%
- Equity multiple
- 2.02×
- Total profit
- $41,252
- Equity at exit
- $12,450
Cash invested: $40,320 (down + closing). Projections, not guarantees.
Landlord ↔ Tenant lean methodology
- Overall (STATE)
- 90 Strongly Landlord-Friendly
- State Indiana
- 90 Strongly Landlord-Friendly · R+11
- County
- — inherits STATE
- City
- — inherits STATE
ZIP-level market 46203
- Home prices YoY
- -26.7%
- Rents YoY
- 2.9%
- Active inventory
- 493
- Price-to-rent
- 6.3×
Monthly cashflow live
- Estimated rent
- $1,906 high interval (Pro) →
- Mortgage (P&I)
- −$755
- Tax from tax record
- −$237 /mo · $2,841/yr
- Insurance
- −$60
- HOA
- −$0
- Vacancy / Maint / Mgmt
- −$400
- Net cashflow
- $454
Break-even live
UW: 25.0% down · 7.5% · 30yr · 1.5% tax · 5.0% vac · 8.0% maint · 8.0% mgmt
Financing live
Cash to close
- Down payment
- $36,000
- Closing costs
- $4,320
- Reserves months
- —
- Total cash needed
- —
Loan-product check · same deal, 3 products live
Conventional
25% down · 7.5% · 30yr
- Down + closing
- —
- Monthly P&I
- —
- Monthly cashflow
- —
- DSCR
- —
- Eligible?
- —
Personal DTI + credit; lowest rate.
DSCR
20% down · 8.5% · 30yr
- Down + closing
- —
- Monthly P&I
- —
- Monthly cashflow
- —
- DSCR
- —
- Eligible?
- —
No personal income docs; deal must DSCR.
Hard money
10% down · 12.0% · 12mo
- Down + closing
- —
- Monthly P&I
- —
- Monthly cashflow
- —
- DSCR
- —
- Eligible?
- —
Short-term bridge; refi at stabilization.
Rent comps 40 comps
| Address | Beds | Baths | Sqft | Rent | $/sqft | DOM | Units | Dist |
|---|---|---|---|---|---|---|---|---|
| 1643 Fletcher Ave Indianapolis, IN | 3.0 | 2.0 | 2019 | $2,249 | $1.11 | 23d | 1 | 0.43mi |
| 1613 Fletcher Ave Indianapolis, IN | 2.0 | 1.0 | 2208 | $2,149 | $0.97 | 23d | 1 | 0.47mi |
| 1230 Harlan St Indianapolis, IN | 3.0 | 3.5 | 2167 | $2,600 | $1.20 | 1d | 1 | 0.56mi |
| 1441 Prospect St Indianapolis, IN | 2.0 | 1.0–2.0 | 2840 | $2,000 | $0.70 | 1d | 13 | 0.73mi |
| 22 Hendricks Pl Unit 22 Indianapolis, IN | 3.0 | 1.5 | 1730 | $1,600 | $0.92 | 17d | 1 | 0.73mi |
| 117 S Arsenal Ave Indianapolis, IN | 3.0 | 2.0 | 2592 | $1,800 | $0.69 | 43d | 1 | 0.74mi |
| 22 Parkview Ave Indianapolis, IN | 3.0 | 1.5 | 1728 | $1,450 | $0.84 | 7d | 1 | 0.74mi |
| 17 N Randolph St Indianapolis, IN | 3.0 | 2.0 | 1822 | $2,075 | $1.14 | 4d | 1 | 0.75mi |
| 41 Keystone Ave Indianapolis, IN | 3.0 | 2.5 | 1600 | $2,500 | $1.56 | 43d | 1 | 0.78mi |
| 43 Keystone Ave Indianapolis, IN | 3.0 | 2.5 | 1600 | $2,291 | $1.43 | 16d | 1 | 0.79mi |
| 47 Keystone Ave Indianapolis, IN | 3.0 | 2.5 | 1600 | $2,500 | $1.56 | 43d | 1 | 0.79mi |
| 1619 S Randolph St Indianapolis, IN | 3.0 | 1.0 | 2016 | $1,195 | $0.59 | 23d | 1 | 0.87mi |
| 1330 Laurel St Indianapolis, IN | 3.0 | 2.0 | 1911 | $2,250 | $1.18 | 20d | 1 | 0.91mi |
| 238 Eastern Ave Indianapolis, IN | 3.0 | 2.0 | 1850 | $1,900 | $1.03 | 23d | 1 | 0.94mi |
| 303 N State Ave Indianapolis, IN | 3.0 | 1.0 | 1700 | $1,275 | $0.75 | 23d | 1 | 0.96mi |
| 49 S Lasalle St Unit 1540092P Indianapolis, IN | 3.0 | 2.0 | 1991 | $3,053 | $1.53 | 2d | 1 | 0.98mi |
| 1012 Hosbrook St Indianapolis, IN | 2.0 | 2.5 | 1728 | $2,400 | $1.39 | 23d | 1 | 1.00mi |
| 1430 E Ohio St Indianapolis, IN | 3.0 | 1.5 | 2174 | $1,745 | $0.80 | 43d | 1 | 1.01mi |
| 322 N Summit St Unit 4 Indianapolis, IN | 3.0 | 3.5 | 2546 | $3,100 | $1.22 | 7d | 1 | 1.03mi |
| 1641 Iowa St Indianapolis, IN | 3.0 | 3.0 | 1938 | $1,900 | $0.98 | 23d | 1 | 1.05mi |
| 409 N Temple Ave Indianapolis, IN | 3.0 | 2.0 | 2106 | $1,650 | $0.78 | 43d | 1 | 1.07mi |
| 420 Eastern Ave Indianapolis, IN | 3.0 | 1.0 | 1900 | $1,325 | $0.70 | 43d | 1 | 1.09mi |
| 1337 Barth Ave Unit NA Indianapolis, IN | 3.0 | 1.0 | 2468 | $1,700 | $0.69 | 4d | 1 | 1.13mi |
| 1337 Barth Ave Indianapolis, IN | 3.0 | 1.0 | 2468 | $1,700 | $0.69 | 16d | 1 | 1.13mi |
| 1337 Barth Ave Indianapolis, IN | 3.0 | 1.0 | 2468 | $1,700 | $0.69 | 10d | 1 | 1.13mi |
| 1337 Barth Ave Indianapolis, IN | 3.0 | 1.0 | 2468 | $1,700 | $0.69 | 7d | 1 | 1.13mi |
| 1531 Sturm Ave Indianapolis, IN | 3.0 | 2.0 | 1806 | $1,515 | $0.84 | 23d | 1 | 1.14mi |
| 1529 Sturm Ave Indianapolis, IN | 3.0 | 2.0 | 1806 | $1,515 | $0.84 | 23d | 1 | 1.14mi |
| 1301 Ringgold Ave Unit 1303750P Indianapolis, IN | 3.0 | 3.0 | 2884 | $6,514 | $2.26 | 43d | 1 | 1.14mi |
| 1223 E New York St Indianapolis, IN | 3.0 | 3.0 | 2154 | $2,300 | $1.07 | 3d | 1 | 1.15mi |
| 2822 E Michigan St Indianapolis, IN | 3.0 | 2.0 | 1918 | $1,999 | $1.04 | 21d | 1 | 1.21mi |
| 408 N Dearborn St Indianapolis, IN | 3.0 | 2.5 | 1740 | $1,750 | $1.01 | 43d | 1 | 1.22mi |
| 515 N Oxford St Indianapolis, IN | 2.0 | 1.5 | 1728 | $1,050 | $0.61 | 2d | 1 | 1.24mi |
| 1258 E Naomi St Indianapolis, IN | 3.0 | 2.0 | 1608 | $1,450 | $0.90 | 7d | 1 | 1.28mi |
| 1247 Wright St Indianapolis, IN | 3.0 | 1.5 | 1809 | $1,750 | $0.97 | 43d | 1 | 1.31mi |
| 441 N Highland Ave Unit 445 Indianapolis, IN | 2.0 | 2.5 | 1650 | $2,400 | $1.45 | 43d | 1 | 1.32mi |
| 441 N Highland Ave Indianapolis, IN | 2.0 | 2.0 | 1650 | $2,400 | $1.45 | 43d | 1 | 1.32mi |
| 635 Jefferson Ave Indianapolis, IN | 3.0 | 1.5 | 1744 | $1,700 | $0.97 | 43d | 1 | 1.35mi |
| 656 N Beville Ave Indianapolis, IN | 3.0 | 2.5 | 2121 | $3,500 | $1.65 | 23d | 1 | 1.36mi |
| 734 Parkway Ave Indianapolis, IN | 3.0 | 2.0 | 2110 | $2,299 | $1.09 | 23d | 1 | 1.38mi |
Listing history 29 events
-
2026-06-18days on market $144,000 Active 320 DOM
-
2026-06-17days on market $144,000 Active 319 DOM
-
2026-06-16days on market $144,000 Active 318 DOM
-
2026-06-15days on market $144,000 Active 317 DOM
-
2026-06-13days on market $144,000 Active 315 DOM
-
2026-06-13days on market $144,000 Active 314 DOM
-
2026-06-09days on market $144,000 Active 311 DOM
-
2026-06-08days on market $144,000 Active 310 DOM
-
2026-06-07days on market $144,000 Active 309 DOM
-
2026-06-03days on market $144,000 Active 305 DOM
-
2026-06-02days on market $144,000 Active 304 DOM
-
2026-06-01days on market $144,000 Active 303 DOM
-
2026-05-31days on market $144,000 Active 302 DOM
-
2026-05-04price $144,000 273-char remark
Show marketing remark (273 chars)
Turn-Key Investment Opportunity! This income-generating property is currently producing $2,000/month in rental revenue! Whether you're a seasoned investor or just starting out, this is a low-maintenance, high-return asset perfect for building steady cash flow from day one.
-
2026-04-08price $149,000 273-char remark
Show marketing remark (273 chars)
Turn-Key Investment Opportunity! This income-generating property is currently producing $2,000/month in rental revenue! Whether you're a seasoned investor or just starting out, this is a low-maintenance, high-return asset perfect for building steady cash flow from day one.
-
2026-03-02price $154,000 273-char remark
Show marketing remark (273 chars)
Turn-Key Investment Opportunity! This income-generating property is currently producing $2,000/month in rental revenue! Whether you're a seasoned investor or just starting out, this is a low-maintenance, high-return asset perfect for building steady cash flow from day one.
-
2026-02-27status Active 273-char remark
Show marketing remark (273 chars)
Turn-Key Investment Opportunity! This income-generating property is currently producing $2,000/month in rental revenue! Whether you're a seasoned investor or just starting out, this is a low-maintenance, high-return asset perfect for building steady cash flow from day one.
-
2026-02-02price $159,000 273-char remark
Show marketing remark (273 chars)
Turn-Key Investment Opportunity! This income-generating property is currently producing $2,000/month in rental revenue! Whether you're a seasoned investor or just starting out, this is a low-maintenance, high-return asset perfect for building steady cash flow from day one.
-
2026-01-05price $164,000 273-char remark
Show marketing remark (273 chars)
Turn-Key Investment Opportunity! This income-generating property is currently producing $2,000/month in rental revenue! Whether you're a seasoned investor or just starting out, this is a low-maintenance, high-return asset perfect for building steady cash flow from day one.
-
2025-11-17price $169,000 273-char remark
Show marketing remark (273 chars)
Turn-Key Investment Opportunity! This income-generating property is currently producing $2,000/month in rental revenue! Whether you're a seasoned investor or just starting out, this is a low-maintenance, high-return asset perfect for building steady cash flow from day one.
-
2025-10-15price $174,000 273-char remark
Show marketing remark (273 chars)
Turn-Key Investment Opportunity! This income-generating property is currently producing $2,000/month in rental revenue! Whether you're a seasoned investor or just starting out, this is a low-maintenance, high-return asset perfect for building steady cash flow from day one.
-
2025-09-12price $179,000 273-char remark
Show marketing remark (273 chars)
Turn-Key Investment Opportunity! This income-generating property is currently producing $2,000/month in rental revenue! Whether you're a seasoned investor or just starting out, this is a low-maintenance, high-return asset perfect for building steady cash flow from day one.
-
2025-08-11price $189,000 273-char remark
Show marketing remark (273 chars)
Turn-Key Investment Opportunity! This income-generating property is currently producing $2,000/month in rental revenue! Whether you're a seasoned investor or just starting out, this is a low-maintenance, high-return asset perfect for building steady cash flow from day one.
-
2025-07-29price $210,000 273-char remark
Show marketing remark (273 chars)
Turn-Key Investment Opportunity! This income-generating property is currently producing $2,000/month in rental revenue! Whether you're a seasoned investor or just starting out, this is a low-maintenance, high-return asset perfect for building steady cash flow from day one.
-
2025-07-22price $225,000 273-char remark
Show marketing remark (273 chars)
Turn-Key Investment Opportunity! This income-generating property is currently producing $2,000/month in rental revenue! Whether you're a seasoned investor or just starting out, this is a low-maintenance, high-return asset perfect for building steady cash flow from day one.
-
2025-07-14$240,000 Active 273-char remark
Show marketing remark (273 chars)
Turn-Key Investment Opportunity! This income-generating property is currently producing $2,000/month in rental revenue! Whether you're a seasoned investor or just starting out, this is a low-maintenance, high-return asset perfect for building steady cash flow from day one.
-
2023-03-27soldstatus $120,000 Closed 701-char remark
Show marketing remark (701 chars)
Holy smokes! 2300+ living square feet! You won't find a larger great room anywhere near this home! 26x22 approx. size (WOW) w/gas fireplace & built-ins. Tons of natural light & sconces for soft light in the evenings! Alternate living areas include a family room, 2 enclosed porches and a loft space! 2 spacious bedrooms on the main plus a full bath with double, separate sinks. Upstairs is bedroom #3, tons of closets and builts ins for storage - plus a HUGE bonus room! Some windows are newer vinyl, newer roof (2019), newer a/c unit, washer & dryer stay! Gas range/oven for those who like to cook! 2 car covered carport area with ADA ramp leading into home - nice feature if you need it!
-
2023-03-07status Pending 701-char remark
Show marketing remark (701 chars)
Holy smokes! 2300+ living square feet! You won't find a larger great room anywhere near this home! 26x22 approx. size (WOW) w/gas fireplace & built-ins. Tons of natural light & sconces for soft light in the evenings! Alternate living areas include a family room, 2 enclosed porches and a loft space! 2 spacious bedrooms on the main plus a full bath with double, separate sinks. Upstairs is bedroom #3, tons of closets and builts ins for storage - plus a HUGE bonus room! Some windows are newer vinyl, newer roof (2019), newer a/c unit, washer & dryer stay! Gas range/oven for those who like to cook! 2 car covered carport area with ADA ramp leading into home - nice feature if you need it!
-
2023-02-27$139,900 Active 701-char remark
Show marketing remark (701 chars)
Holy smokes! 2300+ living square feet! You won't find a larger great room anywhere near this home! 26x22 approx. size (WOW) w/gas fireplace & built-ins. Tons of natural light & sconces for soft light in the evenings! Alternate living areas include a family room, 2 enclosed porches and a loft space! 2 spacious bedrooms on the main plus a full bath with double, separate sinks. Upstairs is bedroom #3, tons of closets and builts ins for storage - plus a HUGE bonus room! Some windows are newer vinyl, newer roof (2019), newer a/c unit, washer & dryer stay! Gas range/oven for those who like to cook! 2 car covered carport area with ADA ramp leading into home - nice feature if you need it!
ⓘ Source: listings_history table (triggers on properties + properties_extension) + one-shot
backfill from property_details.listing_events for pre-trigger history.
Tax reassessment forecast IN · Partial reset (capped growth)
- Current annual tax
- $2,841 · $237/mo
- Projected year-2 tax
- $2,841 · $237/mo
- Expected delta
- $0/yr ($0/mo · 0.0%)
ⓘ Screening estimate from a state-policy table — verify with the county assessor before closing.
Climate risk First Street
- Flood 3/10 Moderate FEMA zone X (unshaded) · 20% chance over 30 yrs
- Wildfire 1/10 Low
- Heat 4/10 Moderate 7 d/yr ≥101°F today · 19 d/yr by 30 yrs out
- Wind 2/10 Low 100% chance of damaging wind over 30 yrs
- Air quality 4/10 Moderate 5 unhealthy d/yr today · 7 by 30 yrs out
Nearby sold comps map
Loading sold comps map…
Walkable amenities ~0.75 mi
Loading nearby amenities…
Taxation est. · year 1
- Rental income
- $22,873
- − Mortgage interest
- −$8,066
- − Property taxes
- −$2,841
- − Insurance
- −$720
- − Repairs & maintenance
- −$1,830
- − Management
- −$1,830
- − Depreciation
- −$4,189
- Taxable income
- $3,397
- Est. tax owed @ 24.0%
- −$815
- After-tax cash flow
- $4,631/yr
For passive investors: Depreciation is non-cash, so a rental often shows a tax loss while cash-flowing — sheltering income. Rental losses are passive: they offset passive income freely, and up to $25,000/yr can offset ordinary (W-2) income if you actively participate and your MAGI is under $100k (phasing out to $0 by $150k); unused losses carry forward. On sale, claimed depreciation is recaptured at up to 25%, and gains may owe capital-gains tax (a 1031 exchange can defer both). Figures are a year-1 estimate at your 24.0% rate — not tax advice; consult a CPA.
Schools (NCES district)
- District
- Indianapolis Public Schools
- NCES district ID
- 1804770
- Math proficiency
- 14% ▼ -7.00%
- Reading proficiency
- 20% ▼ -3.00%
- Median HH income
- $32,034
- Composite
- 13.69/100
- National rank
- #9499
- State rank
- #286 of 301 in IN
Livability — Indianapolis city (balance)
No livability data for this city. (Only ~50 U.S. cities are tracked.)
Census & demographics
- Census place
- Indianapolis city (balance), IN
- County
- Marion County · 998,460 people
- City population
- 881,119
- Metro
- Indianapolis-Carmel-Anderson, IN
- Population (ZIP)
- 37,758
- Household income
- $57,393
- Rent vs Own
- Severe rent burden
- 1499.0
Population outlook (Marion County) Hauer SSP2
- Today (2025)
- 1,025,572 people
- By 2030
- 1,065,727 · +3.9%
- By 2040
- 1,141,577 · +11.3%
- By 2050
- 1,208,920 · +17.9%
- By 2075
- 1,367,288 · +33.3%
- By 2100
- 1,438,201 · +40.2%
Race, ethnicity, and origin ACS 2023
- Neighborhood character
- Predominantly White (69%)
- Race & ethnicity
- White 69% Hispanic / Latino 14% Black 12% Two or more races 8% Asian 2% Native American 1%
- Hispanic origin (detail)
- Mexican 12% Puerto Rican 1%
- Common ancestry
- Slovak 2% Lithuanian 2% Italian 1%
- Foreign-born
- 8% · Canada
- Languages at home
- 88% English-only · Spanish 10% Other Indo-European 1%
Political lean MEDSL · Marion
- 2024 margin
- Strong D (+27.7) · D 63.0% · R 35.3% · Other 1.7%
- 2008→2024 swing
- -0.7pp no change · 2008: 28.4pp · 2024: 27.7pp
- All cycles
- 2024: D+27.7 2020: D+29.1 2016: D+22.8 2012: D+22.2 2008: D+28.4
Not yet ingested
- Civics
- —
Market trends
- HPI YoY
- ▼ -127.37%
- Current HPI
- 349.579
- Rent YoY
- ▲ 2.88%
- Metro
- Indianapolis-Carmel-Anderson, IN
- State GDP YoY
- ▲ 2.90%
- F500 in state
- 18
Industry mix (Fortune 500 HQ in IN)
| Industry | F500 HQs | Revenue |
|---|---|---|
| Industrial Machinery | 2 | $37B |
|
||
| Healthcare | 1 | $177B |
|
||
| Pharmaceuticals | 1 | $45B |
|
||
| Metals / Steel | 1 | $18B |
|
||
| Agriculture | 1 | $17B |
|
||
| Packaging | 1 | $12B |
|
||
Price history
+2.9% since first listed16 events — show timeline
- 2026-05-04 Price Changed $144,000 MIBOR as Distributed by MLS Grid
- 2026-04-08 Price Changed $149,000 MIBOR as Distributed by MLS Grid
- 2026-03-02 Price Changed $154,000 MIBOR as Distributed by MLS Grid
- 2026-02-27 Relisted — MIBOR as Distributed by MLS Grid
- 2026-02-02 Price Changed $159,000 MIBOR as Distributed by MLS Grid
- 2026-01-05 Price Changed $164,000 MIBOR as Distributed by MLS Grid
- 2025-11-17 Price Changed $169,000 MIBOR as Distributed by MLS Grid
- 2025-10-15 Price Changed $174,000 MIBOR as Distributed by MLS Grid
- 2025-09-12 Price Changed $179,000 MIBOR as Distributed by MLS Grid
- 2025-08-11 Price Changed $189,000 MIBOR as Distributed by MLS Grid
- 2025-07-29 Price Changed $210,000 MIBOR as Distributed by MLS Grid
- 2025-07-22 Price Changed $225,000 MIBOR as Distributed by MLS Grid
- 2025-07-14 Listed $240,000 MIBOR as Distributed by MLS Grid
- 2023-03-27 Sold (MLS) $120,000 MIBOR as Distributed by MLS Grid
- 2023-03-07 Pending — MIBOR as Distributed by MLS Grid
- 2023-02-27 Listed $139,900 MIBOR as Distributed by MLS Grid
Property tax history
+10.4%/yrLatest (2025): $2,841 · +13.2% YoY. Source: county tax records.
Cash-flow waterfall
monthlySold comps — $/sqft
last 12 mo · ≤1 miLoading sold comps…