 🏷️ Likely Rental
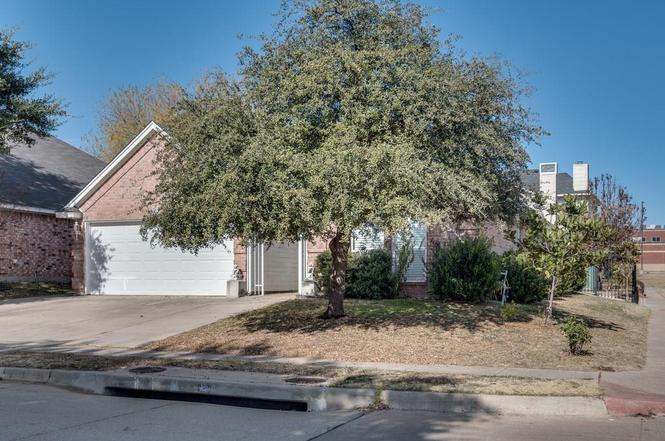
8841 San Joaquin Trl · Fort Worth, TX
Flood risk 6/10 · Moderate
- FEMA flood zone
- X (unshaded)
- Chance of flooding over 30 yrs
- 0.67%
- Est. flood insurance / yr
- $507 – $1,088
Fire risk 3/10 · Minor
- Est. fire insurance / yr
- $1,222 – $2,270
Heat risk 8/10 · Major
- Hot days now (above 110°F)
- 7 days/yr
- Hot days in 30 yrs
- 24 days/yr
Wind risk 6/10 · Moderate
- Chance of severe wind over 30 yrs
- 27.0%
Air-quality risk 3/10 · Minor
- Unhealthy air days now
- 2 days/yr
- Unhealthy air days in 30 yrs
- 3 days/yr
Risk factors via First Street. Map © Google.
Why this score? — see what drove the D+ grade
The composite is a weighted blend of 9 inputs, each scored 0–100. Each bar is that input's sub-score; the figure is the points it added to the 100-point composite (weight × sub-score).
- Cash flow +15.0/30.0
- ARV discount +7.5/15.0
- 1% rule +5.0/10.0
- DSCR +5.0/10.0
- Schools +4.2/10.0
- Livability +4.0/5.0
- Rent growth +2.8/5.0
- Condition / age +2.5/5.0
- Appreciation +0.0/10.0
$2,400
🖨 Deal sheet 📄 Offer letter ✓ Due diligence
Listing remarks MLS
Beautiful home in HEB school district and highly rated River Trails elementary school. The neighborhood is quiet and in a convenient location with sidewalks that will allow you to take a nice walk with your family. This 3 bed and 2 bath home is spacious with a large living room and expanded parking area on a corner lot. Roof replaced March 2017
Key facts
- Private backyard
- Corner lot
- Expanded driveway
Tags
Property features AI
Finance
- Other: Property is detached; Accessibility features not indicated
- Financial info: Listing treated as clear; no second mortgage information provided
- HOA & community: No homeowners association
Exterior
- Parking: 2-car garage with garage door opener (garage approx. 20 x 20)
- Security: No security features listed
- Utilities: City water; City sewer; Not in a municipal utility district
- Home design: Single-family residence; One story
- Construction: Built in 1997
- Exterior features: Lot less than 0.5 acre (about 0.132 acres); Subdivision: River Trails Add
Interior
- Kitchen: Electric range; Microwave; Refrigerator; Kitchen on level 1 (approx. 16 x 8)
- Bedrooms: Primary bedroom on level 1 with garden tub and separate shower (approx. 13 x 14)
- Flooring: No flooring details listed
- Bathrooms: 2 full bathrooms
- Heating & cooling: No heating or cooling details listed
- Interior features: Built-in features; One living area; One dining area; Total of 4 rooms
- Laundry & utility: No specific laundry details listed
Neighborhood map
What this means for you Summary
Snapshot
- This is a 3-bed/2.0-bath single-family listed at $2k.
Deal economics
- At list price, monthly cash flow is $2k ($20k/yr) — positive.
- The deal already cash-flows at list — no discount required.
- Meets the 1% rule at list price ($2k rent vs $2k).
- Cap rate 856.3% vs local median 3.9% in Fort Worth — top-decile yield for the area; either an underpriced asset or a hidden risk that comps aren't pricing in. Stress-test before assuming the spread holds.
Location & tenants
- Location reads 80/100 on livability (#49 in TX, #1,954 nationally) — a professional / high-income tenant draw. Strengths: amenities A+, cost of living A+, housing A+; Watch: crime F.
- Hurst-Euless-Bedford ISD (suburban): math 47% / reading 50% proficiency, ranked #193 of 826 in TX (top 23%) — families likely to look elsewhere, expect single-tenant / working-renter base with shorter leases.
- Zoned schools: River Trails El (math 54% / reading 56%, grade C, #602 of 4,322 statewide, top 14%, 638 students, 55% FRL).
- Market conditions: Rents rising (+1.3%/yr); 80 active listings in the ZIP; 25 comparable units currently listed for rent nearby; rentals at typical pace (median 24d on market — plan ~3-4 weeks tenant-placement turnaround); solid renter incomes; 18,938 units permitted in Tarrant County in 2024 (8,336 in 5+ unit buildings).
Forward outlook
- Local home prices are declining (-3.0%/yr); year-one equity from $17 of loan paydown is wiped out by about $72 of value loss. Plan a longer hold.
- Tarrant County population projected at +41% by 2050 — long-run rental-demand tailwind backs the buy-and-hold thesis.
- At projected returns (-3.0% appreciation + 1.3% rent growth), your $672 cash investment doubles in ~1 year — after that, you're playing with house money.
Negotiation context
- Only 1 days on market — expect competitive offers; lowballing is unlikely to land.
- 2 sale attempts since 9y ago with the ask held roughly flat each time — persistent listings suggest the price (not the market) is what's stuck; bring a comps-based counter.
Risks & watch-outs
- Climate carrying-cost: major flood risk; major wind risk, 27% chance of damaging wind over 30y; extreme-heat days projected 7→24/yr by 2055 (HVAC capex compounding) — expect insurance premiums to compound above CPI over the hold.
Questions for the listing agent
- Is there a deadline driving the sale (1031 exchange, divorce, estate, relocation)? That informs how much negotiation room exists.
- Schools are D-rated, which usually means shorter tenancies and higher turnover. Who's the typical renter profile here, and what's been the actual vacancy rate?
- Crime grade is F in this area — have there been break-ins, vandalism, or insurance claims at this property in the last 3 years? What carrier currently insures it and at what premium?
- The area grade is low — what's the realistic commute time and amenity access for the typical tenant pool here? Any planned neighborhood developments (good or bad) we should know about?
- What's the average days-on-market for RENTAL listings here right now (not sales)? A rising rental-DOM trend means longer vacancies and softer asking-rent achievability than the comps imply.
- What's the recent tenant-quality profile in this submarket — average credit score on applications, eviction rate, late-payment / NSF rate, and stable-employment percentage? A property-management company in the area should have these aggregated.
- How much new for-sale + rental construction is in the pipeline within 1–3 miles? Heavy new supply typically softens prices + rents 12–24 months out; constrained supply supports both.
Investment metrics
- 1% rule
- 90.53% ✓
- Cap rate
- 856.27%
- Cash-on-cash
- 3035.62%
- DSCR
- 136.07
- GRM
- 0.1
CMA / ARV
- ARV (on-the-fly)
- $350,672
- Comps found
- 12
Show comp detail 12 sales within ~0.75 mi
| Address | Dist | Beds/Ba | Sqft | Sold | Price | $/sf | Match |
|---|---|---|---|---|---|---|---|
| 8852 Tyne Trl | 0.05mi | 3/2.5 | 1,731 (-0%) | 3mo | $350,000 | $202 | 93 |
| 9041 Creede Trl | 0.21mi | 3/2.0 | 1,733 (-0%) | 4mo | $359,000 | $207 | 87 |
| 8704 Saranac Trl | 0.26mi | 3/2.0 | 1,758 (+1%) | 1mo | $334,900 | $191 | 85 |
| 8963 Winding River Dr | 0.30mi | 3/2.0 | 1,703 (-2%) | 4mo | $334,000 | $196 | 79 |
| 8729 Brushy Creek Trl | 0.28mi | 3/2.5 | 1,646 (-5%) | 3mo | $315,000 | $191 | 74 |
| 9111 Creede Trl | 0.39mi | 3/2.0 | 1,683 (-3%) | 5mo | $329,000 | $195 | 73 |
| 9129 River Trails Blvd | 0.48mi | 3/2.0 | 1,845 (+6%) | 2mo | $385,000 | $209 | 65 |
| 8729 Lake Meadows Ln | 0.55mi | 4/2.0 (+1) | 1,864 (+7%) | 2mo | $369,000 | $198 | 56 |
| 2856 Concho Trl | 0.41mi | 3/2.0 | 1,485 (-14%) | 2mo | $299,900 | $202 | 56 |
| 3224 Shoreside Pkwy | 0.68mi | 3/2.0 | 1,607 (-7%) | 1mo | $372,000 | $231 | 55 |
| 2633 Calloway Creek Dr | 0.59mi | 3/2.5 | 1,872 (+8%) | 5mo | $420,000 | $224 | 53 |
| 9025 Winding River Dr | 0.34mi | 4/2.5 (+1) | 1,958 (+13%) | 4mo | $355,000 | $181 | 52 |
Match score weights: distance 35% · size 25% · config 20% · recency 20%. Top-matched comps best support the ARV.
Projected returns pro-forma
-3.0% appreciation · 1.28% rent growth · sell at horizon
- IRR
- —
- Equity multiple
- 156.09×
- Total profit
- $104,217
- Equity at exit
- $358
- IRR
- —
- Equity multiple
- 321.90×
- Total profit
- $215,644
- Equity at exit
- $208
Cash invested: $672 (down + closing). Projections, not guarantees.
Landlord ↔ Tenant lean methodology
- Overall (STATE)
- 87 Strongly Landlord-Friendly
- State Texas
- 87 Strongly Landlord-Friendly · R+5
- County
- — inherits STATE
- City
- — inherits STATE
ZIP-level market 76118
- Home prices YoY
- -15.9%
- Rents YoY
- 1.3%
- Active inventory
- 80
- Price-to-rent
- 0.1×
Monthly cashflow live
- Estimated rent
- $2,173 high interval (Pro) →
- Mortgage (P&I)
- −$13
- Tax est. 1.5%
- −$3 /mo · $36/yr
- Insurance
- −$1
- HOA
- −$0
- Vacancy / Maint / Mgmt
- −$456
- Net cashflow
- $1,700
Break-even live
UW: 25.0% down · 7.5% · 30yr · 1.5% tax · 5.0% vac · 8.0% maint · 8.0% mgmt
Financing live
Cash to close
- Down payment
- $600
- Closing costs
- $72
- Reserves months
- —
- Total cash needed
- —
Loan-product check · same deal, 3 products live
Conventional
25% down · 7.5% · 30yr
- Down + closing
- —
- Monthly P&I
- —
- Monthly cashflow
- —
- DSCR
- —
- Eligible?
- —
Personal DTI + credit; lowest rate.
DSCR
20% down · 8.5% · 30yr
- Down + closing
- —
- Monthly P&I
- —
- Monthly cashflow
- —
- DSCR
- —
- Eligible?
- —
No personal income docs; deal must DSCR.
Hard money
10% down · 12.0% · 12mo
- Down + closing
- —
- Monthly P&I
- —
- Monthly cashflow
- —
- DSCR
- —
- Eligible?
- —
Short-term bridge; refi at stabilization.
Rent comps 25 comps
| Address | Beds | Baths | Sqft | Rent | $/sqft | DOM | Units | Dist |
|---|---|---|---|---|---|---|---|---|
| 9000 Elbe Trl Fort Worth, TX | 4.0 | 2.0 | 1693 | $2,350 | $1.39 | 18d | 1 | 0.18mi |
| 2529 Rivers Edge Dr Fort Worth, TX | 3.0 | 2.0 | 1467 | $2,181 | $1.49 | 5d | 1 | 0.24mi |
| 8728 Elbe Trl Fort Worth, TX | 3.0 | 2.0 | 1407 | $2,125 | $1.51 | 24d | 1 | 0.25mi |
| 8728 Elbe Trl Fort Worth, TX | 3.0 | 2.0 | 1407 | $2,075 | $1.47 | 4d | 1 | 0.25mi |
| 9008 Winding River Dr Fort Worth, TX | 3.0 | 2.0 | 1522 | $2,300 | $1.51 | 43d | 1 | 0.33mi |
| 9008 Winding River Dr Fort Worth, TX | 3.0 | 2.0 | 1522 | $2,300 | $1.51 | 24d | 1 | 0.33mi |
| 9091 San Joaquin Trl Fort Worth, TX | 3.0 | 2.0 | 1697 | $2,250 | $1.33 | 24d | 1 | 0.35mi |
| 9032 Winding River Dr Fort Worth, TX | 4.0 | 2.0 | 1871 | $2,350 | $1.26 | 43d | 1 | 0.36mi |
| 9089 Brushy Creek Trl Fort Worth, TX | 3.0 | 2.0 | 1452 | $2,200 | $1.52 | 43d | 1 | 0.37mi |
| 2612 Trent Trl Fort Worth, TX | 3.0 | 2.0 | 1754 | $2,300 | $1.31 | 43d | 1 | 0.51mi |
| 8336 Trinity Vista Trl Hurst, TX | 3.0 | 2.5 | 1790 | $2,550 | $1.42 | 3d | 1 | 0.90mi |
| 806 Treadwell Ct Unit B Hurst, TX | 2.0 | 2.5 | 1056 | $1,399 | $1.32 | 43d | 1 | 1.06mi |
| 813 Betty Ct Unit B Hurst, TX | 3.0 | 2.0 | 1473 | $1,950 | $1.32 | 20d | 1 | 1.08mi |
| 8260 Edgepoint Trl Hurst, TX | 3.0 | 2.0 | 2066 | $2,570 | $1.24 | 43d | 1 | 1.09mi |
| 140 Flyaway Ln Fort Worth, TX | 3.0 | 2.0 | 1308 | $1,985 | $1.52 | 24d | 1 | 1.10mi |
| 819 Betty Ct Unit B Hurst, TX | 2.0 | 2.0 | 1065 | $1,400 | $1.31 | 5d | 1 | 1.11mi |
| 9500 Trinity Blvd Fort Worth, TX | 1.0–2.0 | 1.0–2.0 | 1090 | $2,245 | $2.06 | 1d | 18 | 1.14mi |
| 804 Cullum Ct Unit 804 Cullum "D" Hurst, TX | 2.0 | 2.0 | 1196 | $1,395 | $1.17 | 43d | 1 | 1.18mi |
| 109 Flyaway Ln Fort Worth, TX | 4.0 | 2.0 | 1859 | $2,100 | $1.13 | 24d | 1 | 1.19mi |
| 304 Moore Creek Rd Unit 300 Hurst, TX | 3.0 | 2.0 | 1347 | $2,300 | $1.71 | 24d | 1 | 1.19mi |
| 136 Arthur Dr Hurst, TX | 4.0 | 2.0 | 1383 | $2,045 | $1.48 | 3d | 1 | 1.19mi |
| 125 Souder Dr Hurst, TX | 3.0 | 2.0 | 1493 | $2,700 | $1.81 | 24d | 1 | 1.23mi |
| 329 Bearman Dr Unit 329BD Fort Worth, TX | 3.0 | 2.0 | 1552 | $2,365 | $1.52 | 3d | 1 | 1.32mi |
| 7500 Pleasant Oaks Dr Fort Worth, TX | 3.0 | 2.0 | 1598 | $2,251 | $1.41 | 24d | 1 | 1.43mi |
| 421 Arthur Dr Hurst, TX | 3.0 | 1.5 | 1182 | $1,600 | $1.35 | 43d | 1 | 1.44mi |
Listing history 2 events
-
2026-06-15remarks 699-char remark
-
2026-06-15$2,400 Active 1 DOM
ⓘ Source: listings_history table (triggers on properties + properties_extension) + one-shot
backfill from property_details.listing_events for pre-trigger history.
Climate risk First Street
- Flood 6/10 Major FEMA zone X (unshaded) · 67% chance over 30 yrs
- Wildfire 3/10 Moderate
- Heat 8/10 Severe 7 d/yr ≥110°F today · 24 d/yr by 30 yrs out
- Wind 6/10 Major 27% chance of damaging wind over 30 yrs
- Air quality 3/10 Moderate 2 unhealthy d/yr today · 3 by 30 yrs out
Nearby sold comps map
Loading sold comps map…
Walkable amenities ~0.75 mi
Loading nearby amenities…
Taxation est. · year 1
- Rental income
- $26,074
- − Mortgage interest
- −$134
- − Property taxes
- −$36
- − Insurance
- −$12
- − Repairs & maintenance
- −$2,086
- − Management
- −$2,086
- − Depreciation
- −$70
- Taxable income
- $21,650
- Est. tax owed @ 24.0%
- −$5,196
- After-tax cash flow
- $15,203/yr
For passive investors: Depreciation is non-cash, so a rental often shows a tax loss while cash-flowing — sheltering income. Rental losses are passive: they offset passive income freely, and up to $25,000/yr can offset ordinary (W-2) income if you actively participate and your MAGI is under $100k (phasing out to $0 by $150k); unused losses carry forward. On sale, claimed depreciation is recaptured at up to 25%, and gains may owe capital-gains tax (a 1031 exchange can defer both). Figures are a year-1 estimate at your 24.0% rate — not tax advice; consult a CPA.
Schools (NCES district)
- District
- Hurst-Euless-Bedford ISD
- NCES district ID
- 4824060
- Math proficiency
- 47% ▼ -15.00%
- Reading proficiency
- 50% ▼ -5.00%
- Median HH income
- $56,086
- Composite
- 42.12/100
- National rank
- #3316
- State rank
- #193 of 826 in TX
Livability — Fort Worth
- Score
- 80/100
- State rank
- #49
- US rank
- #1954
Category grades
Schools grade is shown separately in the Schools card above.
Census & demographics
- Census place
- Fort Worth, TX
- County
- Tarrant County · 2,033,669 people
- City population
- 911,619
- Metro
- Dallas-Fort Worth-Arlington, TX
- Population (ZIP)
- 17,991
- Household income
- $94,530
- Rent vs Own
- Severe rent burden
- 405.0
Population outlook (Tarrant County) Hauer SSP2
- Today (2025)
- 2,380,417 people
- By 2030
- 2,578,900 · +8.3%
- By 2040
- 2,974,995 · +25.0%
- By 2050
- 3,350,489 · +40.8%
- By 2075
- 4,216,909 · +77.2%
- By 2100
- 4,741,527 · +99.2%
Race, ethnicity, and origin ACS 2023
- Neighborhood character
- Diverse neighborhood (Simpson 0.62)
- Race & ethnicity
- White 58% Hispanic / Latino 18% Black 10% Asian 8% Two or more races 6% Pacific Islander 1% Native American 1%
- Hispanic origin (detail)
- Mexican 12% Puerto Rican 4%
- Common ancestry
- Slovak 2% Lithuanian 2% Italian 1%
- Foreign-born
- 13% · Canada, Vietnam
- Languages at home
- 80% English-only · Spanish 10% Other Indo-European 5% Vietnamese 2%
Political lean MEDSL · Tarrant
- 2024 margin
- Lean R (+5.1) · D 46.7% · R 51.9% · Other 1.4%
- 2008→2024 swing
- +6.6pp toward D · 2008: -11.7pp · 2024: -5.1pp
- All cycles
- 2024: R+5.1 2020: D+0.2 2016: R+8.7 2012: R+15.7 2008: R+11.7
Not yet ingested
- Civics
- —
Market trends
- HPI YoY
- ▼ -58.64%
- Current HPI
- 310.0546
- Rent YoY
- ▲ 1.28%
- Metro
- Dallas-Fort Worth-Arlington, TX
- State GDP YoY
- ▲ 3.95%
- F500 in state
- 110
Industry mix (Fortune 500 HQ in TX)
| Industry | F500 HQs | Revenue |
|---|---|---|
| Energy | 16 | $1,198B |
|
||
| Technology | 5 | $198B |
|
||
| Engineering / Construction | 4 | $72B |
|
||
| Energy Services | 3 | $60B |
|
||
| Utilities | 3 | $41B |
|
||
| Healthcare | 2 | $330B |
|
||
Price history
-99.0% since first listed11 events — show timeline
- 2026-06-14 Listed $2,400 NTREIS
- 2024-06-05 Sold (Public Records) — Public Records
- 2018-04-17 Sold (Public Records) — Public Records
- 2018-04-13 Sold (MLS) — NTREIS
- 2018-04-12 Pending — NTREIS
- 2018-03-13 Contingent — NTREIS
- 2018-02-01 Price Changed $229,999 NTREIS
- 2018-01-21 Price Changed $235,000 NTREIS
- 2017-12-13 Listed $249,000 NTREIS
- 2011-10-17 Sold (Public Records) — Public Records
- 1998-03-11 Sold (Public Records) — Public Records
Property tax history
+4.7%/yrLatest (2025): $7,114 · -2.4% YoY. Source: county tax records.
Cash-flow waterfall
monthlySold comps — $/sqft
last 12 mo · ≤1 miLoading sold comps…