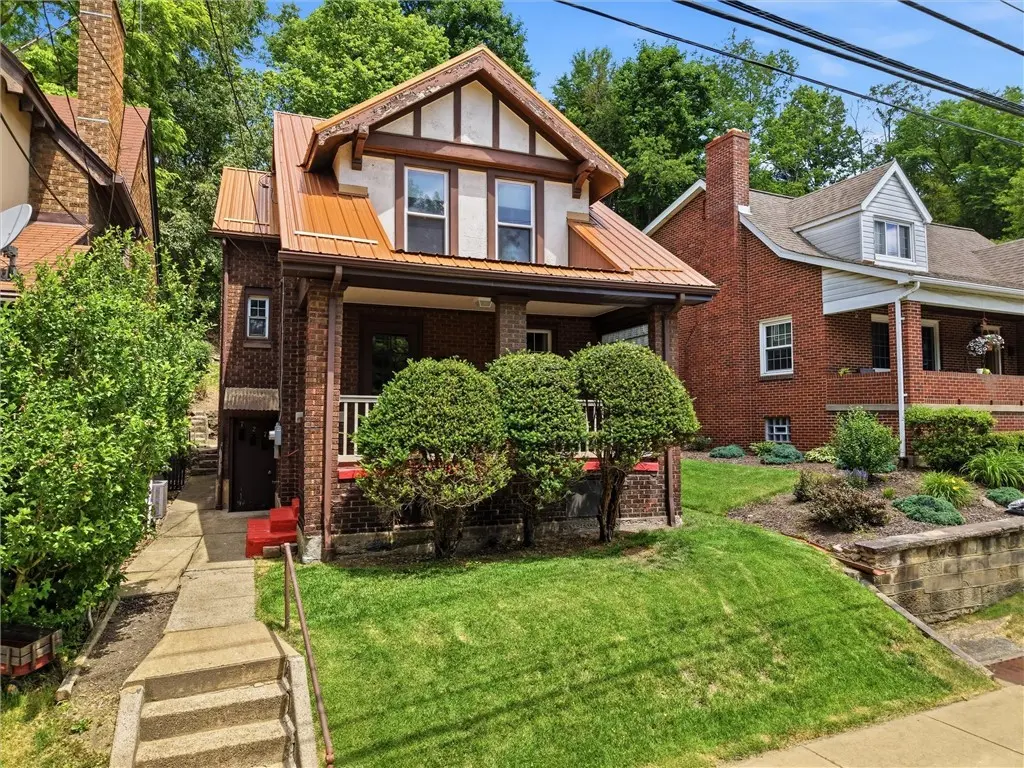
727 High St · Freeport, PA
Flood risk 1/10 · Minimal
- FEMA flood zone
- X (unshaded)
- Chance of flooding over 30 yrs
- 0.0%
- Est. flood insurance / yr
- $507 – $1,088
Fire risk 1/10 · Minimal
- Est. fire insurance / yr
- $511 – $949
Heat risk 4/10 · Minor
- Hot days now (above 97°F)
- 8 days/yr
- Hot days in 30 yrs
- 19 days/yr
Wind risk 2/10 · Minimal
- Chance of severe wind over 30 yrs
- —
Air-quality risk 3/10 · Minor
- Unhealthy air days now
- 3 days/yr
- Unhealthy air days in 30 yrs
- 4 days/yr
Risk factors via First Street. Map © Google.
Why this score? — see what drove the B grade
The composite is a weighted blend of 9 inputs, each scored 0–100. Each bar is that input's sub-score; the figure is the points it added to the 100-point composite (weight × sub-score).
- Cash flow +21.3/30.0
- ARV discount +15.0/15.0
- Appreciation +9.7/10.0
- DSCR +6.8/10.0
- 1% rule +6.2/10.0
- Schools +5.2/10.0
- Livability +3.2/5.0
- Rent growth +2.5/5.0
- Condition / age +2.5/5.0
$100,000
🖨 Deal sheet 📄 Offer letter ✓ Due diligence
Listing remarks
Some houses are move-in ready. Others are memory-making ready. This 3-bedroom, 2-bath bungalow is for the buyer who walks through the door and immediately starts dreaming. Dreaming about bringing the original hardwood floors back to life. Dreaming about choosing the perfect paint colors. Dreaming about restoring a home that has spent generations collecting stories and is ready for a few more. The character here is undeniable: gorgeous original woodwork, beamed ceilings, French doors, paneled doors, and fabulous turn-of-the-century light fixtures that simply can't be replicated. (And the old back staircase to the kitchen * Mwah!!) The kitchen could use a refresh, the plaster and paint need
Key facts
- Beamed ceilings
- French doors
- Paneled doors
Tags
Property features AI
Exterior
- Parking: On-street parking (2 total parking spaces noted)
- Utilities: Public water; Public sewer
- Home design: Two-story home; Resale property; Metal roof
- Construction: Brick and stucco construction; Home warranty included
- Exterior features: Small lot (approximately 0.1 acre)
Interior
- Kitchen: Main-level kitchen (10 x 17)
- Bedrooms: Upper-level bedrooms (two listed at 11 x 10; one additional upper room 16 x 12); Basement bonus room (17 x 8)
- Flooring: Hardwood; Vinyl
- Bathrooms: Two full bathrooms
- Heating & cooling: Forced air heating (gas); Central air conditioning
- Interior features: Decorative living room fireplace; Has basement with walk-up access and utility area; Hardwood and vinyl flooring
- Laundry & utility: Basement laundry area (21 x 25); Washer and dryer included
Neighborhood map
What this means for you Summary
Snapshot
- This is a 3-bed/1.0-bath single-family listed at $100k.
Deal economics
- At list price, monthly cash flow is $147 ($2k/yr) — positive.
- The deal already cash-flows at list — no discount required.
- Meets the 1% rule at list price ($1k rent vs $100k).
Location & tenants
- Location reads 65/100 on livability (#1,133 in PA) — a middle-class / working-renter tenant base. Strengths: crime A+, cost of living A+, housing A+; Watch: amenities F, commute F, employment F.
- Freeport Area SD (rural): math 48% / reading 70% proficiency, ranked #74 of 539 in PA (top 14%) — acceptable for families but not a draw, mixed tenant base, ~2y average lease; only 20% free/reduced lunch — higher-income household profile.
- Market conditions: 12 active listings in the ZIP; 58 units permitted in Armstrong County in 2024 (20 in 5+ unit buildings).
Forward outlook
- In year one you build about $10k of equity ($691 loan paydown + $9k appreciation (9.4% local appreciation)).
- Armstrong County population projected at -27% by 2050 — secular population decline; favor cash flow + early exit over multi-decade hold.
- At projected returns (9.4% appreciation + 3.0% rent growth), your $28k cash investment doubles in ~3 years — after that, you're playing with house money.
- By year 4, paydown + projected appreciation supports a ~$36k cash-out refi (75% LTV) — recoverable capital for the next deal without selling this one.
Negotiation context
- Only 7 days on market — expect competitive offers; lowballing is unlikely to land.
Risks & watch-outs
- Watch-outs: built in 1900 — expect roof / HVAC / electrical / plumbing capex.
Questions for the listing agent
- Built in 1900 — when were the roof, HVAC, electrical panel, plumbing, and water heater last replaced?
- Is there a deadline driving the sale (1031 exchange, divorce, estate, relocation)? That informs how much negotiation room exists.
- Schools are B-rated — typically a magnet for longer-tenancy family renters. What's the average tenant stay here, and is there a school-zone premium baked into asking?
- What's the average days-on-market for RENTAL listings here right now (not sales)? A rising rental-DOM trend means longer vacancies and softer asking-rent achievability than the comps imply.
- What's the recent tenant-quality profile in this submarket — average credit score on applications, eviction rate, late-payment / NSF rate, and stable-employment percentage? A property-management company in the area should have these aggregated.
- How much new for-sale + rental construction is in the pipeline within 1–3 miles? Heavy new supply typically softens prices + rents 12–24 months out; constrained supply supports both.
Investment metrics
- 1% rule
- 1.12% ✓
- Cap rate
- 8.05%
- Cash-on-cash
- 6.29%
- DSCR
- 1.28
- GRM
- 7.5
CMA / ARV
- ARV (on-the-fly)
- $137,747
- Comps found
- 5
Show comp detail 5 sales within ~0.75 mi
| Address | Dist | Beds/Ba | Sqft | Sold | Price | $/sf | Match |
|---|---|---|---|---|---|---|---|
| 125 Washington St | 0.21mi | 3/1.5 | 1,298 (+6%) | 1mo | $145,000 | $112 | 77 |
| 139 Stewart St | 0.39mi | 3/1.5 | 1,216 (-0%) | 21mo | $138,000 | $113 | 62 |
| 127 Washington St | 0.21mi | 3/1.0 | 1,120 (-8%) | 22mo | $148,000 | $132 | 59 |
| 133 Old Pike Rd | 0.65mi | 3/1.5 | 1,159 (-5%) | 5mo | $147,000 | $127 | 56 |
| 521 High St | 0.22mi | 2/2.0 (-1) | 1,377 (+13%) | 6mo | $137,500 | $100 | 54 |
Match score weights: distance 35% · size 25% · config 20% · recency 20%. Top-matched comps best support the ARV.
Projected returns pro-forma
9.44% appreciation · 3.0% rent growth · sell at horizon
- IRR
- 27.8%
- Equity multiple
- 3.14×
- Total profit
- $60,033
- Equity at exit
- $86,023
- IRR
- 24.4%
- Equity multiple
- 7.02×
- Total profit
- $168,624
- Equity at exit
- $181,349
Cash invested: $28,000 (down + closing). Projections, not guarantees.
Landlord ↔ Tenant lean methodology
- Overall (STATE)
- 62 Landlord-Friendly
- State Pennsylvania
- 62 Landlord-Friendly · EVEN
- County
- — inherits STATE
- City
- — inherits STATE
ZIP-level market 16229
- Home prices YoY
- 3.6%
- Active inventory
- 12
- Price-to-rent
- 7.5×
Monthly cashflow live
- Estimated rent
- $1,117 medium interval (Pro) →
- Mortgage (P&I)
- −$524
- Tax from tax record
- −$170 /mo · $2,037/yr
- Insurance
- −$42
- HOA
- −$0
- Vacancy / Maint / Mgmt
- −$235
- Net cashflow
- $147
Break-even live
UW: 25.0% down · 7.5% · 30yr · 1.5% tax · 5.0% vac · 8.0% maint · 8.0% mgmt
Financing live
Cash to close
- Down payment
- $25,000
- Closing costs
- $3,000
- Reserves months
- —
- Total cash needed
- —
Loan-product check · same deal, 3 products live
Conventional
25% down · 7.5% · 30yr
- Down + closing
- —
- Monthly P&I
- —
- Monthly cashflow
- —
- DSCR
- —
- Eligible?
- —
Personal DTI + credit; lowest rate.
DSCR
20% down · 8.5% · 30yr
- Down + closing
- —
- Monthly P&I
- —
- Monthly cashflow
- —
- DSCR
- —
- Eligible?
- —
No personal income docs; deal must DSCR.
Hard money
10% down · 12.0% · 12mo
- Down + closing
- —
- Monthly P&I
- —
- Monthly cashflow
- —
- DSCR
- —
- Eligible?
- —
Short-term bridge; refi at stabilization.
Listing history 7 events
-
2026-06-18days on market $100,000 Active 7 DOM
-
2026-06-17days on market $100,000 Active 6 DOM
-
2026-06-16days on market $100,000 Active 5 DOM
-
2026-06-15days on market $100,000 Active 4 DOM
-
2026-06-13days on market $100,000 Active 2 DOM
-
2026-06-12remarks 699-char remark
-
2026-06-12$100,000 Active 1 DOM
ⓘ Source: listings_history table (triggers on properties + properties_extension) + one-shot
backfill from property_details.listing_events for pre-trigger history.
Tax reassessment forecast PA · Partial reset (capped growth)
- Current annual tax
- $2,037 · $170/mo
- Projected year-2 tax
- $2,037 · $170/mo
- Expected delta
- $0/yr ($0/mo · 0.0%)
ⓘ Screening estimate from a state-policy table — verify with the county assessor before closing.
Climate risk First Street
- Flood 1/10 Low FEMA zone X (unshaded) · 0% chance over 30 yrs
- Wildfire 1/10 Low
- Heat 4/10 Moderate 8 d/yr ≥97°F today · 19 d/yr by 30 yrs out
- Wind 2/10 Low
- Air quality 3/10 Moderate 3 unhealthy d/yr today · 4 by 30 yrs out
Nearby sold comps map
Loading sold comps map…
Walkable amenities ~0.75 mi
Loading nearby amenities…
Taxation est. · year 1
- Rental income
- $13,406
- − Mortgage interest
- −$5,602
- − Property taxes
- −$2,037
- − Insurance
- −$500
- − Repairs & maintenance
- −$1,072
- − Management
- −$1,072
- − Depreciation
- −$2,909
- Taxable income
- $214
- Est. tax owed @ 24.0%
- −$51
- After-tax cash flow
- $1,710/yr
For passive investors: Depreciation is non-cash, so a rental often shows a tax loss while cash-flowing — sheltering income. Rental losses are passive: they offset passive income freely, and up to $25,000/yr can offset ordinary (W-2) income if you actively participate and your MAGI is under $100k (phasing out to $0 by $150k); unused losses carry forward. On sale, claimed depreciation is recaptured at up to 25%, and gains may owe capital-gains tax (a 1031 exchange can defer both). Figures are a year-1 estimate at your 24.0% rate — not tax advice; consult a CPA.
Schools (NCES district)
- District
- Freeport Area SD
- NCES district ID
- 4210440
- Math proficiency
- 48% ▼ -15.00%
- Reading proficiency
- 70% ▼ -10.00%
- Median HH income
- $64,311
- Composite
- 51.53/100
- National rank
- #1716
- State rank
- #74 of 539 in PA
Livability — Freeport
- Score
- 65/100
- State rank
- #1133
- US rank
- #13004
Category grades
Schools grade is shown separately in the Schools card above.
Census & demographics
- Census place
- Freeport, PA
- Population (ZIP)
- 4,900
Population outlook (Armstrong County) Hauer SSP2
- Today (2025)
- 62,513 people
- By 2030
- 59,579 · -4.7%
- By 2040
- 52,890 · -15.4%
- By 2050
- 45,904 · -26.6%
- By 2075
- 32,023 · -48.8%
- By 2100
- 20,415 · -67.3%
Race, ethnicity, and origin ACS 2023
- Neighborhood character
- Predominantly White (95%)
- Race & ethnicity
- White 95% Two or more races 3% Asian 1%
- Common ancestry
- Romanian 11% Slovak 3% Italian 3%
- Foreign-born
- 1%
- Languages at home
- 98% English-only · Spanish 1% German/W. Germanic 1%
Political lean MEDSL · Armstrong
- 2024 margin
- Solid R (+53.2) · D 23.0% · R 76.2%
- 2008→2024 swing
- -28.6pp toward R · 2008: -24.6pp · 2024: -53.2pp
- All cycles
- 2024: R+53.2 2020: R+52.3 2016: R+52.0 2012: R+37.2 2008: R+24.6
Not yet ingested
- Civics
- —
Market trends
- HPI YoY
- ▲ 9.44%
- Current HPI
- 269.016
- Rent YoY
- —
- Metro
- —
- State GDP YoY
- ▲ 1.68%
- F500 in state
- 34
Industry mix (Fortune 500 HQ in PA)
| Industry | F500 HQs | Revenue |
|---|---|---|
| Healthcare | 2 | $309B |
|
||
| Insurance | 2 | $27B |
|
||
| Telecommunications / Media | 1 | $124B |
|
||
| Industrial Distribution | 1 | $22B |
|
||
| Financial Services | 1 | $20B |
|
||
| Chemicals / Materials | 1 | $18B |
|
||
Price history
1 event — show timeline
- 2026-06-11 Listed $100,000 West Penn MLS
Property tax history
+1.6%/yrLatest (2026): $2,037 · +3.2% YoY. Source: county tax records.
Cash-flow waterfall
monthlySold comps — $/sqft
last 12 mo · ≤1 miLoading sold comps…