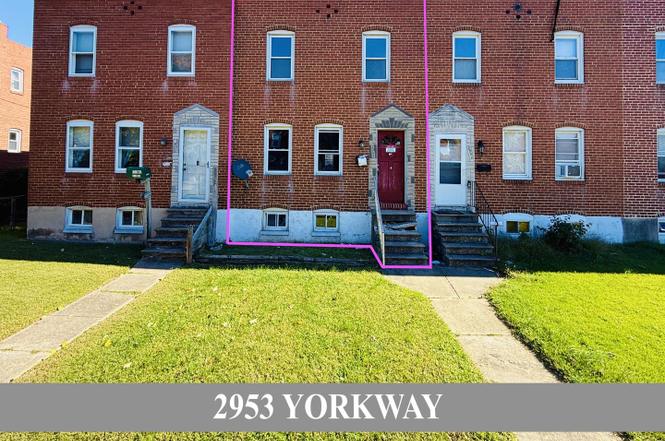
2953 Yorkway · Dundalk, MD
Flood risk 1/10 · Minimal
- FEMA flood zone
- X (unshaded)
- Chance of flooding over 30 yrs
- 0.0%
- Est. flood insurance / yr
- $473 – $860
Fire risk 1/10 · Minimal
- Est. fire insurance / yr
- $755 – $1,403
Heat risk 8/10 · Major
- Hot days now (above 103°F)
- 7 days/yr
- Hot days in 30 yrs
- 15 days/yr
Wind risk 6/10 · Moderate
- Chance of severe wind over 30 yrs
- 59.0%
Air-quality risk 5/10 · Moderate
- Unhealthy air days now
- 6 days/yr
- Unhealthy air days in 30 yrs
- 8 days/yr
Risk factors via First Street. Map © Google.
Why this score? — see what drove the B+ grade
The composite is a weighted blend of 9 inputs, each scored 0–100. Each bar is that input's sub-score; the figure is the points it added to the 100-point composite (weight × sub-score).
- Cash flow +30.0/30.0
- ARV discount +15.0/15.0
- DSCR +10.0/10.0
- 1% rule +9.9/10.0
- Livability +4.2/5.0
- Rent growth +2.5/5.0
- Condition / age +2.5/5.0
- Schools +2.3/10.0
- Appreciation +0.0/10.0
$150,000
🖨 Deal sheet 📄 Offer letter ✓ Due diligence
Listing remarks
Investor alert — 2953 Yorkway offers a prime opportunity to complete a renovation project in progress. The property has been gutted, and rough mechanicals appear to be in place, providing a strong head start toward completion. No permits have been obtained for the current work, and the buyer will be responsible for securing all necessary permits, inspections, and occupancy approvals prior to moving in or leasing. Located in a well-established neighborhood near schools, parks, and commuter routes, this property is ideal for experienced investors or contractors seeking a project with solid potential and existing progress already underway. Sold strictly * * as-is * * .
Key facts
- Near schools
- Near parks
- Near commuter routes
Tags
Neighborhood map
What this means for you Summary
Snapshot
- This is a 4-bed/2.0-bath townhouse listed at $150k.
Deal economics
- At list price, monthly cash flow is $743 ($9k/yr) — positive.
- The deal already cash-flows at list — no discount required.
- Meets the 1% rule at list price ($2k rent vs $150k).
- Recommended offer: $141k (6.0% below list) — sets the bar for market timing.
- Cap rate 12.2% vs local median 6.2% in Dundalk — top-decile yield for the area; either an underpriced asset or a hidden risk that comps aren't pricing in. Stress-test before assuming the spread holds.
Location & tenants
- Location reads 85/100 on livability (#16 in MD, #510 nationally) — a professional / high-income tenant draw. Strengths: amenities A+, commute A+, housing A+; Watch: crime F.
- Baltimore County Public Schools (suburban): math 15% / reading 34% proficiency, ranked #11 of 24 in MD (top 46%) — low school quality limits family demand, transient renter base, plan for 1-2y turnover.
- Market conditions: Rents soft (-0.1%/yr); 236 active listings in the ZIP; 24 comparable units currently listed for rent nearby; rentals lingering (median 44d on market — plan ~5-8 weeks vacancy on turnover, expect pricing pressure); 50% of comp listings sitting > 30 days — soft ceiling on asking rent; 1,511 units permitted in Baltimore County in 2024 (643 in 5+ unit buildings).
- This rent runs 42% of the median local income ($64k/yr) — at the standard rent-burdened threshold; future hikes will face affordability resistance.
Forward outlook
- Local home prices are declining (-3.0%/yr); year-one equity from $1k of loan paydown is wiped out by about $4k of value loss. Plan a longer hold.
- Baltimore County population projected at +12% by 2050 — modest demand growth; plan on rents tracking national, not racing it.
- At projected returns (-3.0% appreciation + 0.0% rent growth), your $42k cash investment doubles in ~8 years — after that, you're playing with house money.
Negotiation context
- It's been on market 87 days — a 6% lower offer ($141k) is reasonable based on typical stale-listing flexibility.
- Current owner paid $65k; list at $150k implies a 131% gain — meaningful room to come down on a strong offer.
Risks & watch-outs
- Watch-outs: built in 1944 — expect roof / HVAC / electrical / plumbing capex.
- Climate carrying-cost: major wind risk, 59% chance of damaging wind over 30y; extreme-heat days projected 7→15/yr by 2055 (HVAC capex compounding) — expect insurance premiums to compound above CPI over the hold.
Questions for the listing agent
- It's been on market 87 days. Have you received any prior offers? Is the seller open to a 6% concession, seller financing, or rate buy-down credit?
- Built in 1944 — when were the roof, HVAC, electrical panel, plumbing, and water heater last replaced?
- Why hasn't it sold? Are there any deal-killer items the seller is aware of (foundation, flood, title, zoning, code violations)?
- Is there a deadline driving the sale (1031 exchange, divorce, estate, relocation)? That informs how much negotiation room exists.
- Schools are A-rated — typically a magnet for longer-tenancy family renters. What's the average tenant stay here, and is there a school-zone premium baked into asking?
- Crime grade is F in this area — have there been break-ins, vandalism, or insurance claims at this property in the last 3 years? What carrier currently insures it and at what premium?
- What's the average days-on-market for RENTAL listings here right now (not sales)? A rising rental-DOM trend means longer vacancies and softer asking-rent achievability than the comps imply.
- What's the recent tenant-quality profile in this submarket — average credit score on applications, eviction rate, late-payment / NSF rate, and stable-employment percentage? A property-management company in the area should have these aggregated.
- How much new for-sale + rental construction is in the pipeline within 1–3 miles? Heavy new supply typically softens prices + rents 12–24 months out; constrained supply supports both.
Investment metrics
- 1% rule
- 1.49% ✓
- Cap rate
- 12.24%
- Cash-on-cash
- 21.23%
- DSCR
- 1.94
- GRM
- 5.6
CMA / ARV
- ARV (on-the-fly)
- $247,271
- Comps found
- 12
Show comp detail 12 sales within ~0.75 mi
| Address | Dist | Beds/Ba | Sqft | Sold | Price | $/sf | Match |
|---|---|---|---|---|---|---|---|
| 78 N Dundalk | 0.52mi | 4/2.0 | 1,545 (+2%) | 3mo | $245,000 | $159 | 70 |
| 6843 Dunbar Rd | 0.43mi | 3/2.0 (-1) | 1,575 (+4%) | 2mo | $225,000 | $143 | 67 |
| 7014 Belclare Rd | 0.41mi | 3/2.0 (-1) | 1,430 (-6%) | 1mo | $224,900 | $157 | 65 |
| 1953 Wareham Rd | 0.51mi | 3/2.0 (-1) | 1,512 (-0%) | 6mo | $232,000 | $153 | 65 |
| 100 Shipway | 0.33mi | 3/1.5 (-1) | 1,418 (-6%) | 2mo | $240,000 | $169 | 65 |
| 1922 Ormand Rd | 0.58mi | 3/2.0 (-1) | 1,512 (-0%) | 7mo | $250,000 | $165 | 61 |
| 3415 Dunran Rd | 0.50mi | 3/1.5 (-1) | 1,408 (-7%) | 1mo | $230,000 | $163 | 57 |
| 3482 Dunhaven Rd | 0.59mi | 3/2.0 (-1) | 1,408 (-7%) | 3mo | $235,000 | $167 | 53 |
| 2493 Fairway | 0.70mi | 3/2.0 (-1) | 1,590 (+5%) | 6mo | $221,000 | $139 | 50 |
| 6757 Woodley Rd | 0.60mi | 3/1.0 (-1) | 1,648 (+9%) | 3mo | $177,500 | $108 | 46 |
| 2302 Searles Rd | 0.70mi | 3/1.5 (-1) | 1,382 (-9%) | 11mo | $227,000 | $164 | 36 |
| 2735 Moorgate Rd | 0.63mi | 3/1.5 (-1) | 1,294 (-15%) | 7mo | $230,000 | $178 | 33 |
Match score weights: distance 35% · size 25% · config 20% · recency 20%. Top-matched comps best support the ARV.
Projected returns pro-forma
-3.0% appreciation · 0.0% rent growth · sell at horizon
- IRR
- 10.3%
- Equity multiple
- 1.39×
- Total profit
- $16,500
- Equity at exit
- $22,365
- IRR
- 16.8%
- Equity multiple
- 2.19×
- Total profit
- $50,127
- Equity at exit
- $12,969
Cash invested: $42,000 (down + closing). Projections, not guarantees.
Landlord ↔ Tenant lean methodology
- Overall (STATE)
- 27 Tenant-Leaning
- State Maryland
- 27 Tenant-Leaning · D+14
- County
- — inherits STATE
- City
- — inherits STATE
ZIP-level market 21222
- Rents YoY
- -0.1%
- Active inventory
- 236
- Price-to-rent
- 5.6×
Monthly cashflow live
- Estimated rent
- $2,231 high interval (Pro) →
- Mortgage (P&I)
- −$787
- Tax from tax record
- −$171 /mo · $2,047/yr
- Insurance
- −$62
- HOA
- −$0
- Vacancy / Maint / Mgmt
- −$469
- Net cashflow
- $743
Break-even live
UW: 25.0% down · 7.5% · 30yr · 1.5% tax · 5.0% vac · 8.0% maint · 8.0% mgmt
Financing live
Cash to close
- Down payment
- $37,500
- Closing costs
- $4,500
- Reserves months
- —
- Total cash needed
- —
Loan-product check · same deal, 3 products live
Conventional
25% down · 7.5% · 30yr
- Down + closing
- —
- Monthly P&I
- —
- Monthly cashflow
- —
- DSCR
- —
- Eligible?
- —
Personal DTI + credit; lowest rate.
DSCR
20% down · 8.5% · 30yr
- Down + closing
- —
- Monthly P&I
- —
- Monthly cashflow
- —
- DSCR
- —
- Eligible?
- —
No personal income docs; deal must DSCR.
Hard money
10% down · 12.0% · 12mo
- Down + closing
- —
- Monthly P&I
- —
- Monthly cashflow
- —
- DSCR
- —
- Eligible?
- —
Short-term bridge; refi at stabilization.
Rent comps 24 comps
| Address | Beds | Baths | Sqft | Rent | $/sqft | DOM | Units | Dist |
|---|---|---|---|---|---|---|---|---|
| 2959 Liberty Pkwy Dundalk, MD | 3.0 | 2.0 | 1479 | $2,150 | $1.45 | 43d | 1 | 0.10mi |
| 2624 Liberty Pkwy Dundalk, MD | 3.0 | 1.5 | 1110 | $1,856 | $1.67 | 43d | 1 | 0.39mi |
| 12 Leeway Dundalk, MD | 3.0 | 1.0 | 1358 | $1,750 | $1.29 | 43d | 1 | 0.46mi |
| 3231 Dundalk Ave Dundalk, MD | 3.0 | 2.0 | 1630 | $2,000 | $1.23 | 5d | 1 | 0.51mi |
| 78 N Dundalk Ave Dundalk, MD | 4.0 | 2.0 | 1545 | $2,200 | $1.42 | 24d | 1 | 0.51mi |
| 3413 Yardley Dr Dundalk, MD | 4.0 | 2.0 | 1185 | $2,400 | $2.03 | 43d | 1 | 0.56mi |
| 1915 Merritt Blvd Dundalk, MD | 3.0 | 2.0 | 1208 | $2,500 | $2.07 | 43d | 1 | 0.56mi |
| 7109 Foundry St Dundalk, MD | 4.0 | 4.5 | 2080 | $3,200 | $1.54 | 43d | 1 | 0.66mi |
| 266 Saint Helena Ave Dundalk, MD | 3.0 | 1.0 | 1305 | $1,900 | $1.46 | 12d | 1 | 0.84mi |
| 1917 Searles Rd Dundalk, MD | 3.0 | 1.5 | 1955 | $1,679 | $0.86 | 43d | 1 | 0.86mi |
| 6537 Baltimore Ave Baltimore, MD | 3.0 | 1.0 | 1272 | $1,700 | $1.34 | 2d | 1 | 0.88mi |
| 8453 Stansbury Lake Dr Dundalk, MD | 3.0 | 2.5 | 2076 | $3,500 | $1.69 | 43d | 1 | 1.07mi |
| 123 Walnut Ave Dundalk, MD | 4.0 | 2.0 | 1513 | $2,100 | $1.39 | 2d | 1 | 1.08mi |
| 2020 Dineen Dr Dundalk, MD | 3.0 | 1.5 | 1258 | $1,850 | $1.47 | 5d | 1 | 1.12mi |
| 8220 Cornwall Rd Dundalk, MD | 3.0 | 2.0 | 1125 | $1,775 | $1.58 | 43d | 1 | 1.13mi |
| 217 Center St Dundalk, MD | 3.0 | 1.5 | 1280 | $1,575 | $1.23 | 5d | 1 | 1.14mi |
| 105 Williams Ave Dundalk, MD | 5.0 | 2.0 | 2035 | $2,950 | $1.45 | 5d | 1 | 1.18mi |
| 1964 Frames Rd Dundalk, MD | 3.0 | 2.0 | 1528 | $2,400 | $1.57 | 43d | 1 | 1.23mi |
| 8252 Longpoint Rd Dundalk, MD | 4.0 | 2.0 | 1216 | $1,950 | $1.60 | 3d | 1 | 1.24mi |
| 8252 Longpoint Rd Dundalk, MD | 4.0 | 2.0 | 1216 | $2,050 | $1.69 | 16d | 1 | 1.24mi |
| 511 Avondale Rd Dundalk, MD | 2.0–4.0 | 1.0–2.0 | 1146 | $2,250 | $1.96 | 1d | 69 | 1.26mi |
| 1930 Frames Rd Dundalk, MD | 3.0 | 2.0 | 1152 | $2,099 | $1.82 | 5d | 1 | 1.28mi |
| 1760 Langport Ave Dundalk, MD | 3.0 | 1.5 | 1600 | $1,795 | $1.12 | 43d | 1 | 1.42mi |
| 1533 Leslie Rd Dundalk, MD | 4.0 | 1.0 | 1270 | $2,000 | $1.57 | 43d | 1 | 1.46mi |
Listing history 5 events
-
2026-02-07status Pending
-
2026-01-16historical Active Under Contract
-
2025-12-19price $150,000
-
2025-10-21$169,900 Active
-
2021-11-23soldstatus $65,000
ⓘ Source: listings_history table (triggers on properties + properties_extension) + one-shot
backfill from property_details.listing_events for pre-trigger history.
Tax reassessment forecast MD · Partial reset (capped growth)
- Current annual tax
- $2,047 · $171/mo
- Projected year-2 tax
- $2,047 · $171/mo
- Expected delta
- $0/yr ($0/mo · 0.0%)
ⓘ Screening estimate from a state-policy table — verify with the county assessor before closing.
Climate risk First Street
- Flood 1/10 Low FEMA zone X (unshaded) · 0% chance over 30 yrs
- Wildfire 1/10 Low
- Heat 8/10 Severe 7 d/yr ≥103°F today · 15 d/yr by 30 yrs out
- Wind 6/10 Major 59% chance of damaging wind over 30 yrs
- Air quality 5/10 Major 6 unhealthy d/yr today · 8 by 30 yrs out
Nearby sold comps map
Loading sold comps map…
Walkable amenities ~0.75 mi
Loading nearby amenities…
Taxation est. · year 1
- Rental income
- $26,775
- − Mortgage interest
- −$8,402
- − Property taxes
- −$2,047
- − Insurance
- −$750
- − Repairs & maintenance
- −$2,142
- − Management
- −$2,142
- − Depreciation
- −$4,364
- Taxable income
- $6,928
- Est. tax owed @ 24.0%
- −$1,663
- After-tax cash flow
- $7,253/yr
For passive investors: Depreciation is non-cash, so a rental often shows a tax loss while cash-flowing — sheltering income. Rental losses are passive: they offset passive income freely, and up to $25,000/yr can offset ordinary (W-2) income if you actively participate and your MAGI is under $100k (phasing out to $0 by $150k); unused losses carry forward. On sale, claimed depreciation is recaptured at up to 25%, and gains may owe capital-gains tax (a 1031 exchange can defer both). Figures are a year-1 estimate at your 24.0% rate — not tax advice; consult a CPA.
Schools (NCES district)
- District
- Baltimore County Public Schools
- NCES district ID
- 2400120
- Math proficiency
- 15% ▼ -16.00%
- Reading proficiency
- 34% ▼ -5.00%
- Median HH income
- $66,746
- Composite
- 23.17/100
- National rank
- #7948
- State rank
- #11 of 24 in MD
Livability — Dundalk
- Score
- 85/100
- State rank
- #16
- US rank
- #510
Category grades
Schools grade is shown separately in the Schools card above.
Census & demographics
- Census place
- Dundalk, MD
- County
- Baltimore County · 769,527 people
- City population
- 59,407
- Metro
- Baltimore-Columbia-Towson, MD
- Population (ZIP)
- 59,407
- Household income
- $64,141
- Rent vs Own
- Severe rent burden
- 2566.0
Population outlook (Baltimore County) Hauer SSP2
- Today (2025)
- 885,518 people
- By 2030
- 909,272 · +2.7%
- By 2040
- 951,547 · +7.5%
- By 2050
- 990,955 · +11.9%
- By 2075
- 1,086,411 · +22.7%
- By 2100
- 1,135,078 · +28.2%
Race, ethnicity, and origin ACS 2023
- Neighborhood character
- Diverse neighborhood (Simpson 0.60)
- Race & ethnicity
- White 59% Black 18% Hispanic / Latino 15% Two or more races 7% Asian 2% Native American 1%
- Hispanic origin (detail)
- Mexican 3% Puerto Rican 2%
- Common ancestry
- Romanian 7% Lithuanian 1% Italian 1%
- Foreign-born
- 9% · Canada
- Languages at home
- 85% English-only · Spanish 11% Other Indo-European 2% Arabic 1%
Political lean MEDSL · Baltimore
- 2024 margin
- Strong D (+24.5) · D 61.0% · R 36.5% · Other 2.5%
- 2008→2024 swing
- +9.9pp toward D · 2008: 14.6pp · 2024: 24.5pp
- All cycles
- 2024: D+24.5 2020: D+27.0 2016: D+17.4 2012: D+16.4 2008: D+14.6
Not yet ingested
- Civics
- —
Market trends
- HPI YoY
- ▼ -251.44%
- Current HPI
- 228.4218
- Rent YoY
- ▼ -0.09%
- Metro
- Baltimore-Columbia-Towson, MD
- State GDP YoY
- ▲ 2.97%
- F500 in state
- 12
Industry mix (Fortune 500 HQ in MD)
| Industry | F500 HQs | Revenue |
|---|---|---|
| Aerospace / Defense | 1 | $71B |
|
||
| Utilities | 1 | $25B |
|
||
| Hotels | 1 | $24B |
|
||
| Consumer Goods | 1 | $7B |
|
||
| Real Estate | 1 | $6B |
|
||
| Chemicals | 1 | $2B |
|
||
Price history
+130.8% since first listed5 events — show timeline
- 2026-02-07 Pending — BRIGHT MLS
- 2026-01-16 Contingent — BRIGHT MLS
- 2025-12-19 Price Changed $150,000 BRIGHT MLS
- 2025-10-21 Listed $169,900 BRIGHT MLS
- 2021-11-23 Sold (Public Records) $65,000 Public Records
Property tax history
+1.4%/yrLatest (2025): $2,047 · +6.8% YoY. Source: county tax records.
Cash-flow waterfall
monthlySold comps — $/sqft
last 12 mo · ≤1 miLoading sold comps…