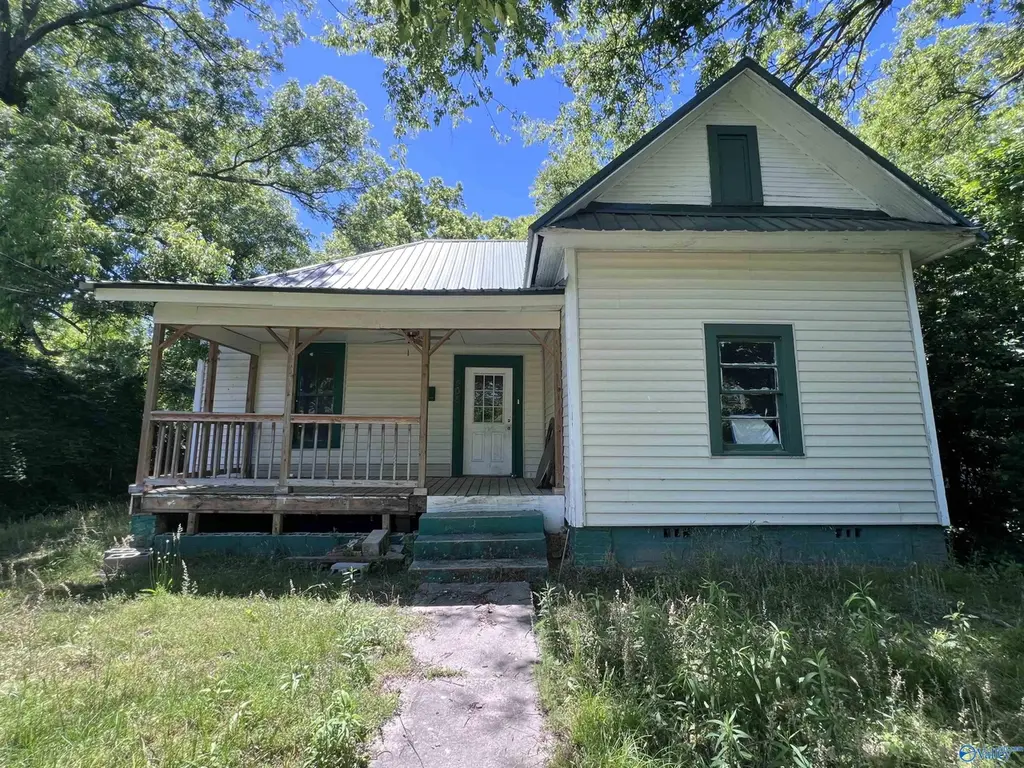
404 Riley St · Gadsden, AL
Flood risk 1/10 · Minimal
- FEMA flood zone
- X (unshaded)
- Chance of flooding over 30 yrs
- 0.0%
- Est. flood insurance / yr
- $507 – $1,088
Fire risk 3/10 · Minor
- Est. fire insurance / yr
- $916 – $1,700
Heat risk 6/10 · Moderate
- Hot days now (above 107°F)
- 7 days/yr
- Hot days in 30 yrs
- 19 days/yr
Wind risk 4/10 · Minor
- Chance of severe wind over 30 yrs
- 21.0%
Air-quality risk 2/10 · Minimal
- Unhealthy air days now
- 2 days/yr
- Unhealthy air days in 30 yrs
- 2 days/yr
Risk factors via First Street. Map © Google.
Why this score? — see what drove the B- grade
The composite is a weighted blend of 9 inputs, each scored 0–100. Each bar is that input's sub-score; the figure is the points it added to the 100-point composite (weight × sub-score).
- Cash flow +30.0/30.0
- 1% rule +10.0/10.0
- DSCR +10.0/10.0
- ARV discount +7.5/15.0
- Livability +3.0/5.0
- Rent growth +2.5/5.0
- Condition / age +2.5/5.0
- Schools +2.2/10.0
- Appreciation +0.0/10.0
$39,900
🖨 Deal sheet 📄 Offer letter ✓ Due diligence
Listing remarks
ATTENTION INVESTORS!! Already demoed and wide open, this 3 bed, 1 bath, 1,597± sqft property is primed for someone with a vision and the team to execute it. A dedicated kitchen, formal dining room, and generously sized bedrooms give you a great layout to work with. Those soaring ceilings? Imagine what they look like finished — dramatic living spaces that buyers fall in love with at first showing. The work has already begun. . Bring your hard hat and vision to bring this home back to life! Cash or conventional only. AS/IS.
Key facts
- Formal dining room
- Soaring ceilings
- Dedicated kitchen
Tags
Property features AI
Finance
- Other: Lot approximately 0.23 acres (about 50 x 195); Subdivision: Gadsden
- HOA & community: No association
Exterior
- Parking: Gravel driveway
- Utilities: Public water; Public sewer; Electric service
- Home design: Single-family residence; One story; Built in 1941
- Construction: Vinyl siding
- Exterior features: Covered porch; Public water; Public sewer
Interior
- Kitchen: Electric water heater
- Bathrooms: 1 full bathroom
- Interior features: Crawl space basement; Central heating and central cooling
Neighborhood map
What this means for you Summary
Snapshot
- This is a 3-bed/1.0-bath single-family listed at $40k.
Deal economics
- At list price, monthly cash flow is $672 ($8k/yr) — positive.
- The deal already cash-flows at list — no discount required.
- Meets the 1% rule at list price ($1k rent vs $40k).
- Recommended offer: $39k (1.5% below list) — sets the bar for market timing.
- Cap rate 26.5% vs local median 5.1% in Gadsden — top-decile yield for the area; either an underpriced asset or a hidden risk that comps aren't pricing in. Stress-test before assuming the spread holds.
Location & tenants
- Location reads 59/100 on livability (#335 in AL) — a working-class tenant base; expect higher turnover. Strengths: cost of living A+, housing A+; Watch: crime F, amenities F, commute F.
- Gadsden City (urban): math 15% / reading 39% proficiency, ranked #87 of 129 in AL (top 67%) — low school quality limits family demand, transient renter base, plan for 1-2y turnover; 66% free/reduced lunch — lower-income household profile, screen leases tightly.
- Zoned schools: W E Striplin Elementary School (math 5% / reading 21%, grade F, #532 of 627 statewide, top 85%, 464 students, 86% FRL); Gadsden Middle School (math 15% / reading 51%, grade F, #101 of 257 statewide, top 40%, 464 students, 75% FRL); Gadsden City High School (math 17% / reading 24%, grade F, #159 of 305 statewide, top 53%, 1,318 students, 76% FRL).
- Market conditions: 151 active listings in the ZIP; 2 comparable units currently listed for rent nearby; 119 units permitted in Etowah County in 2024 (0 in 5+ unit buildings).
Forward outlook
- Local home prices are declining (-3.0%/yr); year-one equity from $276 of loan paydown is wiped out by about $1k of value loss. Plan a longer hold.
- Etowah County population projected at -12% by 2050 — secular population decline; favor cash flow + early exit over multi-decade hold.
- At projected returns (-3.0% appreciation + 3.0% rent growth), your $11k cash investment doubles in ~2 years — after that, you're playing with house money.
Negotiation context
- It's been on market 28 days — a 2% lower offer ($39k) is reasonable based on typical stale-listing flexibility.
Risks & watch-outs
- Watch-outs: built in 1941 — expect roof / HVAC / electrical / plumbing capex.
- Climate carrying-cost: extreme-heat days projected 7→19/yr by 2055 (HVAC capex compounding) — expect insurance premiums to compound above CPI over the hold.
Questions for the listing agent
- Built in 1941 — when were the roof, HVAC, electrical panel, plumbing, and water heater last replaced?
- Is there a deadline driving the sale (1031 exchange, divorce, estate, relocation)? That informs how much negotiation room exists.
- Crime grade is F in this area — have there been break-ins, vandalism, or insurance claims at this property in the last 3 years? What carrier currently insures it and at what premium?
- What's the average days-on-market for RENTAL listings here right now (not sales)? A rising rental-DOM trend means longer vacancies and softer asking-rent achievability than the comps imply.
- What's the recent tenant-quality profile in this submarket — average credit score on applications, eviction rate, late-payment / NSF rate, and stable-employment percentage? A property-management company in the area should have these aggregated.
- How much new for-sale + rental construction is in the pipeline within 1–3 miles? Heavy new supply typically softens prices + rents 12–24 months out; constrained supply supports both.
Investment metrics
- 1% rule
- 2.97% ✓
- Cap rate
- 26.50%
- Cash-on-cash
- 72.15%
- DSCR
- 4.21
- GRM
- 2.8
CMA / ARV
- ARV (on-the-fly)
- $97,234
- Comps found
- 12
Show comp detail 12 sales within ~0.75 mi
| Address | Dist | Beds/Ba | Sqft | Sold | Price | $/sf | Match |
|---|---|---|---|---|---|---|---|
| 714 N 10th St | 0.34mi | 3/2.0 | 1,666 (+4%) | 9mo | $55,000 | $33 | 65 |
| 1125 Gardner St | 0.48mi | 4/2.0 (+1) | 1,634 (+2%) | 10mo | $49,670 | $30 | 56 |
| 920 Walnut St | 0.70mi | 3/2.0 | 1,625 (+2%) | 8mo | $92,000 | $57 | 54 |
| 753 Walnut St | 0.59mi | 3/1.5 | 1,450 (-9%) | 2mo | $135,500 | $93 | 54 |
| 1014 Valley Ave | 0.56mi | 2/1.0 (-1) | 1,471 (-8%) | 3mo | $89,900 | $61 | 54 |
| 906 N 8th St | 0.46mi | 3/2.0 | 1,450 (-9%) | 9mo | $50,000 | $34 | 52 |
| 402 S 8th St | 0.70mi | 3/2.5 | 1,600 (+0%) | 11mo | $181,000 | $113 | 52 |
| 902 Spring St | 0.69mi | 3/1.5 | 1,586 (-0%) | 19mo | $109,900 | $69 | 49 |
| 200 North 6th St | 0.38mi | 3/1.0 | 1,380 (-13%) | 14mo | $50,000 | $36 | 49 |
| 116 Cleveland Ct | 0.69mi | 3/2.0 | 1,732 (+9%) | 3mo | $217,500 | $126 | 47 |
| 1013 Hermosa Ave | 0.54mi | 3/1.0 | 1,392 (-13%) | 12mo | $89,900 | $65 | 44 |
| 716 S 10th St | 0.74mi | 3/2.0 | 1,399 (-12%) | 3mo | $85,000 | $61 | 38 |
Match score weights: distance 35% · size 25% · config 20% · recency 20%. Top-matched comps best support the ARV.
Projected returns pro-forma
-3.0% appreciation · 3.0% rent growth · sell at horizon
- IRR
- 71.8%
- Equity multiple
- 4.25×
- Total profit
- $36,329
- Equity at exit
- $5,949
- IRR
- 75.7%
- Equity multiple
- 8.77×
- Total profit
- $86,770
- Equity at exit
- $3,450
Cash invested: $11,172 (down + closing). Projections, not guarantees.
Landlord ↔ Tenant lean methodology
- Overall (STATE)
- 90 Strongly Landlord-Friendly
- State Alabama
- 90 Strongly Landlord-Friendly · R+15
- County
- — inherits STATE
- City
- — inherits STATE
ZIP-level market 35901
- Home prices YoY
- -9.9%
- Active inventory
- 151
- Price-to-rent
- 2.8×
Monthly cashflow live
- Estimated rent
- $1,186 medium interval (Pro) →
- Mortgage (P&I)
- −$209
- Tax from tax record
- −$39 /mo · $472/yr
- Insurance
- −$17
- HOA
- −$0
- Vacancy / Maint / Mgmt
- −$249
- Net cashflow
- $672
Break-even live
UW: 25.0% down · 7.5% · 30yr · 1.5% tax · 5.0% vac · 8.0% maint · 8.0% mgmt
Financing live
Cash to close
- Down payment
- $9,975
- Closing costs
- $1,197
- Reserves months
- —
- Total cash needed
- —
Loan-product check · same deal, 3 products live
Conventional
25% down · 7.5% · 30yr
- Down + closing
- —
- Monthly P&I
- —
- Monthly cashflow
- —
- DSCR
- —
- Eligible?
- —
Personal DTI + credit; lowest rate.
DSCR
20% down · 8.5% · 30yr
- Down + closing
- —
- Monthly P&I
- —
- Monthly cashflow
- —
- DSCR
- —
- Eligible?
- —
No personal income docs; deal must DSCR.
Hard money
10% down · 12.0% · 12mo
- Down + closing
- —
- Monthly P&I
- —
- Monthly cashflow
- —
- DSCR
- —
- Eligible?
- —
Short-term bridge; refi at stabilization.
Rent comps 2 comps
| Address | Beds | Baths | Sqft | Rent | $/sqft | DOM | Units | Dist |
|---|---|---|---|---|---|---|---|---|
| 1229 Jupiter St Gadsden, AL | 3.0 | 2.0 | 2034 | $1,400 | $0.69 | 44d | 1 | 1.31mi |
| 1001 Newton St Gadsden, AL | 2.0 | 1.5 | 1200 | $955 | $0.80 | 3d | 3 | 1.36mi |
Listing history 17 events
-
2026-06-19days on market $39,900 Active 28 DOM
-
2026-06-18days on market $39,900 Active 27 DOM
-
2026-06-17days on market $39,900 Active 26 DOM
-
2026-06-16days on market $39,900 Active 25 DOM
-
2026-06-15days on market $39,900 Active 24 DOM
-
2026-06-14days on market $39,900 Active 22 DOM
-
2026-06-12pricedays on market $39,900 Active 21 DOM
-
2026-06-09days on market $45,000 Active 18 DOM
-
2026-06-08days on market $45,000 Active 17 DOM
-
2026-06-07days on market $45,000 Active 16 DOM
-
2026-06-07days on market $45,000 Active 15 DOM
-
2026-06-04days on market $45,000 Active 12 DOM
-
2026-06-02days on market $45,000 Active 11 DOM
-
2026-06-01days on market $45,000 Active 10 DOM
-
2026-05-31days on market $45,000 Active 9 DOM
-
2026-05-31days on market $45,000 Active 8 DOM
-
2026-05-22$45,000 Active
ⓘ Source: listings_history table (triggers on properties + properties_extension) + one-shot
backfill from property_details.listing_events for pre-trigger history.
Tax reassessment forecast AL · Resets to sale price
- Current annual tax
- $472 · $39/mo
- Projected year-2 tax
- $472 · $39/mo
- Expected delta
- $0/yr ($0/mo · 0.0%)
ⓘ Screening estimate from a state-policy table — verify with the county assessor before closing.
Climate risk First Street
- Flood 1/10 Low FEMA zone X (unshaded) · 0% chance over 30 yrs
- Wildfire 3/10 Moderate
- Heat 6/10 Major 7 d/yr ≥107°F today · 19 d/yr by 30 yrs out
- Wind 4/10 Moderate 21% chance of damaging wind over 30 yrs
- Air quality 2/10 Low 2 unhealthy d/yr today · 2 by 30 yrs out
Nearby sold comps map
Loading sold comps map…
Walkable amenities ~0.75 mi
Loading nearby amenities…
Taxation est. · year 1
- Rental income
- $14,232
- − Mortgage interest
- −$2,235
- − Property taxes
- −$472
- − Insurance
- −$200
- − Repairs & maintenance
- −$1,139
- − Management
- −$1,139
- − Depreciation
- −$1,161
- Taxable income
- $7,887
- Est. tax owed @ 24.0%
- −$1,893
- After-tax cash flow
- $6,168/yr
For passive investors: Depreciation is non-cash, so a rental often shows a tax loss while cash-flowing — sheltering income. Rental losses are passive: they offset passive income freely, and up to $25,000/yr can offset ordinary (W-2) income if you actively participate and your MAGI is under $100k (phasing out to $0 by $150k); unused losses carry forward. On sale, claimed depreciation is recaptured at up to 25%, and gains may owe capital-gains tax (a 1031 exchange can defer both). Figures are a year-1 estimate at your 24.0% rate — not tax advice; consult a CPA.
Schools (NCES district)
- District
- Gadsden City
- NCES district ID
- 0101620
- Math proficiency
- 15% ▼ -27.00%
- Reading proficiency
- 39% ▼ -2.00%
- Median HH income
- $29,099
- Composite
- 21.62/100
- National rank
- #8292
- State rank
- #87 of 129 in AL
Livability — Gadsden
- Score
- 59/100
- State rank
- #335
- US rank
- #20131
Category grades
Schools grade is shown separately in the Schools card above.
Census & demographics
- Census place
- Gadsden, AL
- Population (ZIP)
- 19,186
Population outlook (Etowah County) Hauer SSP2
- Today (2025)
- 100,500 people
- By 2030
- 98,488 · -2.0%
- By 2040
- 93,731 · -6.7%
- By 2050
- 88,681 · -11.8%
- By 2075
- 76,746 · -23.6%
- By 2100
- 65,373 · -35.0%
Race, ethnicity, and origin ACS 2023
- Neighborhood character
- Diverse neighborhood (Simpson 0.59)
- Race & ethnicity
- White 55% Black 32% Hispanic / Latino 8% Two or more races 7%
- Hispanic origin (detail)
- Mexican 3% Puerto Rican 1%
- Common ancestry
- Slovak 1% Serbian 1% Lithuanian 1%
- Foreign-born
- 4% · Canada
- Languages at home
- 93% English-only · Spanish 5% Arabic 1% Russian/Polish/Slavic 1%
Political lean MEDSL · Etowah
- 2024 margin
- Solid R (+55.7) · D 21.8% · R 77.5%
- 2008→2024 swing
- -17.5pp toward R · 2008: -38.2pp · 2024: -55.7pp
- All cycles
- 2024: R+55.7 2020: R+50.2 2016: R+50.1 2012: R+38.4 2008: R+38.2
Not yet ingested
- Civics
- —
Market trends
- HPI YoY
- ▼ -26.83%
- Current HPI
- 243.6795
- Rent YoY
- —
- Metro
- —
- State GDP YoY
- ▲ 2.94%
- F500 in state
- 4
Industry mix (Fortune 500 HQ in AL)
| Industry | F500 HQs | Revenue |
|---|---|---|
| Financial Services | 1 | $8B |
|
||
| Healthcare | 1 | $5B |
|
||
Price history
1 event — show timeline
- 2026-05-22 Listed $45,000 VMLS
Property tax history
+11.3%/yrLatest (2025): $472 · +0.0% YoY. Source: county tax records.
Cash-flow waterfall
monthlySold comps — $/sqft
last 12 mo · ≤1 miLoading sold comps…