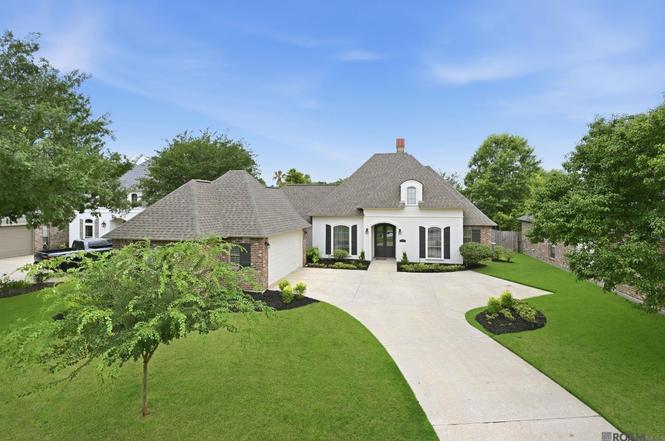
12375 Mill House Dr · Prairieville, LA
Flood risk 1/10 · Minimal
- FEMA flood zone
- X
- Chance of flooding over 30 yrs
- 0.0%
- Est. flood insurance / yr
- $507 – $1,088
Fire risk 1/10 · Minimal
- Est. fire insurance / yr
- $1,269 – $2,357
Heat risk 8/10 · Major
- Hot days now (above 108°F)
- 7 days/yr
- Hot days in 30 yrs
- 22 days/yr
Wind risk 9/10 · Severe
- Chance of severe wind over 30 yrs
- 99.0%
Air-quality risk 2/10 · Minimal
- Unhealthy air days now
- 1 days/yr
- Unhealthy air days in 30 yrs
- 2 days/yr
Risk factors via First Street. Map © Google.
Why this score? — see what drove the D+ grade
The composite is a weighted blend of 9 inputs, each scored 0–100. Each bar is that input's sub-score; the figure is the points it added to the 100-point composite (weight × sub-score).
- Cash flow +17.3/30.0
- ARV discount +6.3/15.0
- DSCR +5.4/10.0
- Schools +4.7/10.0
- 1% rule +3.8/10.0
- Livability +3.5/5.0
- Rent growth +2.5/5.0
- Condition / age +2.5/5.0
- Appreciation +0.0/10.0
$334,900
🖨 Deal sheet (PDF) 📄 Offer letter ✓ Due diligence
Listing remarks MLS
Welcome home to this beautiful 4-bedroom, 3-bath residence featuring a desirable triple-split floor plan in a fantastic location! Freshly painted inside and out with new landscaping, this move-in-ready home offers peace of mind with a newer roof (2020) and AC (2022). New carpet in all bedrooms and a new microwave add to the home's fresh appeal. The open-concept design is perfect for entertaining, featuring a spacious living area that flows seamlessly into the kitchen, complete with a large center island, abundant cabinetry, and ample counter space. The triple-split floor plan provides privacy and flexibility for families, guests, or a home office setup. Step outside and enjoy all the neighborhood amenities, including a community pool and clubhouse. Conveniently located near top-rated schools, shopping, dining, and easy interstate access, this home truly has it all.
Key facts
- Open-concept design
- New landscaping
- New carpet
Tags
Property features AI
Finance
- Other: Subdivision: Old Mill; Lot dimensions approximately 73 x 137 (about 0.23 acres)
- HOA & community: Homeowners association with annual fee ($450); HOA covers maintenance and management; Community pool; Community clubhouse; Playground; Gated community
Exterior
- Parking: 2 parking spaces; Garage with garage door opener; Driveway; Concrete surfaces
- Security: Smoke detector(s); Gated community
- Utilities: Public water; Cable connected
- Home design: Detached single-family residence; Residential property; Level lot
- Construction: Wood siding; Brick; Frame; Masonite; Stucco; Shingle roof; Slab foundation; Built around 2795 square feet
- Exterior features: Exterior lighting; Covered patio; Covered porch; Privacy fencing (full)
Interior
- Kitchen: Gas cooktop; Cooktop; Range; Oven; Range hood; Dishwasher; Microwave; Refrigerator; Breakfast bar
- Bedrooms: Bedrooms with walk-in closet(s)
- Flooring: Tile; Ceramic tile; Wood; Carpet
- Bathrooms: 3 full bathrooms
- Heating & cooling: Central heating; Central air; Ceiling fan(s)
- Interior features: Walk-in closet(s); Breakfast bar; Built-in features; Crown molding; High ceilings; Gas log fireplace
- Laundry & utility: Washer hookup inside; Electric dryer hookup
Neighborhood map
What this means for you Summary
Snapshot
- This is a 4-bed/3.0-bath single-family listed at $335k.
Deal economics
- At list price, monthly cash flow is $246 ($3k/yr) — positive.
- The deal already cash-flows at list — no discount required.
- To meet the 1% rule (rent ≥ 1% of price), the offer needs to be $295k (11.8% below list).
- Recommended offer: $295k (11.8% below list) — sets the bar for 1% rule.
- Cap rate 7.2% vs local median 4.4% in Prairieville — top-decile yield for the area; either an underpriced asset or a hidden risk that comps aren't pricing in. Stress-test before assuming the spread holds.
Location & tenants
- Location reads 69/100 on livability (#70 in LA) — a middle-class / working-renter tenant base. Strengths: employment A+, housing A+, crime B+; Watch: amenities F, commute F, health & safety F.
- Ascension Parish (suburban): math 48% / reading 58% proficiency, ranked #7 of 98 in LA (top 7%) — acceptable for families but not a draw, mixed tenant base, ~2y average lease.
- Zoned schools: Dutchtown Primary School (math 65% / reading 73%, grade A-, #32 of 646 statewide, top 5%, 603 students, 43% FRL); Dutchtown Middle School (math 56% / reading 70%, grade B+, #10 of 218 statewide, top 5%, 657 students, 36% FRL); Dutchtown High School (math 70% / reading 68%, grade B, #9 of 265 statewide, top 3%, 2,643 students, 30% FRL).
- Zoned-school proficiency averages 67% at this address vs 53% district-wide (+14 pts) — the actual schools serving this property are materially stronger than the Ascension Parish average implies; a family-tenant draw the district grade alone would hide.
- Market conditions: 139 active listings in the ZIP; 2 comparable units currently listed for rent nearby; 579 units permitted in Ascension Parish in 2024 (0 in 5+ unit buildings).
Forward outlook
- Local home prices are declining (-3.0%/yr); year-one equity from $2k of loan paydown is wiped out by about $10k of value loss. Plan a longer hold.
- Ascension County population projected at +43% by 2050 — long-run rental-demand tailwind backs the buy-and-hold thesis.
Negotiation context
- Only 4 days on market — expect competitive offers; lowballing is unlikely to land.
- 4 sale attempts since 22y ago with the ask held roughly flat each time — persistent listings suggest the price (not the market) is what's stuck; bring a comps-based counter.
- Current owner paid $248k; 35% above their basis — modest negotiation headroom, anchor on the comps not their cost.
Risks & watch-outs
- Climate carrying-cost: severe wind risk, 99% chance of damaging wind over 30y; extreme-heat days projected 7→22/yr by 2055 (HVAC capex compounding) — expect insurance premiums to compound above CPI over the hold.
Questions for the listing agent
- What does the HOA fee cover, when was the last increase, and are there any pending special assessments or reserve-fund shortfalls?
- Is there a deadline driving the sale (1031 exchange, divorce, estate, relocation)? That informs how much negotiation room exists.
- Schools are A-rated — typically a magnet for longer-tenancy family renters. What's the average tenant stay here, and is there a school-zone premium baked into asking?
- The area grade is low — what's the realistic commute time and amenity access for the typical tenant pool here? Any planned neighborhood developments (good or bad) we should know about?
- What's the average days-on-market for RENTAL listings here right now (not sales)? A rising rental-DOM trend means longer vacancies and softer asking-rent achievability than the comps imply.
- What's the recent tenant-quality profile in this submarket — average credit score on applications, eviction rate, late-payment / NSF rate, and stable-employment percentage? A property-management company in the area should have these aggregated.
- How much new for-sale + rental construction is in the pipeline within 1–3 miles? Heavy new supply typically softens prices + rents 12–24 months out; constrained supply supports both.
Investment metrics
- 1% rule
- 0.88% ✗
- Cap rate
- 7.17%
- Cash-on-cash
- 3.15%
- DSCR
- 1.14
- GRM
- 9.5
CMA / ARV
- ARV (on-the-fly)
- $326,439
- Comps found
- 12
Show comp detail 12 sales within ~0.75 mi
| Address | Dist | Beds/Ba | Sqft | Sold | Price | $/sf | Match |
|---|---|---|---|---|---|---|---|
| 12412 Mill House Dr | 0.08mi | 4/3.0 | 1,878 (-2%) | 8mo | $330,000 | $176 | 87 |
| 37069 Mill Run Ave | 0.20mi | 3/2.0 (-1) | 1,911 (+0%) | 4mo | $350,000 | $183 | 78 |
| 37052 Mill Wood Ave | 0.23mi | 4/3.0 | 1,933 (+1%) | 11mo | $330,000 | $171 | 78 |
| 12387 Old Millstone Dr | 0.06mi | 3/2.0 (-1) | 1,875 (-2%) | 9mo | $349,900 | $187 | 77 |
| 37038 Mill Wood Ave | 0.23mi | 3/2.0 (-1) | 1,876 (-2%) | 11mo | $295,000 | $157 | 68 |
| 12410 Sugarmill Dr | 0.06mi | 3/2.0 (-1) | 1,676 (-12%) | 10mo | $325,000 | $194 | 60 |
| 37188 Audubon Park Ave | 0.40mi | 3/2.0 (-1) | 1,827 (-4%) | 10mo | $289,900 | $159 | 57 |
| 12459 Arceneaux Ln | 0.63mi | 3/2.0 (-1) | 1,807 (-5%) | 7mo | $177,000 | $98 | 47 |
| 12214 Deventer Dr | 0.63mi | 4/3.0 | 2,102 (+10%) | 8mo | $424,900 | $202 | 47 |
| 12237 Spring Valley Dr | 0.27mi | 3/2.0 (-1) | 1,623 (-15%) | 8mo | $260,000 | $160 | 47 |
| 37055 John St | 0.56mi | 3/2.5 (-1) | 1,716 (-10%) | 7mo | $285,000 | $166 | 44 |
| 12371 Dutchtown Villa Dr | 0.47mi | 3/2.0 (-1) | 1,656 (-13%) | 6mo | $259,900 | $157 | 42 |
Match score weights: distance 35% · size 25% · config 20% · recency 20%. Top-matched comps best support the ARV.
Projected returns pro-forma
-3.0% appreciation · 3.0% rent growth · sell at horizon
- IRR
- -11.4%
- Equity multiple
- 0.59×
- Total profit
- $-38,692
- Equity at exit
- $49,935
- IRR
- -2.2%
- Equity multiple
- 0.85×
- Total profit
- $-13,899
- Equity at exit
- $28,956
Cash invested: $93,772 (down + closing). Projections, not guarantees.
Landlord ↔ Tenant lean methodology
- Overall (STATE)
- 90 Strongly Landlord-Friendly
- State Louisiana
- 90 Strongly Landlord-Friendly · R+12
- County
- — inherits STATE
- City
- — inherits STATE
ZIP-level market 70734
- Home prices YoY
- -21.6%
- Active inventory
- 139
- Price-to-rent
- 9.5×
Monthly cashflow live
- Estimated rent
- $2,953 medium interval (Pro) →
- Mortgage (P&I)
- −$1,756
- Tax from tax record
- −$153 /mo · $1,836/yr
- Insurance
- −$140
- HOA
- −$38
- Vacancy / Maint / Mgmt
- −$620
- Net cashflow
- $246
Break-even live
Sensitivity live
| Price | -10% $436 | -5% $341 | +0% $246 | +5% $151 | +10% $56 |
|---|---|---|---|---|---|
| Rent | -10% $13 | -5% $129 | +0% $246 | +5% $363 | +10% $479 |
| Rate | -1.0pp $415 | -0.5pp $331 | base $246 | +0.5pp $159 | +1.0pp $71 |
UW: 25.0% down · 7.5% · 30yr · 1.5% tax · 5.0% vac · 8.0% maint · 8.0% mgmt
Financing live
Cash to close
- Down payment
- $83,725
- Closing costs
- $10,047
- Reserves months
- —
- Total cash needed
- —
Loan-product check · same deal, 3 products live
Conventional
25% down · 7.5% · 30yr
- Down + closing
- —
- Monthly P&I
- —
- Monthly cashflow
- —
- DSCR
- —
- Eligible?
- —
Personal DTI + credit; lowest rate.
DSCR
20% down · 8.5% · 30yr
- Down + closing
- —
- Monthly P&I
- —
- Monthly cashflow
- —
- DSCR
- —
- Eligible?
- —
No personal income docs; deal must DSCR.
Hard money
10% down · 12.0% · 12mo
- Down + closing
- —
- Monthly P&I
- —
- Monthly cashflow
- —
- DSCR
- —
- Eligible?
- —
Short-term bridge; refi at stabilization.
Rent comps 2 comps
| Address | Beds | Baths | Sqft | Rent | $/sqft | DOM | Units | Dist |
|---|---|---|---|---|---|---|---|---|
| 37393 Preserve Trl Gonzales, LA | 3.0 | 2.5 | 1956 | $2,500 | $1.28 | 16d | 2 | 0.77mi |
| 37313 Mindy Way Ave Prairieville, LA | 4.0 | 3.0 | 2517 | $4,050 | $1.61 | 45d | 1 | 1.45mi |
HOA detail
- Monthly dues
- $38 · $456/yr
- Likely covers
- landscapingpool
Listing history 3 events
-
2026-06-21days on market $334,900 Active 4 DOM
-
2026-06-18remarks 699-char remark
-
2026-06-18$334,900 Active 1 DOM
ⓘ Source: listings_history table (triggers on properties + properties_extension) + one-shot
backfill from property_details.listing_events for pre-trigger history.
Tax reassessment forecast LA · Resets to sale price
- Current annual tax
- $1,836 · $153/mo
- Projected year-2 tax
- $1,842 · $153/mo
- Expected delta
- +$6/yr (+$1/mo · 0.3%)
ⓘ Screening estimate from a state-policy table — verify with the county assessor before closing.
Climate risk First Street
- Flood 1/10 Low FEMA zone X · 0% chance over 30 yrs
- Wildfire 1/10 Low
- Heat 8/10 Severe 7 d/yr ≥108°F today · 22 d/yr by 30 yrs out
- Wind 9/10 Extreme 99% chance of damaging wind over 30 yrs
- Air quality 2/10 Low 1 unhealthy d/yr today · 2 by 30 yrs out
Nearby sold comps map
Loading sold comps map…
Walkable amenities ~0.75 mi
Loading nearby amenities…
Taxation est. · year 1
- Rental income
- $35,435
- − Mortgage interest
- −$18,760
- − Property taxes
- −$1,836
- − Insurance
- −$1,674
- − Repairs & maintenance
- −$2,835
- − Management
- −$2,835
- − HOA
- −$456
- − Depreciation
- −$9,743
- Taxable loss
- −$2,703
- Est. tax savings @ 24.0%
- +$649
- After-tax cash flow
- $3,601/yr
For passive investors: Depreciation is non-cash, so a rental often shows a tax loss while cash-flowing — sheltering income. Rental losses are passive: they offset passive income freely, and up to $25,000/yr can offset ordinary (W-2) income if you actively participate and your MAGI is under $100k (phasing out to $0 by $150k); unused losses carry forward. On sale, claimed depreciation is recaptured at up to 25%, and gains may owe capital-gains tax (a 1031 exchange can defer both). Figures are a year-1 estimate at your 24.0% rate — not tax advice; consult a CPA.
Schools (NCES district)
- District
- Ascension Parish
- NCES district ID
- 2200090
- Math proficiency
- 48% ▼ -31.00%
- Reading proficiency
- 58% ▼ -25.00%
- Median HH income
- $68,423
- Composite
- 47.0/100
- National rank
- #2347
- State rank
- #7 of 98 in LA
Livability — Prairieville
- Score
- 69/100
- State rank
- #70
- US rank
- #8507
Category grades
Schools grade is shown separately in the Schools card above.
Census & demographics
- City population
- 49,278
- Population (ZIP)
- 9,880
Population outlook (Ascension County) Hauer SSP2
- Today (2025)
- 145,480 people
- By 2030
- 158,329 · +8.8%
- By 2040
- 183,741 · +26.3%
- By 2050
- 207,615 · +42.7%
- By 2075
- 260,244 · +78.9%
- By 2100
- 289,576 · +99.0%
Race, ethnicity, and origin ACS 2023
- Neighborhood character
- Diverse neighborhood (Simpson 0.59)
- Race & ethnicity
- White 58% Hispanic / Latino 21% Black 17% Two or more races 14% Asian 2%
- Hispanic origin (detail)
- Mexican 6%
- Common ancestry
- Lithuanian 4% Italian 2% Serbian 2%
- Foreign-born
- 5% · Canada, Jamaica, South Korea
- Languages at home
- 91% English-only · Spanish 6% French/Haitian/Cajun 1% Other Asian/Pacific 1%
Political lean MEDSL · Ascension
- 2024 margin
- Solid R (+34.0) · D 32.2% · R 66.1% · Other 1.7%
- 2008→2024 swing
- +1.7pp toward D · 2008: -35.7pp · 2024: -34.0pp
- All cycles
- 2024: R+34.0 2020: R+32.5 2016: R+36.0 2012: R+34.3 2008: R+35.7
Not yet ingested
- Civics
- —
Market trends
- HPI YoY
- ▼ -40.70%
- Current HPI
- 148.0987
- Rent YoY
- —
- Metro
- —
- State GDP YoY
- ▲ 3.29%
- F500 in state
- 10
Industry mix (Fortune 500 HQ in LA)
| Industry | F500 HQs | Revenue |
|---|---|---|
| Telecommunications | 2 | $23B |
|
||
| Utilities | 1 | $12B |
|
||
| Wholesale / Distribution | 1 | $5B |
|
||
| Advertising | 1 | $2B |
|
||
Price history
+74.6% since first listed5 events — show timeline
- 2026-06-17 Listed $334,900 GBRMLS
- 2026-06-17 Listed $334,900 AcadianaMLS
- 2006-04-13 Sold (Public Records) $248,400 Public Records
- 2006-02-12 Listed $249,900 AcadianaMLS
- 2004-02-11 Listed $191,800 AcadianaMLS
Property tax history
-0.2%/yrLatest (2025): $1,836 · -1.8% YoY. Source: county tax records.
Cash-flow waterfall
monthlySold comps — $/sqft
last 12 mo · ≤1 miLoading sold comps…