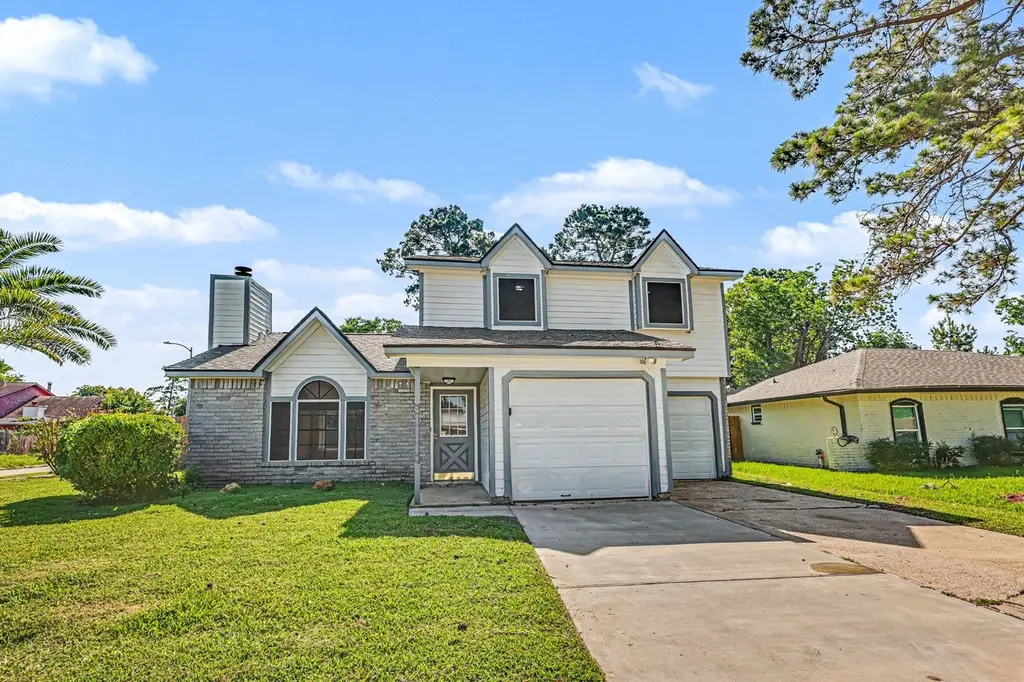
20038 Faye Oaks Dr · Atascocita, TX
Flood risk 3/10 · Minor
- FEMA flood zone
- X (unshaded)
- Chance of flooding over 30 yrs
- 0.2%
- Est. flood insurance / yr
- $507 – $1,088
Fire risk 2/10 · Minimal
- Est. fire insurance / yr
- $1,222 – $2,270
Heat risk 9/10 · Severe
- Hot days now (above 110°F)
- 7 days/yr
- Hot days in 30 yrs
- 24 days/yr
Wind risk 9/10 · Severe
- Chance of severe wind over 30 yrs
- 99.0%
Air-quality risk 3/10 · Minor
- Unhealthy air days now
- 3 days/yr
- Unhealthy air days in 30 yrs
- 3 days/yr
Risk factors via First Street. Map © Google.
Why this score? — see what drove the C grade
The composite is a weighted blend of 9 inputs, each scored 0–100. Each bar is that input's sub-score; the figure is the points it added to the 100-point composite (weight × sub-score).
- Cash flow +15.7/30.0
- ARV discount +13.2/15.0
- 1% rule +5.2/10.0
- DSCR +4.8/10.0
- Appreciation +4.5/10.0
- Schools +3.9/10.0
- Livability +3.5/5.0
- Rent growth +2.5/5.0
- Condition / age +2.5/5.0
$189,900
🖨 Deal sheet 📄 Offer letter ✓ Due diligence
Listing remarks MLS
Perfect starter home or investment opportunity in the quiet and established community of Atascocita North. Bring your creativity and make this two story, 3 bedroom, 2.5 bath your very own. Located on an oversized, corner lot on a quiet street with a HUGE backyard and storage shed. Home features cathedral ceilings, tile flooring downstairs in the common areas, wood burning fireplace and kitchen/dining that opens to a large family room. Convenient half bath downstairs. Primary bedroom has private ensuite bath with tub/shower combo and secondary bedrooms also have their own full bath. Refrigerator, washer and dryer stay with the house. Garage has windows!!!! House is within walking distance to community pool, park and playground. Located in the Atascocita/Humble area, this home has NEVER FLOODED and is conveniently located to Lake Houston, restaurants, shopping and is a perfect location for commuting Houston - only minutes from Highway 59, I45, Grand Parkway 99 and Beltway 8.
Key facts
- Tall ceilings
- Cozy fireplace
- Large walk-in closet
Tags
Property features AI
Finance
- HOA & community: Member of Oaks of Atascocita Community Impr; Annual association fee of $308
Exterior
- Parking: Attached garage with 2 parking spaces
- Security: Smoke detectors
- Utilities: Public water; Public sewer
- Home design: Residential property; Faces west; Built in 1982; Slab foundation
- Construction: Brick and vinyl siding exterior; Composition roof
- Exterior features: Fully fenced yard; Corner lot in a subdivision; Asphalt road frontage
Interior
- Kitchen: Dishwasher; Disposal; Gas oven; Gas range; Microwave; Oven; Refrigerator
- Bedrooms: Primary bedroom (second level) approximately 13x11; Bedroom (second level) approximately 11x9; Bedroom (second level) approximately 9x8; Living room listed as on first level (13x14)
- Flooring: Carpet; Tile
- Bathrooms: 2 full bathrooms; 1 half bathroom
- Heating & cooling: Central heating (gas); Central electric air conditioning
- Interior features: Granite counters; High ceilings; Vaulted ceilings; Tub with shower; Living/dining room combination; Satellite dish; Gas and wood-burning fireplace
- Laundry & utility: Washer hookup; Electric dryer hookup
Neighborhood map
What this means for you Summary
Snapshot
- This is a 3-bed/2.5-bath single-family listed at $190k.
Deal economics
- At list price, monthly cash flow is $84 ($1k/yr) — positive.
- The deal already cash-flows at list — no discount required.
- Meets the 1% rule at list price ($2k rent vs $190k).
- Recommended offer: $187k (1.5% below list) — sets the bar for market timing.
- Cap rate 6.8% vs local median 4.1% in Atascocita — top-decile yield for the area; either an underpriced asset or a hidden risk that comps aren't pricing in. Stress-test before assuming the spread holds.
Location & tenants
- Location reads 70/100 on livability (#346 in TX) — a middle-class / working-renter tenant base. Strengths: employment A+, cost of living A+, housing A+; Watch: amenities F, commute F, health & safety F.
- Humble ISD (urban): math 38% / reading 44% proficiency, ranked #262 of 826 in TX (top 32%) — families likely to look elsewhere, expect single-tenant / working-renter base with shorter leases.
- Zoned schools: Timberwood Middle (math 31% / reading 46%, grade F, #704 of 1,662 statewide, top 43%, 1,094 students, 54% FRL); Atascocita H S (math 41% / reading 52%, grade D-, #621 of 1,632 statewide, top 38%, 3,829 students, 42% FRL) — zoned schools average 48% FRL vs 32% district-wide (16 pts higher); higher-poverty schools than district average — tighter screening recommended.
- Market conditions: Rents flat; 669 active listings in the ZIP; 8 comparable units currently listed for rent nearby; rentals at typical pace (median 22d on market — plan ~3-4 weeks tenant-placement turnaround); high-income renter base; 29,883 units permitted in Harris County in 2024 (8,621 in 5+ unit buildings).
Forward outlook
- Local home prices are declining (-0.9%/yr); year-one equity from $1k of loan paydown is wiped out by about $2k of value loss. Plan a longer hold.
- Harris County population projected at +47% by 2050 — long-run rental-demand tailwind backs the buy-and-hold thesis.
Negotiation context
- It's been on market 17 days — a 2% lower offer ($187k) is reasonable based on typical stale-listing flexibility.
- 5 sale attempts since 24y ago with the ask held roughly flat each time — persistent listings suggest the price (not the market) is what's stuck; bring a comps-based counter.
- Current owner paid $55k; list at $190k implies a 245% gain — meaningful room to come down on a strong offer.
Risks & watch-outs
- Climate carrying-cost: severe wind risk, 99% chance of damaging wind over 30y; extreme-heat days projected 7→24/yr by 2055 (HVAC capex compounding) — expect insurance premiums to compound above CPI over the hold.
Questions for the listing agent
- What does the HOA fee cover, when was the last increase, and are there any pending special assessments or reserve-fund shortfalls?
- Is there a deadline driving the sale (1031 exchange, divorce, estate, relocation)? That informs how much negotiation room exists.
- What's the average days-on-market for RENTAL listings here right now (not sales)? A rising rental-DOM trend means longer vacancies and softer asking-rent achievability than the comps imply.
- What's the recent tenant-quality profile in this submarket — average credit score on applications, eviction rate, late-payment / NSF rate, and stable-employment percentage? A property-management company in the area should have these aggregated.
- How much new for-sale + rental construction is in the pipeline within 1–3 miles? Heavy new supply typically softens prices + rents 12–24 months out; constrained supply supports both.
Investment metrics
- 1% rule
- 1.02% ✓
- Cap rate
- 6.82%
- Cash-on-cash
- 1.89%
- DSCR
- 1.08
- GRM
- 8.2
CMA / ARV
- ARV (on-the-fly)
- $217,350
- Comps found
- 12
Show comp detail 12 sales within ~0.75 mi
| Address | Dist | Beds/Ba | Sqft | Sold | Price | $/sf | Match |
|---|---|---|---|---|---|---|---|
| 20026 Faye Oaks Dr | 0.03mi | 3/3.0 | 1,376 (-5%) | 10mo | $214,000 | $156 | 80 |
| 20130 Misty Pines Dr | 0.16mi | 3/2.0 | 1,365 (-6%) | 1mo | $225,000 | $165 | 80 |
| 5415 Fawn Trail Ln | 0.34mi | 3/2.0 | 1,467 (+1%) | 2mo | $175,000 | $119 | 78 |
| 20035 Dawn Mist Dr | 0.31mi | 3/2.0 | 1,534 (+6%) | 0mo | $177,000 | $115 | 73 |
| 5442 Dove Forest Ln | 0.27mi | 3/2.0 | 1,380 (-5%) | 9mo | $200,000 | $145 | 70 |
| 5534 Deer Timbers Trl | 0.31mi | 3/2.0 | 1,570 (+8%) | 1mo | $235,000 | $150 | 69 |
| 19914 Big Timber Dr | 0.14mi | 3/2.0 | 1,610 (+11%) | 5mo | $198,000 | $123 | 69 |
| 19919 Burle Oak Dr | 0.24mi | 4/2.0 (+1) | 1,294 (-11%) | 3mo | $185,000 | $143 | 62 |
| 5619 Fawn Trail Ln | 0.24mi | 3/2.0 | 1,664 (+15%) | 1mo | $214,990 | $129 | 61 |
| 20109 Misty Pines Dr | 0.23mi | 3/2.0 | 1,267 (-13%) | 7mo | $229,000 | $181 | 60 |
| 19918 Burle Oak Dr | 0.23mi | 3/2.5 | 1,248 (-14%) | 9mo | $205,000 | $164 | 59 |
| 20814 Lake Park Trl | 0.64mi | 3/2.0 | 1,596 (+10%) | 6mo | $260,000 | $163 | 46 |
Match score weights: distance 35% · size 25% · config 20% · recency 20%. Top-matched comps best support the ARV.
Projected returns pro-forma
-0.95% appreciation · 0.09% rent growth · sell at horizon
- IRR
- -6.2%
- Equity multiple
- 0.74×
- Total profit
- $-13,979
- Equity at exit
- $46,258
- IRR
- -2.3%
- Equity multiple
- 0.81×
- Total profit
- $-10,329
- Equity at exit
- $48,931
Cash invested: $53,172 (down + closing). Projections, not guarantees.
Landlord ↔ Tenant lean methodology
- Overall (STATE)
- 87 Strongly Landlord-Friendly
- State Texas
- 87 Strongly Landlord-Friendly · R+5
- County
- — inherits STATE
- City
- — inherits STATE
ZIP-level market 77346
- Home prices YoY
- -0.4%
- Rents YoY
- 0.1%
- Active inventory
- 669
- Price-to-rent
- 8.2×
Monthly cashflow live
- Estimated rent
- $1,938 high interval (Pro) →
- Mortgage (P&I)
- −$996
- Tax from tax record
- −$346 /mo · $4,156/yr
- Insurance
- −$79
- HOA
- −$26
- Vacancy / Maint / Mgmt
- −$407
- Net cashflow
- $84
Break-even live
UW: 25.0% down · 7.5% · 30yr · 1.5% tax · 5.0% vac · 8.0% maint · 8.0% mgmt
Financing live
Cash to close
- Down payment
- $47,475
- Closing costs
- $5,697
- Reserves months
- —
- Total cash needed
- —
Loan-product check · same deal, 3 products live
Conventional
25% down · 7.5% · 30yr
- Down + closing
- —
- Monthly P&I
- —
- Monthly cashflow
- —
- DSCR
- —
- Eligible?
- —
Personal DTI + credit; lowest rate.
DSCR
20% down · 8.5% · 30yr
- Down + closing
- —
- Monthly P&I
- —
- Monthly cashflow
- —
- DSCR
- —
- Eligible?
- —
No personal income docs; deal must DSCR.
Hard money
10% down · 12.0% · 12mo
- Down + closing
- —
- Monthly P&I
- —
- Monthly cashflow
- —
- DSCR
- —
- Eligible?
- —
Short-term bridge; refi at stabilization.
Rent comps 8 comps
| Address | Beds | Baths | Sqft | Rent | $/sqft | DOM | Units | Dist |
|---|---|---|---|---|---|---|---|---|
| 20143 Dawn Mist Dr Humble, TX | 3.0 | 2.5 | 1617 | $1,659 | $1.03 | 43d | 1 | 0.21mi |
| 19902 Burle Oak Dr Humble, TX | 3.0 | 2.5 | 1532 | $1,699 | $1.11 | 43d | 1 | 0.22mi |
| 5419 Deer Timbers Trl Humble, TX | 3.0 | 2.0 | 1313 | $1,705 | $1.30 | 21d | 1 | 0.33mi |
| 6519 Kings Glen Dr Humble, TX | 1.0–3.0 | 1.0–2.5 | 1255 | $2,813 | $2.24 | 1d | 16 | 0.94mi |
| 6227 Spruce Bough Ct Humble, TX | 3.0 | 2.0 | 1432 | $1,800 | $1.26 | 43d | 1 | 1.11mi |
| 19113 Moon Trail Dr Unit ECT Humble, TX | 2.0 | 2.0 | 1054 | $1,319 | $1.25 | 11d | 1 | 1.11mi |
| 18835 Atasca Oaks Dr Humble, TX | 3.0 | 2.0 | 1432 | $1,829 | $1.28 | 5d | 1 | 1.26mi |
| 5231 Flax Bourton St Humble, TX | 3.0 | 2.0 | 1513 | $1,856 | $1.23 | 1d | 1 | 1.45mi |
HOA detail
- Monthly dues
- $26 · $312/yr
- Likely covers
- pool
Listing history 13 events
-
2026-06-18days on market $189,900 Active 17 DOM
-
2026-06-17days on market $189,900 Active 16 DOM
-
2026-06-16days on market $189,900 Active 15 DOM
-
2026-06-15days on market $189,900 Active 14 DOM
-
2026-06-13days on market $189,900 Active 12 DOM
-
2026-06-13days on market $189,900 Active 11 DOM
-
2026-06-09days on market $189,900 Active 8 DOM
-
2026-06-08days on market $189,900 Active 7 DOM
-
2026-06-07days on market $189,900 Active 6 DOM
-
2026-06-04days on market $189,900 Active 3 DOM
-
2026-06-03days on market $189,900 Active 2 DOM
-
2026-06-02remarks 642-char remark
-
2026-06-02$189,900 Active 1 DOM
ⓘ Source: listings_history table (triggers on properties + properties_extension) + one-shot
backfill from property_details.listing_events for pre-trigger history.
Tax reassessment forecast TX · Resets to sale price
- Current annual tax
- $4,156 · $346/mo
- Projected year-2 tax
- $4,156 · $346/mo
- Expected delta
- $0/yr ($0/mo · 0.0%)
ⓘ Screening estimate from a state-policy table — verify with the county assessor before closing.
Climate risk First Street
- Flood 3/10 Moderate FEMA zone X (unshaded) · 20% chance over 30 yrs
- Wildfire 2/10 Low
- Heat 9/10 Extreme 7 d/yr ≥110°F today · 24 d/yr by 30 yrs out
- Wind 9/10 Extreme 99% chance of damaging wind over 30 yrs
- Air quality 3/10 Moderate 3 unhealthy d/yr today · 3 by 30 yrs out
Nearby sold comps map
Loading sold comps map…
Walkable amenities ~0.75 mi
Loading nearby amenities…
Taxation est. · year 1
- Rental income
- $23,256
- − Mortgage interest
- −$10,637
- − Property taxes
- −$4,156
- − Insurance
- −$950
- − Repairs & maintenance
- −$1,860
- − Management
- −$1,860
- − HOA
- −$312
- − Depreciation
- −$5,524
- Taxable loss
- −$2,045
- Est. tax savings @ 24.0%
- +$491
- After-tax cash flow
- $1,495/yr
For passive investors: Depreciation is non-cash, so a rental often shows a tax loss while cash-flowing — sheltering income. Rental losses are passive: they offset passive income freely, and up to $25,000/yr can offset ordinary (W-2) income if you actively participate and your MAGI is under $100k (phasing out to $0 by $150k); unused losses carry forward. On sale, claimed depreciation is recaptured at up to 25%, and gains may owe capital-gains tax (a 1031 exchange can defer both). Figures are a year-1 estimate at your 24.0% rate — not tax advice; consult a CPA.
Schools (NCES district)
- District
- Humble ISD
- NCES district ID
- 4823910
- Math proficiency
- 38% ▼ -11.00%
- Reading proficiency
- 44% ▼ -7.00%
- Median HH income
- $83,946
- Composite
- 38.55/100
- National rank
- #4171
- State rank
- #262 of 826 in TX
Livability — Atascocita
- Score
- 70/100
- State rank
- #346
- US rank
- #7586
Category grades
Schools grade is shown separately in the Schools card above.
Census & demographics
- Census place
- Atascocita, TX
- County
- Harris County · 4,702,590 people
- City population
- 79,538
- Metro
- Houston-The Woodlands-Sugar Land, TX
- Population (ZIP)
- 79,538
- Household income
- $122,241
- Rent vs Own
- Severe rent burden
- 1072.0
Population outlook (Harris County) Hauer SSP2
- Today (2025)
- 5,571,493 people
- By 2030
- 6,089,821 · +9.3%
- By 2040
- 7,142,806 · +28.2%
- By 2050
- 8,185,864 · +46.9%
- By 2075
- 10,574,329 · +89.8%
- By 2100
- 12,109,958 · +117.4%
Race, ethnicity, and origin ACS 2023
- Neighborhood character
- Diverse neighborhood (Simpson 0.70)
- Race & ethnicity
- White 42% Hispanic / Latino 28% Black 21% Two or more races 18% Asian 4%
- Hispanic origin (detail)
- Mexican 20% Puerto Rican 2%
- Common ancestry
- Lithuanian 4% Slovak 1% Italian 1%
- Foreign-born
- 10% · Canada, Vietnam, China
- Languages at home
- 78% English-only · Spanish 17% Other Indo-European 1% German/W. Germanic 1%
Political lean MEDSL · Harris
- 2024 margin
- Lean D (+5.5) · D 52.0% · R 46.4% · Other 1.6%
- 2008→2024 swing
- +3.9pp toward D · 2008: 1.6pp · 2024: 5.5pp
- All cycles
- 2024: D+5.5 2020: D+13.3 2016: D+12.4 2012: D+0.1 2008: D+1.6
Not yet ingested
- Civics
- —
Market trends
- HPI YoY
- ▼ -0.95%
- Current HPI
- 218.0478
- Rent YoY
- ▲ 0.09%
- Metro
- Houston-The Woodlands-Sugar Land, TX
- State GDP YoY
- ▲ 3.95%
- F500 in state
- 110
Industry mix (Fortune 500 HQ in TX)
| Industry | F500 HQs | Revenue |
|---|---|---|
| Energy | 16 | $1,198B |
|
||
| Technology | 5 | $198B |
|
||
| Engineering / Construction | 4 | $72B |
|
||
| Energy Services | 3 | $60B |
|
||
| Utilities | 3 | $41B |
|
||
| Healthcare | 2 | $330B |
|
||
Price history
+245.3% since first listed16 events — show timeline
- 2026-06-01 Listed $189,900 HARMLS
- 2024-01-27 Rental Removed $1,540 RENTLY
- 2024-01-04 Listed for Rent $1,540 RENTLY
- 2021-09-20 Sold (Public Records) — Public Records
- 2021-09-13 Sold (MLS) — HARMLS
- 2021-08-31 Pending — HARMLS
- 2021-08-19 Pending — HARMLS
- 2021-07-25 Pending — HARMLS
- 2021-07-19 Pending — HARMLS
- 2021-07-12 Listed $155,000 HARMLS
- 2004-06-18 Sold (Public Records) — Public Records
- 2004-03-14 Listing Removed — HARMLS
- 2004-01-27 Listed $91,500 HARMLS
- 2002-04-24 Listing Removed — HARMLS
- 2002-02-27 Listed $84,950 HARMLS
- 1994-09-30 Sold (Public Records) $55,000 Public Records
Property tax history
+3.5%/yrLatest (2025): $4,156 · -8.1% YoY. Source: county tax records.
Cash-flow waterfall
monthlySold comps — $/sqft
last 12 mo · ≤1 miLoading sold comps…