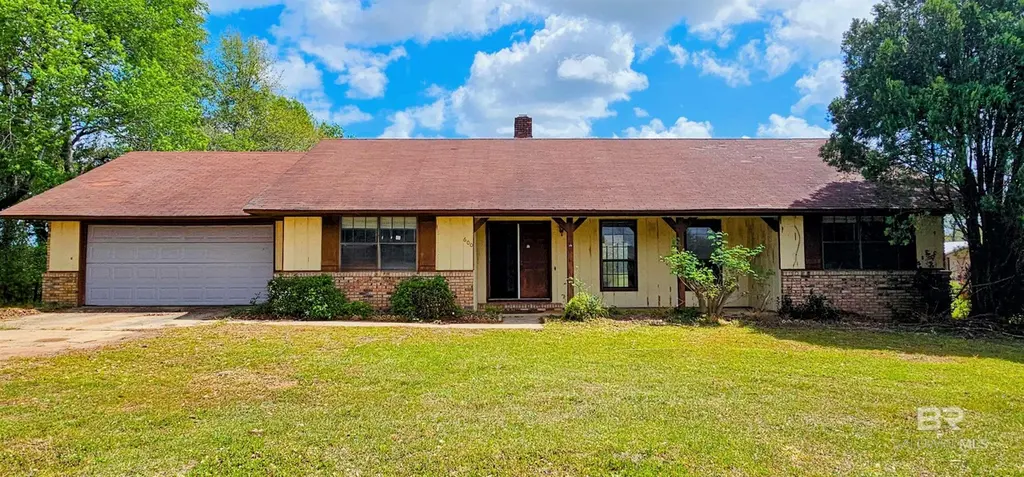
600 Highway 113 · Flomaton, AL
Flood risk 1/10 · Minimal
- FEMA flood zone
- X (unshaded)
- Chance of flooding over 30 yrs
- 0.0%
- Est. flood insurance / yr
- $507 – $1,088
Fire risk 3/10 · Minor
- Est. fire insurance / yr
- $916 – $1,700
Heat risk 8/10 · Major
- Hot days now (above 107°F)
- 7 days/yr
- Hot days in 30 yrs
- 20 days/yr
Wind risk 9/10 · Severe
- Chance of severe wind over 30 yrs
- 99.0%
Air-quality risk 1/10 · Minimal
- Unhealthy air days now
- 0 days/yr
- Unhealthy air days in 30 yrs
- 0 days/yr
Risk factors via First Street. Map © Google.
Why this score? — see what drove the D+ grade
The composite is a weighted blend of 9 inputs, each scored 0–100. Each bar is that input's sub-score; the figure is the points it added to the 100-point composite (weight × sub-score).
- Cash flow +20.6/30.0
- Appreciation +7.9/10.0
- DSCR +6.5/10.0
- 1% rule +4.2/10.0
- Livability +2.8/5.0
- Rent growth +2.5/5.0
- Condition / age +2.5/5.0
- Schools +2.3/10.0
- ARV discount +0.5/15.0
$121,000
🖨 Deal sheet 📄 Offer letter ✓ Due diligence
Listing remarks
Welcome to this 3-bedroom, 2-bath ranch-style home offering approximately 1,774 square feet of living space. Built in 1980, this property features a functional floor plan with a spacious living area, fireplace, and an attached 2-car garage. Situated on approximately 0.47 acres, the home provides a comfortable setting with room to enjoy outdoor space. The property offers solid construction with a brick and wood exterior along with central heating and air. While some updates may be desired, this home presents a great opportunity for buyers to personalize and make it their own over time. Conveniently located on Highway 113, providing easy access to nearby areas and everyday amenities. Don&rsqu
Key facts
- Spacious living area
- 0.47 acre lot
- 2 garage spots
Tags
Neighborhood map
What this means for you Summary
Snapshot
- This is a 3-bed/1.0-bath single-family listed at $121k.
Deal economics
- At list price, monthly cash flow is $161 ($2k/yr) — positive.
- The deal already cash-flows at list — no discount required.
- To meet the 1% rule (rent ≥ 1% of price), the offer needs to be $111k (8.1% below list).
- Recommended offer: $111k (8.1% below list) — sets the bar for 1% rule.
Location & tenants
- Location reads 55/100 on livability (#446 in AL) — a working-class tenant base; expect higher turnover. Strengths: cost of living A+, housing A, health & safety B+; Watch: schools D+, crime F, amenities F.
- Escambia County (town): math 17% / reading 39% proficiency, ranked #83 of 129 in AL (top 64%) — low school quality limits family demand, transient renter base, plan for 1-2y turnover; 70% free/reduced lunch — lower-income household profile, screen leases tightly.
- Market conditions: 19 active listings in the ZIP; 18 units permitted in Escambia County in 2024 (0 in 5+ unit buildings).
Forward outlook
- In year one you build about $8k of equity ($837 loan paydown + $7k appreciation (5.8% local appreciation)).
- Escambia County population projected to shrink 10% by 2050 — rents likely to lag national; underwrite the cash flow, not the appreciation.
- At projected returns (5.8% appreciation + 3.0% rent growth), your $34k cash investment doubles in ~4 years — after that, you're playing with house money.
- By year 5, paydown + projected appreciation supports a ~$35k cash-out refi (75% LTV) — recoverable capital for the next deal without selling this one.
Negotiation context
- Only 9 days on market — expect competitive offers; lowballing is unlikely to land.
Risks & watch-outs
- Climate carrying-cost: severe wind risk, 99% chance of damaging wind over 30y; extreme-heat days projected 7→20/yr by 2055 (HVAC capex compounding) — expect insurance premiums to compound above CPI over the hold.
Questions for the listing agent
- Is there a deadline driving the sale (1031 exchange, divorce, estate, relocation)? That informs how much negotiation room exists.
- Schools are D-rated, which usually means shorter tenancies and higher turnover. Who's the typical renter profile here, and what's been the actual vacancy rate?
- Crime grade is F in this area — have there been break-ins, vandalism, or insurance claims at this property in the last 3 years? What carrier currently insures it and at what premium?
- The area grade is low — what's the realistic commute time and amenity access for the typical tenant pool here? Any planned neighborhood developments (good or bad) we should know about?
- What's the average days-on-market for RENTAL listings here right now (not sales)? A rising rental-DOM trend means longer vacancies and softer asking-rent achievability than the comps imply.
- What's the recent tenant-quality profile in this submarket — average credit score on applications, eviction rate, late-payment / NSF rate, and stable-employment percentage? A property-management company in the area should have these aggregated.
- How much new for-sale + rental construction is in the pipeline within 1–3 miles? Heavy new supply typically softens prices + rents 12–24 months out; constrained supply supports both.
Investment metrics
- 1% rule
- 0.92% ✗
- Cap rate
- 7.89%
- Cash-on-cash
- 5.72%
- DSCR
- 1.25
- GRM
- 9.1
CMA / ARV
- ARV (on-the-fly)
- $104,650
- Comps found
- 2
Show comp detail 2 sales within ~0.75 mi
| Address | Dist | Beds/Ba | Sqft | Sold | Price | $/sf | Match |
|---|---|---|---|---|---|---|---|
| 600 Highway 113 | 0.00mi | 3/2.0 | 1,774 (+10%) | 1mo | $115,000 | $65 | 78 |
| 211 Pecan Leaf Ln | 0.16mi | 3/1.0 | 1,716 (+7%) | 7mo | $19,900 | $12 | 76 |
Match score weights: distance 35% · size 25% · config 20% · recency 20%. Top-matched comps best support the ARV.
Projected returns pro-forma
5.81% appreciation · 3.0% rent growth · sell at horizon
- IRR
- 19.6%
- Equity multiple
- 2.29×
- Total profit
- $43,816
- Equity at exit
- $74,632
- IRR
- 19.0%
- Equity multiple
- 4.57×
- Total profit
- $121,087
- Equity at exit
- $134,121
Cash invested: $33,880 (down + closing). Projections, not guarantees.
Landlord ↔ Tenant lean methodology
- Overall (STATE)
- 90 Strongly Landlord-Friendly
- State Alabama
- 90 Strongly Landlord-Friendly · R+15
- County
- — inherits STATE
- City
- — inherits STATE
ZIP-level market 36441
- Home prices YoY
- 3.5%
- Active inventory
- 19
- Price-to-rent
- 9.1×
Monthly cashflow live
- Estimated rent
- $1,112 medium interval (Pro) →
- Mortgage (P&I)
- −$635
- Tax from tax record
- −$32 /mo · $388/yr
- Insurance
- −$50
- HOA
- −$0
- Vacancy / Maint / Mgmt
- −$234
- Net cashflow
- $161
Break-even live
UW: 25.0% down · 7.5% · 30yr · 1.5% tax · 5.0% vac · 8.0% maint · 8.0% mgmt
Financing live
Cash to close
- Down payment
- $30,250
- Closing costs
- $3,630
- Reserves months
- —
- Total cash needed
- —
Loan-product check · same deal, 3 products live
Conventional
25% down · 7.5% · 30yr
- Down + closing
- —
- Monthly P&I
- —
- Monthly cashflow
- —
- DSCR
- —
- Eligible?
- —
Personal DTI + credit; lowest rate.
DSCR
20% down · 8.5% · 30yr
- Down + closing
- —
- Monthly P&I
- —
- Monthly cashflow
- —
- DSCR
- —
- Eligible?
- —
No personal income docs; deal must DSCR.
Hard money
10% down · 12.0% · 12mo
- Down + closing
- —
- Monthly P&I
- —
- Monthly cashflow
- —
- DSCR
- —
- Eligible?
- —
Short-term bridge; refi at stabilization.
Listing history 2 events
-
2026-04-23status Pending
-
2026-04-14$121,000 Active
ⓘ Source: listings_history table (triggers on properties + properties_extension) + one-shot
backfill from property_details.listing_events for pre-trigger history.
Tax reassessment forecast AL · Resets to sale price
- Current annual tax
- $388 · $32/mo
- Projected year-2 tax
- $496 · $41/mo
- Expected delta
- +$108/yr (+$9/mo · 27.7%)
ⓘ Screening estimate from a state-policy table — verify with the county assessor before closing.
Climate risk First Street
- Flood 1/10 Low FEMA zone X (unshaded) · 0% chance over 30 yrs
- Wildfire 3/10 Moderate
- Heat 8/10 Severe 7 d/yr ≥107°F today · 20 d/yr by 30 yrs out
- Wind 9/10 Extreme 99% chance of damaging wind over 30 yrs
- Air quality 1/10 Low 0 unhealthy d/yr today · 0 by 30 yrs out
Nearby sold comps map
Loading sold comps map…
Walkable amenities ~0.75 mi
Loading nearby amenities…
Taxation est. · year 1
- Rental income
- $13,349
- − Mortgage interest
- −$6,778
- − Property taxes
- −$388
- − Insurance
- −$605
- − Repairs & maintenance
- −$1,068
- − Management
- −$1,068
- − Depreciation
- −$3,520
- Taxable loss
- −$78
- Est. tax savings @ 24.0%
- +$19
- After-tax cash flow
- $1,956/yr
For passive investors: Depreciation is non-cash, so a rental often shows a tax loss while cash-flowing — sheltering income. Rental losses are passive: they offset passive income freely, and up to $25,000/yr can offset ordinary (W-2) income if you actively participate and your MAGI is under $100k (phasing out to $0 by $150k); unused losses carry forward. On sale, claimed depreciation is recaptured at up to 25%, and gains may owe capital-gains tax (a 1031 exchange can defer both). Figures are a year-1 estimate at your 24.0% rate — not tax advice; consult a CPA.
Schools (NCES district)
- District
- Escambia County
- NCES district ID
- 0101350
- Math proficiency
- 17% ▼ -27.00%
- Reading proficiency
- 39% ▼ -4.00%
- Median HH income
- $31,905
- Composite
- 22.73/100
- National rank
- #8036
- State rank
- #83 of 129 in AL
Livability — Flomaton
- Score
- 55/100
- State rank
- #446
- US rank
- #23537
Category grades
Schools grade is shown separately in the Schools card above.
Census & demographics
- Census place
- Flomaton, AL
- Population (ZIP)
- 3,438
Population outlook (Escambia County) Hauer SSP2
- Today (2025)
- 36,683 people
- By 2030
- 35,844 · -2.3%
- By 2040
- 34,393 · -6.2%
- By 2050
- 33,109 · -9.7%
- By 2075
- 28,305 · -22.8%
- By 2100
- 21,091 · -42.5%
Race, ethnicity, and origin ACS 2023
- Neighborhood character
- Predominantly White (73%)
- Race & ethnicity
- White 73% Black 20% Two or more races 5% Native American 2%
- Common ancestry
- Serbian 1% Danish 1% Lithuanian 1%
- Foreign-born
- 0%
- Languages at home
- 99% English-only · Spanish 1%
Political lean MEDSL · Escambia
- 2024 margin
- Solid R (+46.4) · D 26.6% · R 72.9%
- 2008→2024 swing
- -17.8pp toward R · 2008: -28.5pp · 2024: -46.4pp
- All cycles
- 2024: R+46.4 2020: R+37.4 2016: R+36.7 2012: R+25.5 2008: R+28.5
Not yet ingested
- Civics
- —
Market trends
- HPI YoY
- ▲ 5.81%
- Current HPI
- 170.3166
- Rent YoY
- —
- Metro
- —
- State GDP YoY
- ▲ 2.94%
- F500 in state
- 4
Industry mix (Fortune 500 HQ in AL)
| Industry | F500 HQs | Revenue |
|---|---|---|
| Financial Services | 1 | $8B |
|
||
| Healthcare | 1 | $5B |
|
||
Price history
2 events — show timeline
- 2026-04-23 Pending — BCAR
- 2026-04-14 Listed $121,000 BCAR
Property tax history
-0.0%/yrLatest (2019): $388 · -0.5% YoY. Source: county tax records.
Cash-flow waterfall
monthlySold comps — $/sqft
last 12 mo · ≤1 miLoading sold comps…