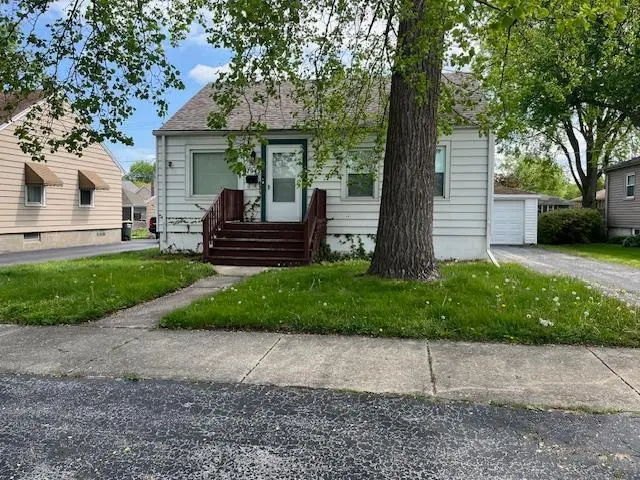
17943 Ridgewood Ave · Lansing, IL
Flood risk 1/10 · Minimal
- FEMA flood zone
- X (unshaded)
- Chance of flooding over 30 yrs
- 0.0%
- Est. flood insurance / yr
- $473 – $860
Fire risk 3/10 · Minor
- Est. fire insurance / yr
- $804 – $1,492
Heat risk 3/10 · Minor
- Hot days now (above 102°F)
- 7 days/yr
- Hot days in 30 yrs
- 15 days/yr
Wind risk 2/10 · Minimal
- Chance of severe wind over 30 yrs
- 0.0%
Air-quality risk 4/10 · Minor
- Unhealthy air days now
- 5 days/yr
- Unhealthy air days in 30 yrs
- 6 days/yr
Risk factors via First Street. Map © Google.
Why this score? — see what drove the D- grade
The composite is a weighted blend of 9 inputs, each scored 0–100. Each bar is that input's sub-score; the figure is the points it added to the 100-point composite (weight × sub-score).
- Cash flow +15.1/30.0
- ARV discount +5.9/15.0
- DSCR +4.6/10.0
- 1% rule +4.2/10.0
- Livability +3.7/5.0
- Rent growth +2.5/5.0
- Condition / age +2.5/5.0
- Schools +1.0/10.0
- Appreciation +0.0/10.0
$159,900
🖨 Deal sheet 📄 Offer letter ✓ Due diligence
Listing remarks MLS
Selling as-is. Not a full rehab, but needs TLC. Not a short sale or foreclosure. Listing agent has ownership interest.
Key facts
- 3,136 sq ft lot
- Garage
- Built 1949
Property features AI
Finance
- Other: Fee simple ownership; Property not currently leased; Possession at closing
- HOA & community: No master association fee required
Exterior
- Parking: Detached owned garage (1 garage space, 1 parking space total)
- Utilities: Public water; Public sewer
- Home design: Detached single-family home; One-story
- Construction: Built approximately 71–80 years ago; Home built before 1978
- Exterior features: Aluminum siding; Lot dimensions approximately 24 x 124; Lot smaller than 0.25 acre
Interior
- Kitchen: Kitchen on the main level (approx. 11 x 9)
- Bedrooms: 2 bedrooms (both on the main level); Master bedroom on the main level (approx. 11 x 10); Second bedroom on the main level (approx. 10 x 10)
- Bathrooms: 1 full bathroom
- Heating & cooling: Natural gas forced-air heating; Central air conditioning
- Interior features: Unfinished full basement; 4 total rooms
- Laundry & utility: Basement laundry room (approx. 5 x 7)
Neighborhood map
What this means for you Summary
Snapshot
- This is a 2-bed/1.0-bath single-family listed at $160k.
Deal economics
- At list price, monthly cash flow is $53 ($636/yr) — positive.
- The deal already cash-flows at list — no discount required.
- To meet the 1% rule (rent ≥ 1% of price), the offer needs to be $146k (8.5% below list).
- Recommended offer: $146k (8.5% below list) — sets the bar for 1% rule.
Location & tenants
- Location reads 73/100 on livability (#296 in IL) — a middle-class / working-renter tenant base. Strengths: commute A+, cost of living A+, housing A+; Watch: schools D+, crime D+, health & safety D+.
- Thornton Fractional Twp Hsd 215 (suburban): math 9% / reading 13% proficiency, ranked #563 of 620 in IL (top 91%) — low school quality limits family demand, transient renter base, plan for 1-2y turnover.
- Market conditions: 132 active listings in the ZIP; 16 comparable units currently listed for rent nearby; rentals at typical pace (median 18d on market — plan ~3-4 weeks tenant-placement turnaround); solid renter incomes; 6,272 units permitted in Cook County in 2024 (4,658 in 5+ unit buildings).
Forward outlook
- Local home prices are declining (-3.0%/yr); year-one equity from $1k of loan paydown is wiped out by about $5k of value loss. Plan a longer hold.
Negotiation context
- It's been on market 42 days — a 3% lower offer ($155k) is reasonable based on typical stale-listing flexibility.
- 5 sale attempts since 17y ago with the ask held roughly flat each time — persistent listings suggest the price (not the market) is what's stuck; bring a comps-based counter.
- Current owner paid $85k; list at $160k implies a 88% gain — meaningful room to come down on a strong offer.
Risks & watch-outs
- Watch-outs: built in 1949 — expect roof / HVAC / electrical / plumbing capex.
Questions for the listing agent
- It's been on market 42 days. Have you received any prior offers? Is the seller open to a 8% concession, seller financing, or rate buy-down credit?
- Built in 1949 — when were the roof, HVAC, electrical panel, plumbing, and water heater last replaced?
- Is there a deadline driving the sale (1031 exchange, divorce, estate, relocation)? That informs how much negotiation room exists.
- Schools are D-rated, which usually means shorter tenancies and higher turnover. Who's the typical renter profile here, and what's been the actual vacancy rate?
- Crime grade is D in this area — have there been break-ins, vandalism, or insurance claims at this property in the last 3 years? What carrier currently insures it and at what premium?
- The area grade is low — what's the realistic commute time and amenity access for the typical tenant pool here? Any planned neighborhood developments (good or bad) we should know about?
- What's the average days-on-market for RENTAL listings here right now (not sales)? A rising rental-DOM trend means longer vacancies and softer asking-rent achievability than the comps imply.
- What's the recent tenant-quality profile in this submarket — average credit score on applications, eviction rate, late-payment / NSF rate, and stable-employment percentage? A property-management company in the area should have these aggregated.
- How much new for-sale + rental construction is in the pipeline within 1–3 miles? Heavy new supply typically softens prices + rents 12–24 months out; constrained supply supports both.
Investment metrics
- 1% rule
- 0.92% ✗
- Cap rate
- 6.69%
- Cash-on-cash
- 1.42%
- DSCR
- 1.06
- GRM
- 9.1
CMA / ARV
- ARV (on-the-fly)
- $154,440
- Comps found
- 12
Show comp detail 12 sales within ~0.75 mi
| Address | Dist | Beds/Ba | Sqft | Sold | Price | $/sf | Match |
|---|---|---|---|---|---|---|---|
| 17803 Exchange Ave | 0.37mi | 3/1.0 (+1) | 784 (+0%) | 5mo | $155,000 | $198 | 72 |
| 18251 Oakwood Ave | 0.39mi | 2/1.0 | 760 (-3%) | 13mo | $79,900 | $105 | 67 |
| 17617 Burnham Ave | 0.53mi | 2/1.0 | 812 (+4%) | 2mo | $130,100 | $160 | 66 |
| 17831 Walter St | 0.41mi | 2/1.0 | 854 (+10%) | 1mo | $185,900 | $218 | 65 |
| 17642 Walter St | 0.52mi | 3/1.0 (+1) | 800 (+3%) | 12mo | $170,000 | $213 | 56 |
| 2830 Ridge Rd | 0.31mi | 2/1.0 | 840 (+8%) | 20mo | $98,000 | $117 | 56 |
| 3127 179th St | 0.24mi | 2/1.0 | 868 (+11%) | 19mo | $168,500 | $194 | 54 |
| 2950 Bernice Rd | 0.73mi | 3/1.5 (+1) | 788 (+1%) | 5mo | $159,000 | $202 | 53 |
| 2525 183rd St | 0.65mi | 2/2.0 | 768 (-2%) | 15mo | $127,000 | $165 | 51 |
| 18273 Greenbay Ave | 0.49mi | 2/2.0 | 830 (+6%) | 14mo | $97,500 | $117 | 50 |
| 3445 Adams St | 0.64mi | 2/1.0 | 768 (-2%) | 22mo | $195,000 | $254 | 49 |
| 17821 Glen Oak Ave | 0.65mi | 2/1.0 | 714 (-8%) | 15mo | $144,200 | $202 | 43 |
Match score weights: distance 35% · size 25% · config 20% · recency 20%. Top-matched comps best support the ARV.
Projected returns pro-forma
-3.0% appreciation · 3.0% rent growth · sell at horizon
- IRR
- -14.0%
- Equity multiple
- 0.50×
- Total profit
- $-22,512
- Equity at exit
- $23,842
- IRR
- -5.2%
- Equity multiple
- 0.66×
- Total profit
- $-15,169
- Equity at exit
- $13,825
Cash invested: $44,772 (down + closing). Projections, not guarantees.
Landlord ↔ Tenant lean methodology
- Overall (STATE)
- 43 Moderately Tenant-Leaning
- State Illinois
- 43 Moderately Tenant-Leaning · D+7
- County
- — inherits STATE
- City
- — inherits STATE
ZIP-level market 60438
- Active inventory
- 132
- Price-to-rent
- 9.1×
Monthly cashflow live
- Estimated rent
- $1,464 high interval (Pro) →
- Mortgage (P&I)
- −$839
- Tax from tax record
- −$198 /mo · $2,377/yr
- Insurance
- −$67
- HOA
- −$0
- Vacancy / Maint / Mgmt
- −$307
- Net cashflow
- $53
Break-even live
UW: 25.0% down · 7.5% · 30yr · 1.5% tax · 5.0% vac · 8.0% maint · 8.0% mgmt
Financing live
Cash to close
- Down payment
- $39,975
- Closing costs
- $4,797
- Reserves months
- —
- Total cash needed
- —
Loan-product check · same deal, 3 products live
Conventional
25% down · 7.5% · 30yr
- Down + closing
- —
- Monthly P&I
- —
- Monthly cashflow
- —
- DSCR
- —
- Eligible?
- —
Personal DTI + credit; lowest rate.
DSCR
20% down · 8.5% · 30yr
- Down + closing
- —
- Monthly P&I
- —
- Monthly cashflow
- —
- DSCR
- —
- Eligible?
- —
No personal income docs; deal must DSCR.
Hard money
10% down · 12.0% · 12mo
- Down + closing
- —
- Monthly P&I
- —
- Monthly cashflow
- —
- DSCR
- —
- Eligible?
- —
Short-term bridge; refi at stabilization.
Rent comps 16 comps
| Address | Beds | Baths | Sqft | Rent | $/sqft | DOM | Units | Dist |
|---|---|---|---|---|---|---|---|---|
| 3020 178th St Apt C7 Lansing, IL | 2.0 | 1.0 | 900 | $1,550 | $1.72 | 24d | 1 | 0.24mi |
| 3020 178th St Unit C1 Lansing, IL | 2.0 | 1.0 | 900 | $1,550 | $1.72 | 1d | 1 | 0.24mi |
| 17723 Exchange Ave Unit 17723-1N Lansing, IL | 3.0 | 2.0 | 1100 | $1,800 | $1.64 | 1d | 1 | 0.43mi |
| 2441 Indiana Ave Lansing, IL | 1.0 | 1.0 | 600 | $975 | $1.62 | 3d | 1 | 0.65mi |
| 2441 Indiana Ave Unit 2N Lansing, IL | 1.0 | 1.0 | 600 | $975 | $1.62 | 12d | 1 | 0.65mi |
| 3023 Bernice Rd Apt 2S Lansing, IL | 3.0 | 1.0 | 1000 | $1,600 | $1.60 | 1d | 1 | 0.70mi |
| 3069 Bernice Rd Apt 2S Lansing, IL | 3.0 | 1.0 | 950 | $1,535 | $1.62 | 2d | 1 | 0.71mi |
| 3069 Bernice Rd Apt 2N Lansing, IL | 3.0 | 1.0 | 950 | $1,535 | $1.62 | 20d | 1 | 0.71mi |
| 18361 Glen Oak Ave Unit 1E Lansing, IL | 2.0 | 1.0 | 900 | $1,400 | $1.56 | 24d | 1 | 0.80mi |
| 18335 Sherman St Unit 3 Lansing, IL | 3.0 | 1.0 | 1000 | $1,700 | $1.70 | 1d | 1 | 0.85mi |
| 18381 Torrence Ave Lansing, IL | 2.0 | 1.0 | 900 | $1,300 | $1.44 | 24d | 1 | 0.88mi |
| 18440 Torrence Ave Lansing, IL | 2.0 | 1.0 | 800 | $1,200 | $1.50 | 24d | 1 | 0.97mi |
| 18550 Torrence Ave #25 Lansing, IL | 2.0 | 1.0 | 1000 | $1,300 | $1.30 | 11d | 1 | 1.05mi |
| 17754 Rosewood Dr Unit 1N Lansing, IL | 2.0 | 1.0 | 850 | $1,370 | $1.61 | 24d | 1 | 1.18mi |
| 3649 173rd Ct Lansing, IL | 2.0 | 2.0 | 972 | $1,357 | $1.40 | 24d | 1 | 1.19mi |
| 17640 Rosewood Dr Unit 2A Lansing, IL | 2.0 | 1.0 | 950 | $1,475 | $1.55 | 17d | 1 | 1.20mi |
Listing history 25 events
-
2026-06-18days on market $159,900 Active 42 DOM
-
2026-06-17days on market $159,900 Active 41 DOM
-
2026-06-16days on market $159,900 Active 40 DOM
-
2026-06-15days on market $159,900 Active 39 DOM
-
2026-06-13days on market $159,900 Active 37 DOM
-
2026-06-09days on market $159,900 Active 33 DOM
-
2026-06-08days on market $159,900 Active 32 DOM
-
2026-06-07days on market $159,900 Active 31 DOM
-
2026-06-04days on market $159,900 Active 28 DOM
-
2026-06-03days on market $159,900 Active 27 DOM
-
2026-06-02days on market $159,900 Active 26 DOM
-
2026-06-01days on market $159,900 Active 25 DOM
-
2026-05-31days on market $159,900 Active 24 DOM
-
2026-05-07$159,900 Active
-
2025-12-31historical
-
2025-02-26Active
-
2021-09-03soldstatus $85,000 Closed 120-char remark
Show marketing remark (120 chars)
Selling as-is. Not a full rehab, but needs TLC. Not a short sale or foreclosure. Listing agent has ownership interest.
-
2021-08-10status Active Under Contract 120-char remark
Show marketing remark (120 chars)
Selling as-is. Not a full rehab, but needs TLC. Not a short sale or foreclosure. Listing agent has ownership interest.
-
2021-07-29$99,900 Active 120-char remark
Show marketing remark (120 chars)
Selling as-is. Not a full rehab, but needs TLC. Not a short sale or foreclosure. Listing agent has ownership interest.
-
2009-12-13historical
-
2009-12-12New
-
2009-12-12historical
-
2009-11-23price Price Change
-
2009-09-11price
-
2009-09-11New
ⓘ Source: listings_history table (triggers on properties + properties_extension) + one-shot
backfill from property_details.listing_events for pre-trigger history.
Tax reassessment forecast IL · Partial reset (capped growth)
- Current annual tax
- $2,377 · $198/mo
- Projected year-2 tax
- $3,003 · $250/mo
- Expected delta
- +$626/yr (+$52/mo · 26.3%)
ⓘ Screening estimate from a state-policy table — verify with the county assessor before closing.
Climate risk First Street
- Flood 1/10 Low FEMA zone X (unshaded) · 0% chance over 30 yrs
- Wildfire 3/10 Moderate
- Heat 3/10 Moderate 7 d/yr ≥102°F today · 15 d/yr by 30 yrs out
- Wind 2/10 Low 0% chance of damaging wind over 30 yrs
- Air quality 4/10 Moderate 5 unhealthy d/yr today · 6 by 30 yrs out
Nearby sold comps map
Loading sold comps map…
Walkable amenities ~0.75 mi
Loading nearby amenities…
Taxation est. · year 1
- Rental income
- $17,564
- − Mortgage interest
- −$8,957
- − Property taxes
- −$2,377
- − Insurance
- −$800
- − Repairs & maintenance
- −$1,405
- − Management
- −$1,405
- − Depreciation
- −$4,652
- Taxable loss
- −$2,032
- Est. tax savings @ 24.0%
- +$488
- After-tax cash flow
- $1,124/yr
For passive investors: Depreciation is non-cash, so a rental often shows a tax loss while cash-flowing — sheltering income. Rental losses are passive: they offset passive income freely, and up to $25,000/yr can offset ordinary (W-2) income if you actively participate and your MAGI is under $100k (phasing out to $0 by $150k); unused losses carry forward. On sale, claimed depreciation is recaptured at up to 25%, and gains may owe capital-gains tax (a 1031 exchange can defer both). Figures are a year-1 estimate at your 24.0% rate — not tax advice; consult a CPA.
Schools (NCES district)
- District
- Thornton Fractional Twp Hsd 215
- NCES district ID
- 1738940
- Math proficiency
- 9% ▼ -3.00%
- Reading proficiency
- 13% ▼ -3.00%
- Median HH income
- $48,207
- Composite
- 10.27/100
- National rank
- #9793
- State rank
- #563 of 620 in IL
Livability — Lansing
- Score
- 73/100
- State rank
- #296
- US rank
- #5698
Category grades
Schools grade is shown separately in the Schools card above.
Census & demographics
- Census place
- Lansing, IL
- County
- Cook County · 4,486,803 people
- City population
- 28,806
- Metro
- Chicago-Naperville-Elgin, IL-IN-WI
- Population (ZIP)
- 28,806
- Household income
- $75,681
- Rent vs Own
- Severe rent burden
- 830.0
Population outlook (Cook County) Hauer SSP2
- Today (2025)
- 5,347,519 people
- By 2030
- 5,357,703 · +0.2%
- By 2040
- 5,324,924 · -0.4%
- By 2050
- 5,230,762 · -2.2%
- By 2075
- 4,785,735 · -10.5%
- By 2100
- 4,188,836 · -21.7%
Race, ethnicity, and origin ACS 2023
- Neighborhood character
- Diverse neighborhood (Simpson 0.65)
- Race & ethnicity
- Black 51% White 25% Hispanic / Latino 18% Two or more races 7% Asian 2%
- Hispanic origin (detail)
- Mexican 15%
- Common ancestry
- Romanian 5% Iranian 3% Lithuanian 1%
- Foreign-born
- 10% · Canada
- Languages at home
- 83% English-only · Spanish 12% Vietnamese 1% French/Haitian/Cajun 1%
Political lean MEDSL · Cook
- 2024 margin
- Solid D (+42.0) · D 70.4% · R 28.4% · Other 1.2%
- 2008→2024 swing
- -11.4pp toward R · 2008: 53.4pp · 2024: 42.0pp
- All cycles
- 2024: D+42.0 2020: D+50.3 2016: D+53.0 2012: D+49.4 2008: D+53.4
Not yet ingested
- Civics
- —
Market trends
- HPI YoY
- ▼ -151.65%
- Current HPI
- 210.3398
- Rent YoY
- —
- Metro
- Chicago-Naperville-Elgin, IL-IN-WI
- State GDP YoY
- ▲ 1.59%
- F500 in state
- 60
Industry mix (Fortune 500 HQ in IL)
| Industry | F500 HQs | Revenue |
|---|---|---|
| Insurance | 4 | $201B |
|
||
| Consumer Goods | 4 | $87B |
|
||
| Industrial Machinery | 3 | $64B |
|
||
| Healthcare | 2 | $55B |
|
||
| Retail / Pharmacy | 1 | $148B |
|
||
| Agriculture / Food | 1 | $86B |
|
||
Price history
+60.1% since first listed12 events — show timeline
- 2026-05-07 Listed $159,900 MRED as Distributed by MLS Grid
- 2025-12-31 Listing Removed — MRED as Distributed by MLS Grid
- 2025-02-26 Listed — MRED as Distributed by MLS Grid
- 2021-09-03 Sold (MLS) $85,000 MRED as Distributed by MLS Grid
- 2021-08-10 Pending — MRED as Distributed by MLS Grid
- 2021-07-29 Listed $99,900 MRED as Distributed by MLS Grid
- 2009-12-13 Listing Removed — MRED as Distributed by MLS Grid
- 2009-12-12 Listed — MRED as Distributed by MLS Grid
- 2009-12-12 Listing Removed — MRED as Distributed by MLS Grid
- 2009-11-23 Price Changed — MRED as Distributed by MLS Grid
- 2009-09-11 Price Changed — MRED as Distributed by MLS Grid
- 2009-09-11 Listed — MRED as Distributed by MLS Grid
Property tax history
+3.6%/yrLatest (2023): $2,377 · -2.1% YoY. Source: county tax records.
Cash-flow waterfall
monthlySold comps — $/sqft
last 12 mo · ≤1 miLoading sold comps…