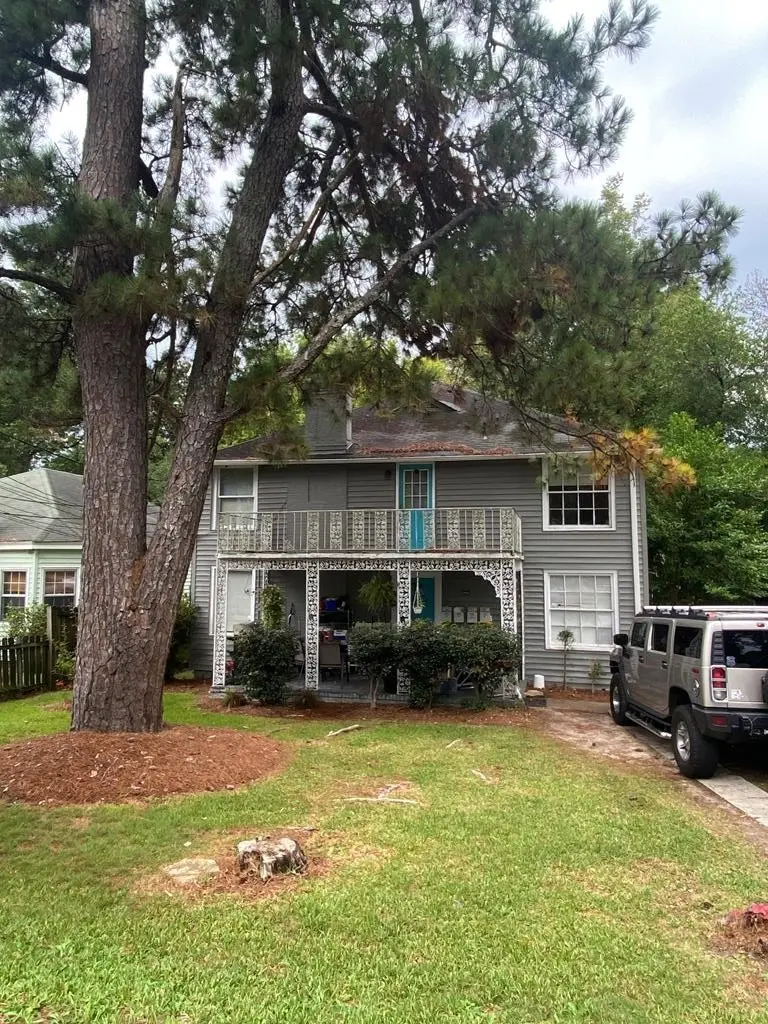
 Fourplex
2257 Camille Dr · Columbus, GA
Flood risk No data
- FEMA flood zone
- —
- Chance of flooding over 30 yrs
- —
- Est. flood insurance / yr
- —
Fire risk No data
- Est. fire insurance / yr
- —
Heat risk No data
- Hot days now (above threshold)
- —
- Hot days in 30 yrs
- —
Wind risk No data
- Chance of severe wind over 30 yrs
- —
Air-quality risk No data
- Unhealthy air days now
- —
- Unhealthy air days in 30 yrs
- —
Risk factors via First Street. Map © Google.
Why this score? — see what drove the C+ grade
The composite is a weighted blend of 9 inputs, each scored 0–100. Each bar is that input's sub-score; the figure is the points it added to the 100-point composite (weight × sub-score).
- Cash flow +30.0/30.0
- 1% rule +10.0/10.0
- DSCR +10.0/10.0
- Rent growth +3.7/5.0
- Livability +3.2/5.0
- Schools +2.2/10.0
- Condition / age +1.0/5.0
- ARV discount +0.0/15.0
- Appreciation +0.0/10.0
$250,000
🖨 Deal sheet 📄 Offer letter ✓ Due diligence
Multi-family units
County records classify this as Multi-Family (2-4 Unit). Listing-text estimate: 4 units. confirmed
Listing remarks MLS
Excellent investment opportunity with this Quadraplex consisting of four units, (1) 2 BR/1 BA and (3) 1 BR/1 BA units; water included in the rent. Located in Midtown Columbus. Convenient to area restaurants, shopping, parks, and some of Columbus' most sought after schools. Please do not disturb tenant. Contact agent regarding all inquiries.
Key facts
- 0.25 acre lot
- Listed 78 days
Neighborhood map
What this means for you Summary
Snapshot
- This is a 1×2.0bd/1.0ba + 3×1.0bd/1.0ba units multifamily listed at $250k. Condition is rated poor.
Deal economics
- At list price, monthly cash flow is $1k ($17k/yr) — positive. Per door: $356/mo.
- The deal already cash-flows at list — no discount required.
- Meets the 1% rule at list price ($4k rent vs $250k).
- Recommended offer: $235k (6.0% below list) — sets the bar for market timing.
- Cap rate 13.1% vs local median 4.7% in Columbus — top-decile yield for the area; either an underpriced asset or a hidden risk that comps aren't pricing in. Stress-test before assuming the spread holds.
Location & tenants
- Location reads 64/100 on livability (#254 in GA) — a middle-class / working-renter tenant base. Strengths: cost of living A+, housing A+, health & safety B; Watch: amenities D+, schools F, crime F.
- Muscogee County (urban): math 21% / reading 30% proficiency, ranked #120 of 174 in GA (top 69%) — low school quality limits family demand, transient renter base, plan for 1-2y turnover; 61% free/reduced lunch — lower-income household profile, screen leases tightly.
- Market conditions: Rents rising fast (+4.8%/yr); 118 active listings in the ZIP; lower-income renter base — watch delinquency; 291 units permitted in Muscogee County in 2024 (30 in 5+ unit buildings).
- At $3,865/mo this rent would consume 103% of the median local household income ($45k/yr) (locally 1003% of renters already pay >50% of income on rent) — very limited rent-growth headroom before tenants either downsize or default.
Forward outlook
- Local home prices are declining (-3.0%/yr); year-one equity from $2k of loan paydown is wiped out by about $8k of value loss. Plan a longer hold.
- Muscogee County population projected at +15% by 2050 — modest demand growth; plan on rents tracking national, not racing it.
- At projected returns (-3.0% appreciation + 4.8% rent growth), your $70k cash investment doubles in ~5 years — after that, you're playing with house money.
Negotiation context
- It's been on market 78 days — a 6% lower offer ($235k) is reasonable based on typical stale-listing flexibility.
- 2 sale attempts since 5y ago; this cycle's ask has dropped $100k (29%) from the opening price — seller is motivated, your offer sets the floor, not the list.
Risks & watch-outs
- Watch-outs: built in 1938 — expect roof / HVAC / electrical / plumbing capex.
Questions for the listing agent
- It's been on market 78 days. Have you received any prior offers? Is the seller open to a 6% concession, seller financing, or rate buy-down credit?
- Can we see the unit-by-unit rent roll, current vacancy, and any below-market leases? What's the average tenancy length?
- What capital expenditures (roof, boiler, parking lot, exteriors) have been made in the last 5 years, and what's planned in the next 2?
- Have any recent inspections been done? Can we get a copy of the seller's disclosures and any deferred-maintenance estimates?
- Built in 1938 — when were the roof, HVAC, electrical panel, plumbing, and water heater last replaced?
- Why hasn't it sold? Are there any deal-killer items the seller is aware of (foundation, flood, title, zoning, code violations)?
- Is there a deadline driving the sale (1031 exchange, divorce, estate, relocation)? That informs how much negotiation room exists.
- Schools are F-rated, which usually means shorter tenancies and higher turnover. Who's the typical renter profile here, and what's been the actual vacancy rate?
- Crime grade is F in this area — have there been break-ins, vandalism, or insurance claims at this property in the last 3 years? What carrier currently insures it and at what premium?
- What's the average days-on-market for RENTAL listings here right now (not sales)? A rising rental-DOM trend means longer vacancies and softer asking-rent achievability than the comps imply.
- What's the recent tenant-quality profile in this submarket — average credit score on applications, eviction rate, late-payment / NSF rate, and stable-employment percentage? A property-management company in the area should have these aggregated.
- How much new apartment / multifamily construction is in the pipeline within 1–3 miles? Heavy new supply (>2% of stock underway) typically softens rents 12–24 months out; light construction supports rent growth.
Investment metrics
- 1% rule
- 1.55% ✓
- Cap rate
- 13.13%
- Cash-on-cash
- 24.44%
- DSCR
- 2.09
- GRM
- 5.4
CMA / ARV
- ARV (median comp)
- $211,192
- List price
- $250,000
- Delta
- 18.38%
- Verdict
- OVERPRICED
- Comps
- 3 within 1.0 mi
Projected returns pro-forma
-3.0% appreciation · 4.82% rent growth · sell at horizon
- IRR
- 19.7%
- Equity multiple
- 1.82×
- Total profit
- $57,476
- Equity at exit
- $37,276
- IRR
- 29.2%
- Equity multiple
- 3.82×
- Total profit
- $197,626
- Equity at exit
- $21,615
Cash invested: $70,000 (down + closing). Projections, not guarantees.
Landlord ↔ Tenant lean methodology
- Overall (STATE)
- 90 Strongly Landlord-Friendly
- State Georgia
- 90 Strongly Landlord-Friendly · R+3
- County
- — inherits STATE
- City
- — inherits STATE
ZIP-level market 31906
- Rents YoY
- 4.8%
- Active inventory
- 118
- Price-to-rent
- 19.8×
Monthly cashflow live
- Estimated rent
- $3,865 high interval (Pro) →
- Mortgage (P&I)
- −$1,311
- Tax from tax record
- −$213 /mo · $2,553/yr
- Insurance
- −$104
- HOA
- −$0
- Vacancy / Maint / Mgmt
- −$812
- Net cashflow
- $1,425
Break-even live
4-unit breakdown (identical units grouped — click to expand)
| Units | Beds | Baths | Est. rent |
|---|---|---|---|
| 1× unit | 2.0 | 1 | $1,051 |
| 3× units | 1.0 | 1 | $2,814 |
| #2 | 1.0 | 1 | $938 |
| #3 | 1.0 | 1 | $938 |
| #4 | 1.0 | 1 | $938 |
| Total (4 units) | $3,865 | ||
UW: 25.0% down · 7.5% · 30yr · 1.5% tax · 5.0% vac · 8.0% maint · 8.0% mgmt
Financing live
Cash to close
- Down payment
- $62,500
- Closing costs
- $7,500
- Reserves months
- —
- Total cash needed
- —
Loan-product check · same deal, 3 products live
Conventional
25% down · 7.5% · 30yr
- Down + closing
- —
- Monthly P&I
- —
- Monthly cashflow
- —
- DSCR
- —
- Eligible?
- —
Personal DTI + credit; lowest rate.
DSCR
20% down · 8.5% · 30yr
- Down + closing
- —
- Monthly P&I
- —
- Monthly cashflow
- —
- DSCR
- —
- Eligible?
- —
No personal income docs; deal must DSCR.
Hard money
10% down · 12.0% · 12mo
- Down + closing
- —
- Monthly P&I
- —
- Monthly cashflow
- —
- DSCR
- —
- Eligible?
- —
Short-term bridge; refi at stabilization.
Listing history 22 events
-
2026-06-18days on market $250,000 Active 78 DOM
-
2026-06-17days on market $250,000 Active 77 DOM
-
2026-06-16days on market $250,000 Active 76 DOM
-
2026-06-15days on market $250,000 Active 75 DOM
-
2026-06-14days on market $250,000 Active 73 DOM
-
2026-06-13days on market $250,000 Active 72 DOM
-
2026-06-10days on market $250,000 Active 70 DOM
-
2026-06-09days on market $250,000 Active 69 DOM
-
2026-06-08days on market $250,000 Active 68 DOM
-
2026-06-07days on market $250,000 Active 67 DOM
-
2026-06-05days on market $250,000 Active 64 DOM
-
2026-06-03days on market $250,000 Active 63 DOM
-
2026-06-02days on market $250,000 Active 62 DOM
-
2026-06-01days on market $250,000 Active 61 DOM
-
2026-05-31days on market $250,000 Active 60 DOM
-
2026-05-30days on market $250,000 Active 59 DOM
-
2026-04-01$350,000 Active 342-char remark
Show marketing remark (342 chars)
Excellent investment opportunity with this Quadraplex consisting of four units, (1) 2 BR/1 BA and (3) 1 BR/1 BA units; water included in the rent. Located in Midtown Columbus. Convenient to area restaurants, shopping, parks, and some of Columbus' most sought after schools. Please do not disturb tenant. Contact agent regarding all inquiries.
-
2025-11-22price $350,000
-
2021-12-02soldstatus $1,225,000
-
2021-03-04soldstatus $122,800
-
2021-03-01soldstatus $122,750
-
2021-02-01$110,000
ⓘ Source: listings_history table (triggers on properties + properties_extension) + one-shot
backfill from property_details.listing_events for pre-trigger history.
Tax reassessment forecast GA · Resets to sale price
- Current annual tax
- $2,553 · $213/mo
- Projected year-2 tax
- $2,553 · $213/mo
- Expected delta
- $0/yr ($0/mo · 0.0%)
ⓘ Screening estimate from a state-policy table — verify with the county assessor before closing.
Nearby sold comps map
Loading sold comps map…
Walkable amenities ~0.75 mi
Loading nearby amenities…
Taxation est. · year 1
- Rental income
- $46,380
- − Mortgage interest
- −$14,004
- − Property taxes
- −$2,553
- − Insurance
- −$1,250
- − Repairs & maintenance
- −$3,710
- − Management
- −$3,710
- − Depreciation
- −$7,273
- Taxable income
- $13,879
- Est. tax owed @ 24.0%
- −$3,331
- After-tax cash flow
- $13,774/yr
For passive investors: Depreciation is non-cash, so a rental often shows a tax loss while cash-flowing — sheltering income. Rental losses are passive: they offset passive income freely, and up to $25,000/yr can offset ordinary (W-2) income if you actively participate and your MAGI is under $100k (phasing out to $0 by $150k); unused losses carry forward. On sale, claimed depreciation is recaptured at up to 25%, and gains may owe capital-gains tax (a 1031 exchange can defer both). Figures are a year-1 estimate at your 24.0% rate — not tax advice; consult a CPA.
Condition & rehab AI · 0 photos
This quadplex requires extensive renovations, including kitchen and bathroom updates, to become move-in ready and significantly increase its value.
Repairs flagged
- Major kitchen appliances — Visible signs of wear and tear, possibly outdated appliances.
- Major bathroom fixtures — Visible signs of wear and tear, possibly outdated fixtures.
- Major flooring — Visible signs of wear and tear, possibly outdated flooring.
- Major interior walls — Visible signs of wear and tear, possibly outdated paint.
- Major exterior siding — Visible signs of wear and tear, possibly outdated siding.
- Major windows — Visible signs of wear and tear, possibly outdated windows.
Value-add opportunities
- Both kitchen renovation — A modern kitchen can significantly increase both resale and rental value.
- Both bathroom renovation — Upgraded bathrooms can significantly increase both resale and rental value.
- Both exterior siding and windows — Fresh siding and windows can improve curb appeal and increase both resale and rental value.
Renovation cost estimate screening
| Repair item | Severity | Est. cost |
|---|---|---|
| kitchen appliances · Visible signs of wear and tear, possibly outdated appliances. | Major | $15,000–50,000 |
| bathroom fixtures · Visible signs of wear and tear, possibly outdated fixtures. | Major | $15,000–50,000 |
| flooring · Visible signs of wear and tear, possibly outdated flooring. | Major | $15,000–50,000 |
| interior walls · Visible signs of wear and tear, possibly outdated paint. | Major | $15,000–50,000 |
| exterior siding · Visible signs of wear and tear, possibly outdated siding. | Major | $15,000–50,000 |
| windows · Visible signs of wear and tear, possibly outdated windows. | Major | $15,000–50,000 |
| Total estimated repair cost · 6 items | $90,000–300,000 |
Value-add ROI direction
- Both kitchen renovation — A modern kitchen can significantly increase both resale and rental value. ↑
- Both bathroom renovation — Upgraded bathrooms can significantly increase both resale and rental value. ↑
- Both exterior siding and windows — Fresh siding and windows can improve curb appeal and increase both resale and rental value. ↑
ⓘ Cost ranges are severity-bucket heuristics (US national rule-of-thumb). Get contractor quotes + a written scope before underwriting a rehab budget.
Schools (NCES district)
- District
- Muscogee County
- NCES district ID
- 1303870
- Math proficiency
- 21% ▼ -11.00%
- Reading proficiency
- 30% ▼ -7.00%
- Median HH income
- $41,176
- Composite
- 21.6/100
- National rank
- #8297
- State rank
- #120 of 174 in GA
Livability — Columbus
- Score
- 64/100
- State rank
- #254
- US rank
- #14102
Category grades
Schools grade is shown separately in the Schools card above.
Census & demographics
- Census place
- Columbus, GA
- County
- Muscogee County · 180,764 people
- City population
- 180,764
- Metro
- Columbus, GA-AL
- Population (ZIP)
- 20,400
- Household income
- $44,965
- Rent vs Own
- Severe rent burden
- 1003.0
Population outlook (Muscogee County) Hauer SSP2
- Today (2025)
- 216,729 people
- By 2030
- 224,504 · +3.6%
- By 2040
- 238,318 · +10.0%
- By 2050
- 249,027 · +14.9%
- By 2075
- 264,862 · +22.2%
- By 2100
- 254,786 · +17.6%
Race, ethnicity, and origin ACS 2023
- Neighborhood character
- Majority Black (64%)
- Race & ethnicity
- Black 64% White 28% Hispanic / Latino 4% Two or more races 3% Asian 1%
- Common ancestry
- Slovak 1% Lithuanian 1% Hispanic 1%
- Foreign-born
- 3% · Canada
- Languages at home
- 95% English-only · Spanish 3% Other Indo-European 1%
Political lean MEDSL · Muscogee
- 2024 margin
- Strong D (+23.4) · D 61.4% · R 38.0%
- 2008→2024 swing
- +3.7pp toward D · 2008: 19.7pp · 2024: 23.4pp
- All cycles
- 2024: D+23.4 2020: D+24.0 2016: D+18.6 2012: D+21.3 2008: D+19.7
Not yet ingested
- Civics
- —
Market trends
- HPI YoY
- ▼ -122.49%
- Current HPI
- 113.2749
- Rent YoY
- ▲ 4.82%
- Metro
- Columbus, GA-AL
- State GDP YoY
- ▲ 2.66%
- F500 in state
- 28
Industry mix (Fortune 500 HQ in GA)
| Industry | F500 HQs | Revenue |
|---|---|---|
| Paper / Packaging | 2 | $29B |
|
||
| Retail | 1 | $160B |
|
||
| Transportation / Logistics | 1 | $91B |
|
||
| Airlines | 1 | $62B |
|
||
| Consumer Goods | 1 | $47B |
|
||
| Utilities | 1 | $25B |
|
||
Price history
+218.2% since first listed6 events — show timeline
- 2026-04-01 Listed $350,000 CBOR
- 2025-11-22 Price Changed $350,000 CBOR
- 2021-12-02 Sold (Public Records) $1,225,000 Public Records
- 2021-03-04 Sold (Public Records) $122,800 Public Records
- 2021-03-01 Sold (MLS) $122,750 CBOR
- 2021-02-01 Listed $110,000 CBOR
Property tax history
+2.5%/yrLatest (2025): $2,553 · +0.0% YoY. Source: county tax records.
Cash-flow waterfall
monthlySold comps — $/sqft
last 12 mo · ≤1 miLoading sold comps…