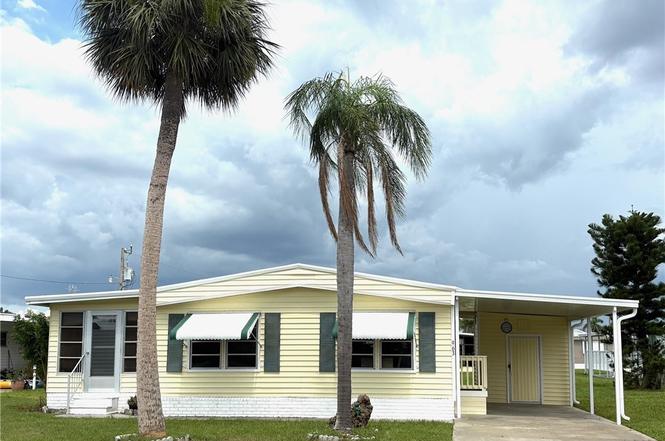
963 Idle Way Dr · North Fort Myers, FL
Flood risk 1/10 · Minimal
- FEMA flood zone
- AE
- Chance of flooding over 30 yrs
- 0.0%
- Est. flood insurance / yr
- $1,737 – $8,500
Fire risk 3/10 · Minor
- Est. fire insurance / yr
- $947 – $1,759
Heat risk 10/10 · Severe
- Hot days now (above 107°F)
- 7 days/yr
- Hot days in 30 yrs
- 27 days/yr
Wind risk 10/10 · Severe
- Chance of severe wind over 30 yrs
- 99.0%
Air-quality risk 2/10 · Minimal
- Unhealthy air days now
- 1 days/yr
- Unhealthy air days in 30 yrs
- 1 days/yr
Risk factors via First Street. Map © Google.
Why this score? — see what drove the B+ grade
The composite is a weighted blend of 9 inputs, each scored 0–100. Each bar is that input's sub-score; the figure is the points it added to the 100-point composite (weight × sub-score).
- Cash flow +30.0/30.0
- ARV discount +13.9/15.0
- DSCR +10.0/10.0
- 1% rule +8.5/10.0
- Schools +4.1/10.0
- Livability +3.7/5.0
- Rent growth +3.2/5.0
- Condition / age +2.5/5.0
- Appreciation +0.0/10.0
$84,500
🖨 Deal sheet (PDF) 📄 Offer letter ✓ Due diligence
Listing remarks
Park Share Certificate is INCLUDED in the sale of this WATERFRONT home in Lovely Lazy Days Village! This owner is INCLUDING the Park SHARE CERTIFICATE with the purchase. Owning a Share lowers the already low monthly HOA fee from $185 to $80, gives you voting rights as a Shareholder, AND you can sell the Share at will (Share Value is +/- $15,000). Enjoy an expansive WATER VIEW when you buy this immaculate DOUBLEWIDE in lovely Lazy Days Village -- PRICED RIGHT & READY TO SELL! Lovely curb appeal right across the lake, a brand NEW ROOF & CARPORT. Nearly 1000 sq ft of air-conditioned living space with 2 Bedrooms, 2 Full Bathrooms, NEW ROOF, NEW CARPORT, and sunny Florida Room! CLEAN
Key facts
- Sunny florida room
- New carport
- Storm shutters
Tags
Property features AI
Finance
- Financial info: Pets allowed conditionally (dogs and cats only, max 2, max 25 lbs; some breeds restricted)
- HOA & community: Homeowners association fee $80 monthly; Association covers management, recreation facilities, reserve fund, road maintenance and trash; Community amenities include clubhouse, pool, bocce court, pickleball, shuffleboard, picnic/barbecue areas, RV/boat storage, storage, library and management; Elevator in community; Senior community
Exterior
- Parking: Covered attached carport; 1 covered carport space
- Utilities: Public water; Public sewer; Cable available; High-speed internet available
- Home design: Manufactured home with aluminum siding; Single-story; Entry on level 1; Northwest-facing
- Construction: Metal roof
- Exterior features: Storage; Manual shutters; Across-the-road water frontage; Southeast exposure; Rectangular lot; Paved road
Interior
- Kitchen: Range; Microwave; Refrigerator
- Bedrooms: Includes guest quarters; Florida room present
- Flooring: Carpet; Vinyl
- Bathrooms: 2 full bathrooms
- Heating & cooling: Central heating (electric); Central air conditioning (electric); Ceiling fan(s)
- Interior features: Furnished; Eat-in kitchen; Pantry; Tub with shower; Walk-in closet(s); Window treatments; Single-hung and sliding windows; Window coverings
- Laundry & utility: Washer; Dryer
Neighborhood map
What this means for you Summary
Snapshot
- This is a 2-bed/2.0-bath manufactured listed at $84k.
Deal economics
- At list price, monthly cash flow is $-99 ($-1k/yr) — negative.
- To cash-flow at today's rent, offer at most $67k (20.8% below list).
- Meets the 1% rule at list price ($1k rent vs $84k).
- Recommended offer: $67k (20.8% below list) — sets the bar for cash-flow.
- Cap rate 10.9% vs local median 3.6% in North Fort Myers — top-decile yield for the area; either an underpriced asset or a hidden risk that comps aren't pricing in. Stress-test before assuming the spread holds.
Location & tenants
- Location reads 74/100 on livability (#269 in FL, #4,409 nationally) — a middle-class / working-renter tenant base. Strengths: cost of living A+, housing A+, health & safety A+; Watch: employment C-, amenities F, commute F.
- Lee (suburban): math 47% / reading 50% proficiency, ranked #42 of 73 in FL (top 58%) — families likely to look elsewhere, expect single-tenant / working-renter base with shorter leases.
- Zoned schools: Diplomat Elementary School (math 67% / reading 60%, grade B, #564 of 2,144 statewide, top 27%, 1,069 students, 56% FRL); Mariner Middle School (math 50% / reading 47%, grade C-, #274 of 571 statewide, top 50%, 1,001 students, 53% FRL); Ida S. Baker High School (math 44% / reading 47%, grade D-, #223 of 667 statewide, top 34%, 1,933 students, 39% FRL).
- Market conditions: Rents rising (+2.6%/yr); 849 active listings in the ZIP; 21 comparable units currently listed for rent nearby; rentals at typical pace (median 26d on market — plan ~3-4 weeks tenant-placement turnaround); 15,411 units permitted in Lee County in 2024 (4,686 in 5+ unit buildings).
Forward outlook
- Local home prices are declining (-3.0%/yr); year-one equity from $584 of loan paydown is wiped out by about $3k of value loss. Plan a longer hold.
- Lee County population projected at +44% by 2050 — long-run rental-demand tailwind backs the buy-and-hold thesis.
Negotiation context
- It's been on market 322 days — a 12% lower offer ($74k) is reasonable based on typical stale-listing flexibility.
- Current owner paid $54k; list at $84k implies a 58% gain — meaningful room to come down on a strong offer.
Risks & watch-outs
- Watch-outs: flood insurance adds $427/mo.
- Climate carrying-cost: in FEMA flood zone AE (mandatory federal flood insurance); severe wind risk, 99% chance of damaging wind over 30y; extreme-heat days projected 7→27/yr by 2055 (HVAC capex compounding) — expect insurance premiums to compound above CPI over the hold.
Questions for the listing agent
- What do current leases actually rent for vs. the listed asking? Can we see a recent rent roll and the last 12 months of T-12 income?
- It's been on market 322 days. Have you received any prior offers? Is the seller open to a 21% concession, seller financing, or rate buy-down credit?
- Built in 1976 — when were the roof, HVAC, electrical panel, plumbing, and water heater last replaced?
- What's the actual annual flood-insurance premium (NFIP or private), and is the property in a SFHA with mandatory coverage?
- What does the HOA fee cover, when was the last increase, and are there any pending special assessments or reserve-fund shortfalls?
- Why hasn't it sold? Are there any deal-killer items the seller is aware of (foundation, flood, title, zoning, code violations)?
- Is there a deadline driving the sale (1031 exchange, divorce, estate, relocation)? That informs how much negotiation room exists.
- What's the average days-on-market for RENTAL listings here right now (not sales)? A rising rental-DOM trend means longer vacancies and softer asking-rent achievability than the comps imply.
- What's the recent tenant-quality profile in this submarket — average credit score on applications, eviction rate, late-payment / NSF rate, and stable-employment percentage? A property-management company in the area should have these aggregated.
- How much new for-sale + rental construction is in the pipeline within 1–3 miles? Heavy new supply typically softens prices + rents 12–24 months out; constrained supply supports both.
Investment metrics
- 1% rule
- 1.35% ✓
- Cap rate
- 10.94%
- Cash-on-cash
- 16.59%
- DSCR
- 1.74
- GRM
- 6.2
CMA / ARV
- ARV (on-the-fly)
- $98,496
- Comps found
- 1
Show comp detail 1 sale within ~0.75 mi
| Address | Dist | Beds/Ba | Sqft | Sold | Price | $/sf | Match |
|---|---|---|---|---|---|---|---|
| 974 Restful Rd | 0.08mi | 2/2.0 | 960 (+11%) | 3mo | $109,575 | $114 | 75 |
Match score weights: distance 35% · size 25% · config 20% · recency 20%. Top-matched comps best support the ARV.
Projected returns pro-forma
-3.0% appreciation · 2.63% rent growth · sell at horizon
- IRR
- -25.1%
- Equity multiple
- 0.15×
- Total profit
- $-20,173
- Equity at exit
- $12,599
- IRR
- -21.9%
- Equity multiple
- -0.11×
- Total profit
- $-26,331
- Equity at exit
- $7,306
Cash invested: $23,660 (down + closing). Projections, not guarantees.
Landlord ↔ Tenant lean methodology
- Overall (STATE)
- 87 Strongly Landlord-Friendly
- State Florida
- 87 Strongly Landlord-Friendly · R+3
- County
- — inherits STATE
- City
- — inherits STATE
ZIP-level market 33917
- Home prices YoY
- -30.2%
- Rents YoY
- 2.6%
- Active inventory
- 849
- Price-to-rent
- 6.2×
Monthly cashflow live
- Estimated rent
- $1,140 high interval (Pro) →
- Mortgage (P&I)
- −$443
- Tax from tax record
- −$15 /mo · $183/yr
- Insurance
- −$35
- Flood insurance flood zone
- −$427 /mo · $5,118/yr
- HOA
- −$80
- Lot rent leased land?
- −$0
- Vacancy / Maint / Mgmt
- −$239
- Net cashflow
- $-99
Break-even live
Sensitivity live
| Price | -10% $-52 | -5% $-75 | +0% $-99 | +5% $-123 | +10% $-248 |
|---|---|---|---|---|---|
| Rent | -10% $-189 | -5% $-144 | +0% $-99 | +5% $-54 | +10% $-9 |
| Rate | -1.0pp $-57 | -0.5pp $-78 | base $-99 | +0.5pp $-121 | +1.0pp $-144 |
UW: 25.0% down · 7.5% · 30yr · 1.5% tax · 5.0% vac · 8.0% maint · 8.0% mgmt
Financing live
Cash to close
- Down payment
- $21,125
- Closing costs
- $2,535
- Reserves months
- —
- Total cash needed
- —
Loan-product check · same deal, 3 products live
Conventional
25% down · 7.5% · 30yr
- Down + closing
- —
- Monthly P&I
- —
- Monthly cashflow
- —
- DSCR
- —
- Eligible?
- —
Personal DTI + credit; lowest rate.
DSCR
20% down · 8.5% · 30yr
- Down + closing
- —
- Monthly P&I
- —
- Monthly cashflow
- —
- DSCR
- —
- Eligible?
- —
No personal income docs; deal must DSCR.
Hard money
10% down · 12.0% · 12mo
- Down + closing
- —
- Monthly P&I
- —
- Monthly cashflow
- —
- DSCR
- —
- Eligible?
- —
Short-term bridge; refi at stabilization.
Rent comps 21 comps
| Address | Beds | Baths | Sqft | Rent | $/sqft | DOM | Units | Dist |
|---|---|---|---|---|---|---|---|---|
| 4120 Pine Drop Ln North Fort Myers, FL | 3.0 | 2.0 | 957 | $1,895 | $1.98 | 26d | 1 | 0.39mi |
| 2774 Wedgewood Dr North Fort Myers, FL | 2.0 | 2.0 | 880 | $1,300 | $1.48 | 26d | 1 | 0.42mi |
| 16363 Teresa Ln North Fort Myers, FL | 2.0 | 1.0 | 1000 | $1,000 | $1.00 | 26d | 1 | 0.45mi |
| 2027 Eloise Cir North Fort Myers, FL | 2.0 | 1.0 | 822 | $1,300 | $1.58 | 5d | 1 | 0.60mi |
| 2095 Eloise Cir North Fort Myers, FL | 2.0 | 1.0 | 840 | $1,295 | $1.54 | 26d | 1 | 0.62mi |
| 28 Nyborg Ave North Fort Myers, FL | 3.0 | 2.0 | 1042 | $1,299 | $1.25 | 17d | 1 | 0.82mi |
| 947 Strongbox Ln North Fort Myers, FL | 2.0 | 2.0 | 1000 | $1,300 | $1.30 | 26d | 1 | 0.89mi |
| 248 Stockton St North Fort Myers, FL | 3.0 | 2.0 | 924 | $1,300 | $1.41 | 26d | 1 | 0.96mi |
| 260 Stockton St North Fort Myers, FL | 2.0 | 2.0 | 924 | $1,200 | $1.30 | 5d | 1 | 0.98mi |
| 247 Stockton St North Fort Myers, FL | 3.0 | 2.0 | 924 | $1,325 | $1.43 | 26d | 1 | 0.99mi |
| 3404 Rainbow Ln North Fort Myers, FL | 2.0 | 2.0 | 1056 | $1,800 | $1.70 | 5d | 1 | 1.00mi |
| 8791 Littleton Rd North Fort Myers, FL | 2.0 | 2.0 | 1074 | $1,549 | $1.44 | 26d | 1 | 1.04mi |
| 538 State St North Fort Myers, FL | 3.0 | 1.5 | 1000 | $1,199 | $1.20 | 26d | 1 | 1.16mi |
| 1846 Powell Dr Unit 28 North Fort Myers, FL | 1.0 | 1.0 | 850 | $1,500 | $1.76 | 5d | 1 | 1.16mi |
| 3260 Stockton St North Fort Myers, FL | 3.0 | 1.0–2.0 | 976 | $2,371 | $2.43 | 4d | 27 | 1.20mi |
| 8086 Heck Dr Unit 6 North Fort Myers, FL | 2.0 | 1.0 | 600 | $800 | $1.33 | 26d | 1 | 1.24mi |
| 446 San Bernardino St North Fort Myers, FL | 2.0 | 1.0 | 1104 | $1,590 | $1.44 | 12d | 1 | 1.26mi |
| 7535 McDaniel Dr North Fort Myers, FL | 2.0 | 1.0 | 644 | $850 | $1.32 | 16d | 1 | 1.28mi |
| 7535 McDaniel Dr North Fort Myers, FL | 2.0 | 1.0 | 644 | $850 | $1.32 | 26d | 1 | 1.28mi |
| 2211 Cantor Ln North Fort Myers, FL | 2.0 | 2.0 | 672 | $850 | $1.26 | 4d | 1 | 1.46mi |
| 7869 Suncoast Dr North Fort Myers, FL | 2.0 | 1.0 | 564 | $850 | $1.51 | 4d | 1 | 1.47mi |
HOA detail
- Monthly dues
- $80 · $960/yr
- Likely covers
- water
Listing history 16 events
-
2026-06-22days on market $84,500 Active 322 DOM
-
2026-06-22days on market $84,500 Active 321 DOM
-
2026-06-17days on market $84,500 Active 317 DOM
-
2026-06-16days on market $84,500 Active 316 DOM
-
2026-06-16days on market $84,500 Active 315 DOM
-
2026-06-13days on market $84,500 Active 313 DOM
-
2026-06-09days on market $84,500 Active 309 DOM
-
2026-06-07days on market $84,500 Active 307 DOM
-
2026-06-02days on market $84,500 Active 302 DOM
-
2026-06-01days on market $84,500 Active 301 DOM
-
2026-06-01days on market $84,500 Active 300 DOM
-
2026-04-14price $84,500
-
2026-02-24price $89,900
-
2025-08-01$129,250 Active
-
2010-05-05soldstatus $53,500
-
1996-06-24soldstatus $30,000
ⓘ Source: listings_history table (triggers on properties + properties_extension) + one-shot
backfill from property_details.listing_events for pre-trigger history.
Tax reassessment forecast FL · Resets to sale price
- Current annual tax
- $183 · $15/mo
- Projected year-2 tax
- $701 · $58/mo
- Expected delta
- +$518/yr (+$43/mo · 282.9%)
ⓘ Screening estimate from a state-policy table — verify with the county assessor before closing.
Climate risk First Street
- Flood 1/10 Low FEMA zone AE · 0% chance over 30 yrs
- Wildfire 3/10 Moderate
- Heat 10/10 Extreme 7 d/yr ≥107°F today · 27 d/yr by 30 yrs out
- Wind 10/10 Extreme 99% chance of damaging wind over 30 yrs
- Air quality 2/10 Low 1 unhealthy d/yr today · 1 by 30 yrs out
Nearby sold comps map
Loading sold comps map…
Walkable amenities ~0.75 mi
Loading nearby amenities…
Taxation est. · year 1
- Rental income
- $13,682
- − Mortgage interest
- −$4,733
- − Property taxes
- −$183
- − Insurance
- −$5,541
- − Repairs & maintenance
- −$1,095
- − Management
- −$1,095
- − HOA
- −$960
- − Depreciation
- −$2,458
- Taxable loss
- −$2,383
- Est. tax savings @ 24.0%
- +$572
- After-tax cash flow
- $-621/yr
For passive investors: Depreciation is non-cash, so a rental often shows a tax loss while cash-flowing — sheltering income. Rental losses are passive: they offset passive income freely, and up to $25,000/yr can offset ordinary (W-2) income if you actively participate and your MAGI is under $100k (phasing out to $0 by $150k); unused losses carry forward. On sale, claimed depreciation is recaptured at up to 25%, and gains may owe capital-gains tax (a 1031 exchange can defer both). Figures are a year-1 estimate at your 24.0% rate — not tax advice; consult a CPA.
Schools (NCES district)
- District
- Lee
- NCES district ID
- 1201080
- Math proficiency
- 47% ▼ -11.00%
- Reading proficiency
- 50% ▼ -4.00%
- Median HH income
- $49,518
- Composite
- 41.49/100
- National rank
- #3458
- State rank
- #42 of 73 in FL
Livability — North Fort Myers
- Score
- 74/100
- State rank
- #269
- US rank
- #4409
Category grades
Schools grade is shown separately in the Schools card above.
Census & demographics
- Census place
- North Fort Myers, FL
- County
- Lee County · 788,662 people
- City population
- 57,035
- Metro
- Cape Coral-Fort Myers, FL
- Population (ZIP)
- 33,380
- Household income
- $55,000
- Rent vs Own
- Severe rent burden
- 775.0
Population outlook (Lee County) Hauer SSP2
- Today (2025)
- 871,946 people
- By 2030
- 955,468 · +9.6%
- By 2040
- 1,113,587 · +27.7%
- By 2050
- 1,256,891 · +44.1%
- By 2075
- 1,560,270 · +78.9%
- By 2100
- 1,726,848 · +98.0%
Race, ethnicity, and origin ACS 2023
- Neighborhood character
- Predominantly White (85%)
- Race & ethnicity
- White 85% Hispanic / Latino 10% Two or more races 7% Asian 1% Black 1%
- Hispanic origin (detail)
- Mexican 2% Puerto Rican 1% Cuban 3%
- Common ancestry
- Lithuanian 3% Romanian 3% Slovak 2%
- Foreign-born
- 10% · Canada
- Languages at home
- 88% English-only · Spanish 9% Other Indo-European 1% Russian/Polish/Slavic 1%
Political lean MEDSL · Lee
- 2024 margin
- Strong R (+28.4) · D 35.5% · R 63.9%
- 2008→2024 swing
- -18.0pp toward R · 2008: -10.4pp · 2024: -28.4pp
- All cycles
- 2024: R+28.4 2020: R+19.2 2016: R+20.4 2012: R+16.6 2008: R+10.4
Not yet ingested
- Civics
- —
Market trends
- HPI YoY
- ▼ -122.28%
- Current HPI
- 282.2895
- Rent YoY
- ▲ 2.63%
- Metro
- Cape Coral-Fort Myers, FL
- State GDP YoY
- ▲ 3.28%
- F500 in state
- 36
Industry mix (Fortune 500 HQ in FL)
| Industry | F500 HQs | Revenue |
|---|---|---|
| Industrial Technology | 2 | $29B |
|
||
| Insurance | 2 | $17B |
|
||
| Retail | 1 | $60B |
|
||
| Technology Distribution | 1 | $58B |
|
||
| Homebuilding | 1 | $35B |
|
||
| Technology Manufacturing | 1 | $35B |
|
||
Price history
+181.7% since first listed5 events — show timeline
- 2026-04-14 Price Changed $84,500 FORTMLS
- 2026-02-24 Price Changed $89,900 FORTMLS
- 2025-08-01 Listed $129,250 FORTMLS
- 2010-05-05 Sold (Public Records) $53,500 Public Records
- 1996-06-24 Sold (Public Records) $30,000 Public Records
Property tax history
+2.6%/yrLatest (2025): $183 · +9.4% YoY. Source: county tax records.
Cash-flow waterfall
monthlySold comps — $/sqft
last 12 mo · ≤1 miLoading sold comps…