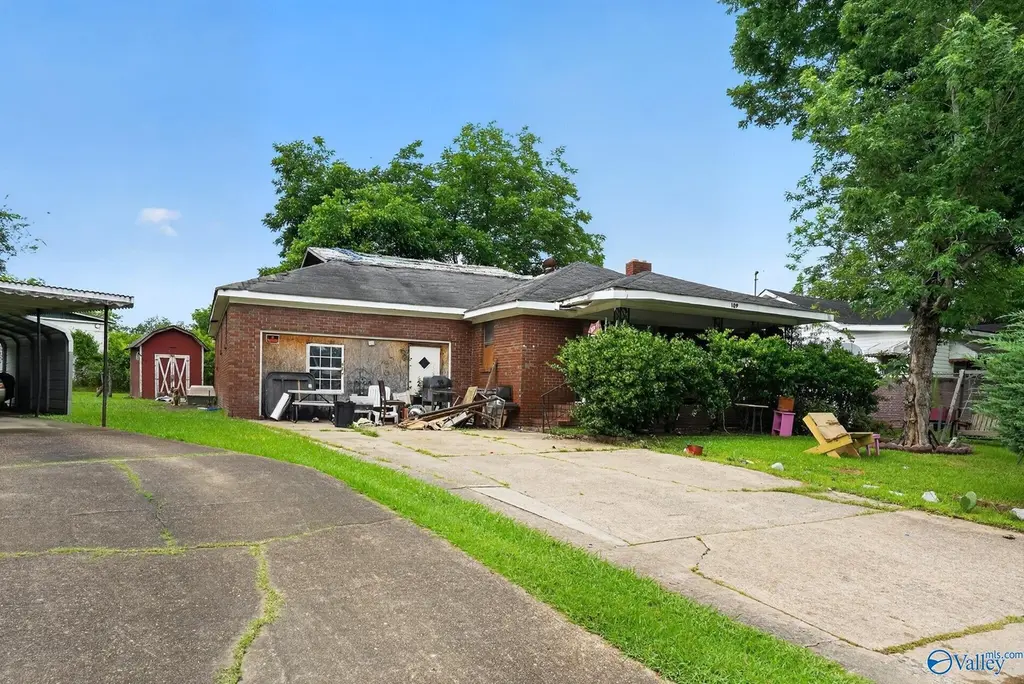
109 Washington Ave · Gadsden, AL
Flood risk 1/10 · Minimal
- FEMA flood zone
- X (unshaded)
- Chance of flooding over 30 yrs
- 0.0%
- Est. flood insurance / yr
- $507 – $1,088
Fire risk 3/10 · Minor
- Est. fire insurance / yr
- $916 – $1,700
Heat risk 6/10 · Moderate
- Hot days now (above 107°F)
- 7 days/yr
- Hot days in 30 yrs
- 20 days/yr
Wind risk 5/10 · Moderate
- Chance of severe wind over 30 yrs
- 25.0%
Air-quality risk 2/10 · Minimal
- Unhealthy air days now
- 2 days/yr
- Unhealthy air days in 30 yrs
- 2 days/yr
Risk factors via First Street. Map © Google.
Why this score? — see what drove the B- grade
The composite is a weighted blend of 9 inputs, each scored 0–100. Each bar is that input's sub-score; the figure is the points it added to the 100-point composite (weight × sub-score).
- Cash flow +30.0/30.0
- 1% rule +10.0/10.0
- DSCR +10.0/10.0
- ARV discount +7.5/15.0
- Livability +3.0/5.0
- Rent growth +2.5/5.0
- Condition / age +2.5/5.0
- Schools +2.2/10.0
- Appreciation +0.0/10.0
$59,900
🖨 Deal sheet 📄 Offer letter ✓ Due diligence
Listing remarks
Welcome to 109 Washington Ave, a charming house located in East Gadsden, AL. With its classic architectural design, the house exudes charm and character. The exterior features a welcoming façade, adding to its curb appeal. Inside, the layout is designed to provide a comfortable and functional living space. While specific interior details are not provided, the potential for customization and personalization allows you to create a home tailored to your needs. The property's location in East Gadsden provides convenient access to local amenities and services. Whether you're looking for a place to call home or an investment opportunity, this house is worth considering. Don't miss the chan
Key facts
- Curb appeal
- Welcoming façade
- 7,840 sq ft lot
Tags
Property features AI
Finance
- Other: Living area approximately 1,766 square feet; Lot about 0.18 acres; Total rooms: 7
- HOA & community: No homeowners association; Subdivision: Lincoln Park
Exterior
- Parking: Concrete driveway
- Utilities: Public sewer
- Home design: Single-family residence; One story; Built in 1942; Residential property
- Construction: Brick construction
- Exterior features: Detached building; Driveway with concrete
Interior
- Kitchen: Refrigerator
- Bathrooms: 1 full bathroom; 1 half bathroom
- Heating & cooling: Window cooling (2+ units); No central heating
- Interior features: Crawl space; One fireplace
Neighborhood map
What this means for you Summary
Snapshot
- This is a 4-bed/2.0-bath single-family listed at $60k.
Deal economics
- At list price, monthly cash flow is $857 ($10k/yr) — positive.
- The deal already cash-flows at list — no discount required.
- Meets the 1% rule at list price ($2k rent vs $60k).
- Cap rate 23.5% vs local median 5.1% in Gadsden — top-decile yield for the area; either an underpriced asset or a hidden risk that comps aren't pricing in. Stress-test before assuming the spread holds.
Location & tenants
- Location reads 59/100 on livability (#335 in AL) — a working-class tenant base; expect higher turnover. Strengths: cost of living A+, housing A+; Watch: crime F, amenities F, commute F.
- Gadsden City (urban): math 15% / reading 39% proficiency, ranked #87 of 129 in AL (top 67%) — low school quality limits family demand, transient renter base, plan for 1-2y turnover; 66% free/reduced lunch — lower-income household profile, screen leases tightly.
- Zoned schools: Donehoo Elementary School (math 8% / reading 32%, grade F, #457 of 627 statewide, top 74%, 260 students, 80% FRL); Litchfield Middle School (math 5% / reading 28%, grade F, #203 of 257 statewide, top 79%, 255 students, 91% FRL); Gadsden City High School (math 17% / reading 24%, grade F, #159 of 305 statewide, top 53%, 1,318 students, 76% FRL) — zoned schools average 82% FRL vs 66% district-wide (16 pts higher); higher-poverty schools than district average — tighter screening recommended.
- Market conditions: 97 active listings in the ZIP; 119 units permitted in Etowah County in 2024 (0 in 5+ unit buildings).
Forward outlook
- Local home prices are declining (-3.0%/yr); year-one equity from $414 of loan paydown is wiped out by about $2k of value loss. Plan a longer hold.
- Etowah County population projected at -12% by 2050 — secular population decline; favor cash flow + early exit over multi-decade hold.
- At projected returns (-3.0% appreciation + 3.0% rent growth), your $17k cash investment doubles in ~2 years — after that, you're playing with house money.
Negotiation context
- Only 8 days on market — expect competitive offers; lowballing is unlikely to land.
Risks & watch-outs
- Watch-outs: built in 1942 — expect roof / HVAC / electrical / plumbing capex.
- Climate carrying-cost: moderate wind risk, 25% chance of damaging wind over 30y; extreme-heat days projected 7→20/yr by 2055 (HVAC capex compounding) — expect insurance premiums to compound above CPI over the hold.
Questions for the listing agent
- Built in 1942 — when were the roof, HVAC, electrical panel, plumbing, and water heater last replaced?
- Is there a deadline driving the sale (1031 exchange, divorce, estate, relocation)? That informs how much negotiation room exists.
- Crime grade is F in this area — have there been break-ins, vandalism, or insurance claims at this property in the last 3 years? What carrier currently insures it and at what premium?
- What's the average days-on-market for RENTAL listings here right now (not sales)? A rising rental-DOM trend means longer vacancies and softer asking-rent achievability than the comps imply.
- What's the recent tenant-quality profile in this submarket — average credit score on applications, eviction rate, late-payment / NSF rate, and stable-employment percentage? A property-management company in the area should have these aggregated.
- How much new for-sale + rental construction is in the pipeline within 1–3 miles? Heavy new supply typically softens prices + rents 12–24 months out; constrained supply supports both.
Investment metrics
- 1% rule
- 2.66% ✓
- Cap rate
- 23.46%
- Cash-on-cash
- 61.31%
- DSCR
- 3.73
- GRM
- 3.1
CMA / ARV
- ARV (on-the-fly)
- $123,620
- Comps found
- 12
Show comp detail 12 sales within ~0.75 mi
| Address | Dist | Beds/Ba | Sqft | Sold | Price | $/sf | Match |
|---|---|---|---|---|---|---|---|
| 306 Greenwood Ave | 0.46mi | 4/2.0 | 1,795 (+2%) | 3mo | $125,000 | $70 | 73 |
| 920 Tomahawk Trl | 0.62mi | 3/2.0 (-1) | 1,835 (+4%) | 8mo | $150,000 | $82 | 53 |
| 225 Davis St | 0.19mi | 3/2.0 (-1) | 1,502 (-15%) | 10mo | $82,297 | $55 | 53 |
| 1107 Mallory St | 0.56mi | 3/2.0 (-1) | 1,934 (+10%) | 3mo | $153,800 | $80 | 51 |
| 909 E Tomahawk Trl | 0.64mi | 3/2.0 (-1) | 1,904 (+8%) | 4mo | $112,302 | $59 | 48 |
| 1524 Arrowhead Dr | 0.59mi | 3/2.0 (-1) | 1,559 (-12%) | 1mo | $137,000 | $88 | 47 |
| 1641 Arrowhead Dr | 0.62mi | 4/2.0 | 1,516 (-14%) | 1mo | $165,200 | $109 | 47 |
| 1210 East Broad St | 0.63mi | 4/2.0 | 1,650 (-7%) | 15mo | $110,000 | $67 | 47 |
| 1316 Linden St | 0.60mi | 3/2.0 (-1) | 1,553 (-12%) | 2mo | $199,000 | $128 | 45 |
| 1315 E Broad St | 0.57mi | 3/1.0 (-1) | 1,504 (-15%) | 3mo | $60,000 | $40 | 37 |
| 318 Keeling Rd | 0.73mi | 4/4.0 | 1,693 (-4%) | 17mo | $54,000 | $32 | 37 |
| 1215 Tennessee Ave | 0.61mi | 3/2.0 (-1) | 1,987 (+12%) | 16mo | $67,500 | $34 | 33 |
Match score weights: distance 35% · size 25% · config 20% · recency 20%. Top-matched comps best support the ARV.
Projected returns pro-forma
-3.0% appreciation · 3.0% rent growth · sell at horizon
- IRR
- 60.2%
- Equity multiple
- 3.68×
- Total profit
- $44,886
- Equity at exit
- $8,931
- IRR
- 64.8%
- Equity multiple
- 7.52×
- Total profit
- $109,430
- Equity at exit
- $5,179
Cash invested: $16,772 (down + closing). Projections, not guarantees.
Landlord ↔ Tenant lean methodology
- Overall (STATE)
- 90 Strongly Landlord-Friendly
- State Alabama
- 90 Strongly Landlord-Friendly · R+15
- County
- — inherits STATE
- City
- — inherits STATE
ZIP-level market 35903
- Home prices YoY
- -11.0%
- Active inventory
- 97
- Price-to-rent
- 3.1×
Monthly cashflow live
- Estimated rent
- $1,595 medium interval (Pro) →
- Mortgage (P&I)
- −$314
- Tax from tax record
- −$64 /mo · $768/yr
- Insurance
- −$25
- HOA
- −$0
- Vacancy / Maint / Mgmt
- −$335
- Net cashflow
- $857
Break-even live
UW: 25.0% down · 7.5% · 30yr · 1.5% tax · 5.0% vac · 8.0% maint · 8.0% mgmt
Financing live
Cash to close
- Down payment
- $14,975
- Closing costs
- $1,797
- Reserves months
- —
- Total cash needed
- —
Loan-product check · same deal, 3 products live
Conventional
25% down · 7.5% · 30yr
- Down + closing
- —
- Monthly P&I
- —
- Monthly cashflow
- —
- DSCR
- —
- Eligible?
- —
Personal DTI + credit; lowest rate.
DSCR
20% down · 8.5% · 30yr
- Down + closing
- —
- Monthly P&I
- —
- Monthly cashflow
- —
- DSCR
- —
- Eligible?
- —
No personal income docs; deal must DSCR.
Hard money
10% down · 12.0% · 12mo
- Down + closing
- —
- Monthly P&I
- —
- Monthly cashflow
- —
- DSCR
- —
- Eligible?
- —
Short-term bridge; refi at stabilization.
Listing history 8 events
-
2026-06-19days on market $59,900 Active 8 DOM
-
2026-06-18days on market $59,900 Active 7 DOM
-
2026-06-17days on market $59,900 Active 6 DOM
-
2026-06-16days on market $59,900 Active 5 DOM
-
2026-06-15days on market $59,900 Active 4 DOM
-
2026-06-14days on market $59,900 Active 2 DOM
-
2026-06-12remarks 692-char remark
-
2026-06-12$59,900 Active 1 DOM
ⓘ Source: listings_history table (triggers on properties + properties_extension) + one-shot
backfill from property_details.listing_events for pre-trigger history.
Tax reassessment forecast AL · Resets to sale price
- Current annual tax
- $768 · $64/mo
- Projected year-2 tax
- $768 · $64/mo
- Expected delta
- $0/yr ($0/mo · 0.0%)
ⓘ Screening estimate from a state-policy table — verify with the county assessor before closing.
Climate risk First Street
- Flood 1/10 Low FEMA zone X (unshaded) · 0% chance over 30 yrs
- Wildfire 3/10 Moderate
- Heat 6/10 Major 7 d/yr ≥107°F today · 20 d/yr by 30 yrs out
- Wind 5/10 Major 25% chance of damaging wind over 30 yrs
- Air quality 2/10 Low 2 unhealthy d/yr today · 2 by 30 yrs out
Nearby sold comps map
Loading sold comps map…
Walkable amenities ~0.75 mi
Loading nearby amenities…
Taxation est. · year 1
- Rental income
- $19,139
- − Mortgage interest
- −$3,355
- − Property taxes
- −$768
- − Insurance
- −$300
- − Repairs & maintenance
- −$1,531
- − Management
- −$1,531
- − Depreciation
- −$1,743
- Taxable income
- $9,911
- Est. tax owed @ 24.0%
- −$2,379
- After-tax cash flow
- $7,904/yr
For passive investors: Depreciation is non-cash, so a rental often shows a tax loss while cash-flowing — sheltering income. Rental losses are passive: they offset passive income freely, and up to $25,000/yr can offset ordinary (W-2) income if you actively participate and your MAGI is under $100k (phasing out to $0 by $150k); unused losses carry forward. On sale, claimed depreciation is recaptured at up to 25%, and gains may owe capital-gains tax (a 1031 exchange can defer both). Figures are a year-1 estimate at your 24.0% rate — not tax advice; consult a CPA.
Schools (NCES district)
- District
- Gadsden City
- NCES district ID
- 0101620
- Math proficiency
- 15% ▼ -27.00%
- Reading proficiency
- 39% ▼ -2.00%
- Median HH income
- $29,099
- Composite
- 21.62/100
- National rank
- #8292
- State rank
- #87 of 129 in AL
Livability — Gadsden
- Score
- 59/100
- State rank
- #335
- US rank
- #20131
Category grades
Schools grade is shown separately in the Schools card above.
Census & demographics
- Census place
- Gadsden, AL
- Population (ZIP)
- 17,180
Population outlook (Etowah County) Hauer SSP2
- Today (2025)
- 100,500 people
- By 2030
- 98,488 · -2.0%
- By 2040
- 93,731 · -6.7%
- By 2050
- 88,681 · -11.8%
- By 2075
- 76,746 · -23.6%
- By 2100
- 65,373 · -35.0%
Race, ethnicity, and origin ACS 2023
- Neighborhood character
- Majority White (62%)
- Race & ethnicity
- White 62% Black 31% Hispanic / Latino 4% Two or more races 4% Asian 1%
- Common ancestry
- Italian 3% Slovak 2% Portuguese 1%
- Foreign-born
- 3% · Canada
- Languages at home
- 96% English-only · Spanish 4%
Political lean MEDSL · Etowah
- 2024 margin
- Solid R (+55.7) · D 21.8% · R 77.5%
- 2008→2024 swing
- -17.5pp toward R · 2008: -38.2pp · 2024: -55.7pp
- All cycles
- 2024: R+55.7 2020: R+50.2 2016: R+50.1 2012: R+38.4 2008: R+38.2
Not yet ingested
- Civics
- —
Market trends
- HPI YoY
- ▼ -29.07%
- Current HPI
- 236.2537
- Rent YoY
- —
- Metro
- —
- State GDP YoY
- ▲ 2.94%
- F500 in state
- 4
Industry mix (Fortune 500 HQ in AL)
| Industry | F500 HQs | Revenue |
|---|---|---|
| Financial Services | 1 | $8B |
|
||
| Healthcare | 1 | $5B |
|
||
Price history
1 event — show timeline
- 2026-06-11 Listed $59,900 VMLS
Property tax history
+11.7%/yrLatest (2022): $768 · +30.4% YoY. Source: county tax records.
Cash-flow waterfall
monthlySold comps — $/sqft
last 12 mo · ≤1 miLoading sold comps…