 🏷️ Likely Rental
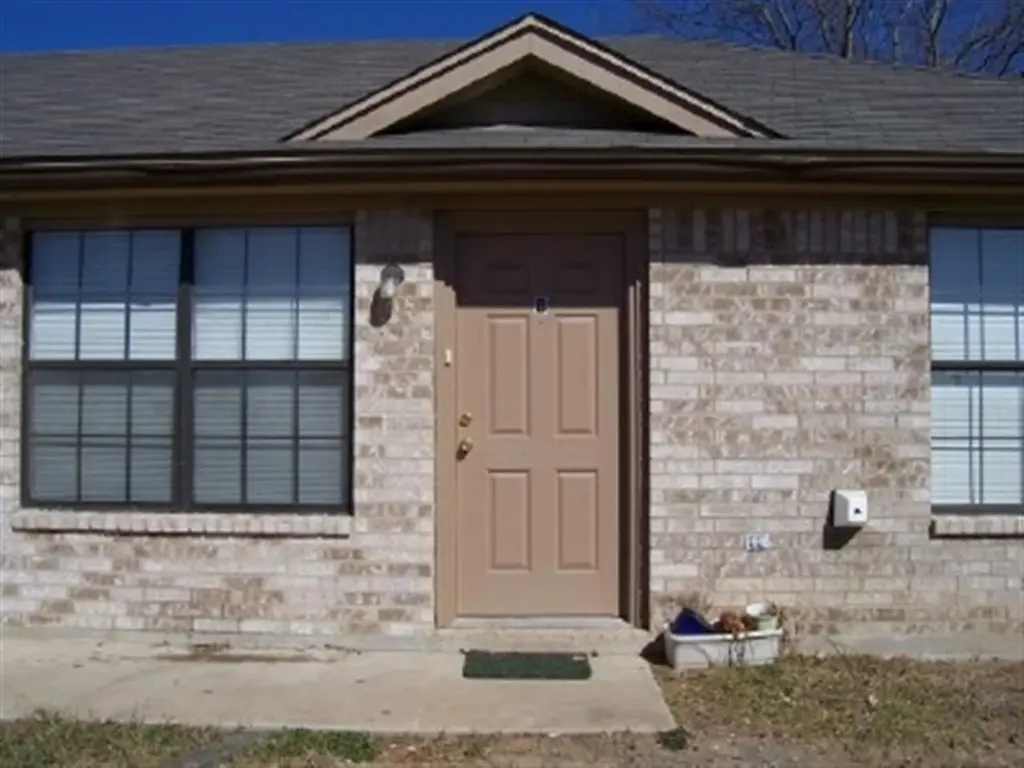
408 S Avenue S, #B · Marble Falls, TX
Flood risk No data
- FEMA flood zone
- —
- Chance of flooding over 30 yrs
- —
- Est. flood insurance / yr
- —
Fire risk No data
- Est. fire insurance / yr
- —
Heat risk No data
- Hot days now (above threshold)
- —
- Hot days in 30 yrs
- —
Wind risk No data
- Chance of severe wind over 30 yrs
- —
Air-quality risk No data
- Unhealthy air days now
- —
- Unhealthy air days in 30 yrs
- —
Risk factors via First Street. Map © Google.
Why this score? — see what drove the D grade
The composite is a weighted blend of 9 inputs, each scored 0–100. Each bar is that input's sub-score; the figure is the points it added to the 100-point composite (weight × sub-score).
- Cash flow +15.0/30.0
- ARV discount +7.5/15.0
- 1% rule +5.0/10.0
- DSCR +5.0/10.0
- Livability +3.5/5.0
- Schools +3.0/10.0
- Condition / age +2.5/5.0
- Rent growth +2.3/5.0
- Appreciation +0.0/10.0
$1,100
🖨 Deal sheet 📄 Offer letter ✓ Due diligence
Listing remarks MLS
MOVE IN SPECIAL * * * * $500 Off 1st Month's Rent Move in Special * * * * Available Now! Located in Marble Falls, just minutes from the city park and Marble Falls Elementary, this well-maintained home features vinyl plank flooring throughout and vaulted ceilings that create a bright, open feel. The kitchen offers ample cabinet space, a double sink, electric range, vent hood, dishwasher, and generous counter space. The bathroom includes a full tub/shower combo with updated vanity and lighting. Spacious living area with ceiling fan and natural light. Includes full-size washer connections and a functional layout in a convenient location close to schools and amenities.
Key facts
- Vent hood
- Electric range
- Double sink
Tags
Neighborhood map
What this means for you Summary
Snapshot
- This is a 2-bed/1.0-bath condo listed at $1k.
Deal economics
- At list price, monthly cash flow is $1k ($14k/yr) — positive.
- The deal already cash-flows at list — no discount required.
- Meets the 1% rule at list price ($1k rent vs $1k).
- Recommended offer: $968 (12.0% below list) — sets the bar for market timing.
- Cap rate 1248.5% vs local median 2.7% in Marble Falls — top-decile yield for the area; either an underpriced asset or a hidden risk that comps aren't pricing in. Stress-test before assuming the spread holds.
Location & tenants
- Location reads 70/100 on livability (#367 in TX) — a middle-class / working-renter tenant base. Strengths: cost of living A+, health & safety A+, housing A; Watch: crime C-, schools D, employment D.
- Marble Falls ISD (town): math 32% / reading 38% proficiency, ranked #511 of 826 in TX (top 62%) — families likely to look elsewhere, expect single-tenant / working-renter base with shorter leases.
- Market conditions: Rents soft (-0.6%/yr); 752 active listings in the ZIP; 7 comparable units currently listed for rent nearby; rentals at typical pace (median 24d on market — plan ~3-4 weeks tenant-placement turnaround); 43% of comp listings sitting > 30 days — soft ceiling on asking rent; 891 units permitted in Burnet County in 2024 (76 in 5+ unit buildings).
Forward outlook
- Local home prices are declining (-3.0%/yr); year-one equity from $8 of loan paydown is wiped out by about $33 of value loss. Plan a longer hold.
- Burnet County population projected at +22% by 2050 — long-run rental-demand tailwind backs the buy-and-hold thesis.
- At projected returns (-3.0% appreciation + 0.0% rent growth), your $308 cash investment doubles in ~1 year — after that, you're playing with house money.
Negotiation context
- It's been on market 125 days — a 12% lower offer ($968) is reasonable based on typical stale-listing flexibility.
Questions for the listing agent
- It's been on market 125 days. Have you received any prior offers? Is the seller open to a 12% concession, seller financing, or rate buy-down credit?
- Any open or pending special assessments — roof, HVAC, plumbing, elevator, façade? What's the per-unit balance and payoff schedule, and is the seller paying it off at close or rolling it to the buyer?
- Why hasn't it sold? Are there any deal-killer items the seller is aware of (foundation, flood, title, zoning, code violations)?
- Is there a deadline driving the sale (1031 exchange, divorce, estate, relocation)? That informs how much negotiation room exists.
- Schools are D-rated, which usually means shorter tenancies and higher turnover. Who's the typical renter profile here, and what's been the actual vacancy rate?
- The area grade is low — what's the realistic commute time and amenity access for the typical tenant pool here? Any planned neighborhood developments (good or bad) we should know about?
- What's the average days-on-market for RENTAL listings here right now (not sales)? A rising rental-DOM trend means longer vacancies and softer asking-rent achievability than the comps imply.
- What's the recent tenant-quality profile in this submarket — average credit score on applications, eviction rate, late-payment / NSF rate, and stable-employment percentage? A property-management company in the area should have these aggregated.
- How much new apartment / multifamily construction is in the pipeline within 1–3 miles? Heavy new supply (>2% of stock underway) typically softens rents 12–24 months out; light construction supports rent growth.
Investment metrics
- 1% rule
- 131.91% ✓
- Cap rate
- 1248.55%
- Cash-on-cash
- 4436.63%
- DSCR
- 198.41
- GRM
- 0.1
CMA / ARV
No comps found within radius.
Projected returns pro-forma
-3.0% appreciation · 0.0% rent growth · sell at horizon
- IRR
- —
- Equity multiple
- 222.16×
- Total profit
- $68,118
- Equity at exit
- $164
- IRR
- —
- Equity multiple
- 443.73×
- Total profit
- $136,360
- Equity at exit
- $95
Cash invested: $308 (down + closing). Projections, not guarantees.
Landlord ↔ Tenant lean methodology
- Overall (STATE)
- 87 Strongly Landlord-Friendly
- State Texas
- 87 Strongly Landlord-Friendly · R+5
- County
- — inherits STATE
- City
- — inherits STATE
ZIP-level market 78654
- Home prices YoY
- -31.8%
- Rents YoY
- -0.6%
- Active inventory
- 752
- Price-to-rent
- 0.1×
Monthly cashflow live
- Estimated rent
- $1,451 high interval (Pro) →
- Mortgage (P&I)
- −$6
- Tax est. 1.5%
- −$1 /mo · $16/yr
- Insurance
- −$0
- HOA
- −$0
- Vacancy / Maint / Mgmt
- −$305
- Net cashflow
- $1,139
Break-even live
UW: 25.0% down · 7.5% · 30yr · 1.5% tax · 5.0% vac · 8.0% maint · 8.0% mgmt
Financing live
Cash to close
- Down payment
- $275
- Closing costs
- $33
- Reserves months
- —
- Total cash needed
- —
Loan-product check · same deal, 3 products live
Conventional
25% down · 7.5% · 30yr
- Down + closing
- —
- Monthly P&I
- —
- Monthly cashflow
- —
- DSCR
- —
- Eligible?
- —
Personal DTI + credit; lowest rate.
DSCR
20% down · 8.5% · 30yr
- Down + closing
- —
- Monthly P&I
- —
- Monthly cashflow
- —
- DSCR
- —
- Eligible?
- —
No personal income docs; deal must DSCR.
Hard money
10% down · 12.0% · 12mo
- Down + closing
- —
- Monthly P&I
- —
- Monthly cashflow
- —
- DSCR
- —
- Eligible?
- —
Short-term bridge; refi at stabilization.
Rent comps 7 comps
| Address | Beds | Baths | Sqft | Rent | $/sqft | DOM | Units | Dist |
|---|---|---|---|---|---|---|---|---|
| 305 S Avenue S Marble Falls, TX | 3.0 | 2.0 | 1080 | $1,525 | $1.41 | 44d | 1 | 0.04mi |
| 1611 2nd St Marble Falls, TX | 3.0 | 1.0 | 975 | $1,395 | $1.43 | 24d | 1 | 0.41mi |
| 1106 Brazos St Marble Falls, TX | 1.0–2.0 | 1.0–1.5 | 772 | $1,450 | $1.88 | 44d | 4 | 0.59mi |
| 708 Avenue S Marble Falls, TX | 2.0 | 1.0 | 720 | $1,500 | $2.08 | 44d | 1 | 0.78mi |
| 1010 Barrier Ln Marble Falls, TX | 2.0 | 1.0 | 975 | $995 | $1.02 | 15d | 1 | 0.92mi |
| 1112 Northwood Dr Marble Falls, TX | 2.0 | 1.0 | 923 | $1,350 | $1.46 | 24d | 1 | 1.05mi |
| 506 Gateway Pkwy Marble Falls, TX | 1.0 | 1.0 | 670 | $1,050 | $1.57 | 4d | 2 | 1.45mi |
HOA detail condo
- Monthly dues
- $0 · $0/yr
- Likely covers
- electric
- Assessments
- None detected in remarks — confirm with the listing agent.
Listing history 14 events
-
2026-06-18days on market $1,100 Active 125 DOM
-
2026-06-17days on market $1,100 Active 124 DOM
-
2026-06-16days on market $1,100 Active 123 DOM
-
2026-06-15days on market $1,100 Active 122 DOM
-
2026-06-13days on market $1,100 Active 120 DOM
-
2026-06-13days on market $1,100 Active 119 DOM
-
2026-06-09days on market $1,100 Active 116 DOM
-
2026-06-08days on market $1,100 Active 115 DOM
-
2026-06-07days on market $1,100 Active 114 DOM
-
2026-06-05days on market $1,100 Active 111 DOM
-
2026-06-03days on market $1,100 Active 110 DOM
-
2026-06-01days on market $1,100 Active 108 DOM
-
2026-05-31days on market $1,100 Active 107 DOM
-
2026-02-13$1,100 Active 680-char remark
Show marketing remark (680 chars)
MOVE IN SPECIAL * * * * $500 Off 1st Month's Rent Move in Special * * * * Available Now! Located in Marble Falls, just minutes from the city park and Marble Falls Elementary, this well-maintained home features vinyl plank flooring throughout and vaulted ceilings that create a bright, open feel. The kitchen offers ample cabinet space, a double sink, electric range, vent hood, dishwasher, and generous counter space. The bathroom includes a full tub/shower combo with updated vanity and lighting. Spacious living area with ceiling fan and natural light. Includes full-size washer connections and a functional layout in a convenient location close to schools and amenities.
ⓘ Source: listings_history table (triggers on properties + properties_extension) + one-shot
backfill from property_details.listing_events for pre-trigger history.
Nearby sold comps map
Loading sold comps map…
Walkable amenities ~0.75 mi
Loading nearby amenities…
Taxation est. · year 1
- Rental income
- $17,413
- − Mortgage interest
- −$62
- − Property taxes
- −$16
- − Insurance
- −$6
- − Repairs & maintenance
- −$1,393
- − Management
- −$1,393
- − Depreciation
- −$32
- Taxable income
- $14,511
- Est. tax owed @ 24.0%
- −$3,483
- After-tax cash flow
- $10,182/yr
For passive investors: Depreciation is non-cash, so a rental often shows a tax loss while cash-flowing — sheltering income. Rental losses are passive: they offset passive income freely, and up to $25,000/yr can offset ordinary (W-2) income if you actively participate and your MAGI is under $100k (phasing out to $0 by $150k); unused losses carry forward. On sale, claimed depreciation is recaptured at up to 25%, and gains may owe capital-gains tax (a 1031 exchange can defer both). Figures are a year-1 estimate at your 24.0% rate — not tax advice; consult a CPA.
Schools (NCES district)
- District
- Marble Falls ISD
- NCES district ID
- 4829010
- Math proficiency
- 32% ▼ -8.00%
- Reading proficiency
- 38% ▼ -4.00%
- Median HH income
- $49,663
- Composite
- 30.3/100
- National rank
- #6278
- State rank
- #511 of 826 in TX
Livability — Marble Falls
- Score
- 70/100
- State rank
- #367
- US rank
- #7802
Category grades
Schools grade is shown separately in the Schools card above.
Census & demographics
- Census place
- Marble Falls, TX
- County
- Burnet County · 35,210 people
- City population
- 20,650
- Metro
- Austin-Round Rock-Georgetown, TX
- Population (ZIP)
- 20,650
- Household income
- $74,130
- Rent vs Own
- Severe rent burden
- 354.0
Population outlook (Burnet County) Hauer SSP2
- Today (2025)
- 50,492 people
- By 2030
- 52,995 · +5.0%
- By 2040
- 57,528 · +13.9%
- By 2050
- 61,444 · +21.7%
- By 2075
- 71,098 · +40.8%
- By 2100
- 74,634 · +47.8%
Race, ethnicity, and origin ACS 2023
- Neighborhood character
- Predominantly White (68%)
- Race & ethnicity
- White 68% Hispanic / Latino 28% Two or more races 8%
- Hispanic origin (detail)
- Mexican 24%
- Common ancestry
- Serbian 2% Italian 2% Slovak 2%
- Foreign-born
- 8% · Canada
- Languages at home
- 81% English-only · Spanish 18% Other Indo-European 1%
Political lean MEDSL · Burnet
- 2024 margin
- Solid R (+55.7) · D 21.7% · R 77.4%
- 2008→2024 swing
- -11.6pp toward R · 2008: -44.1pp · 2024: -55.7pp
- All cycles
- 2024: R+55.7 2020: R+53.1 2016: R+56.8 2012: R+54.6 2008: R+44.1
Not yet ingested
- Civics
- —
Market trends
- HPI YoY
- ▼ -118.02%
- Current HPI
- 252.9861
- Rent YoY
- ▼ -0.62%
- Metro
- Austin-Round Rock-Georgetown, TX
- State GDP YoY
- ▲ 3.95%
- F500 in state
- 110
Industry mix (Fortune 500 HQ in TX)
| Industry | F500 HQs | Revenue |
|---|---|---|
| Energy | 16 | $1,198B |
|
||
| Technology | 5 | $198B |
|
||
| Engineering / Construction | 4 | $72B |
|
||
| Energy Services | 3 | $60B |
|
||
| Utilities | 3 | $41B |
|
||
| Healthcare | 2 | $330B |
|
||
Price history
1 event — show timeline
- 2026-02-13 Listed $1,100 HLMLS as distributed by MLS GRID
Cash-flow waterfall
monthlySold comps — $/sqft
last 12 mo · ≤1 miLoading sold comps…