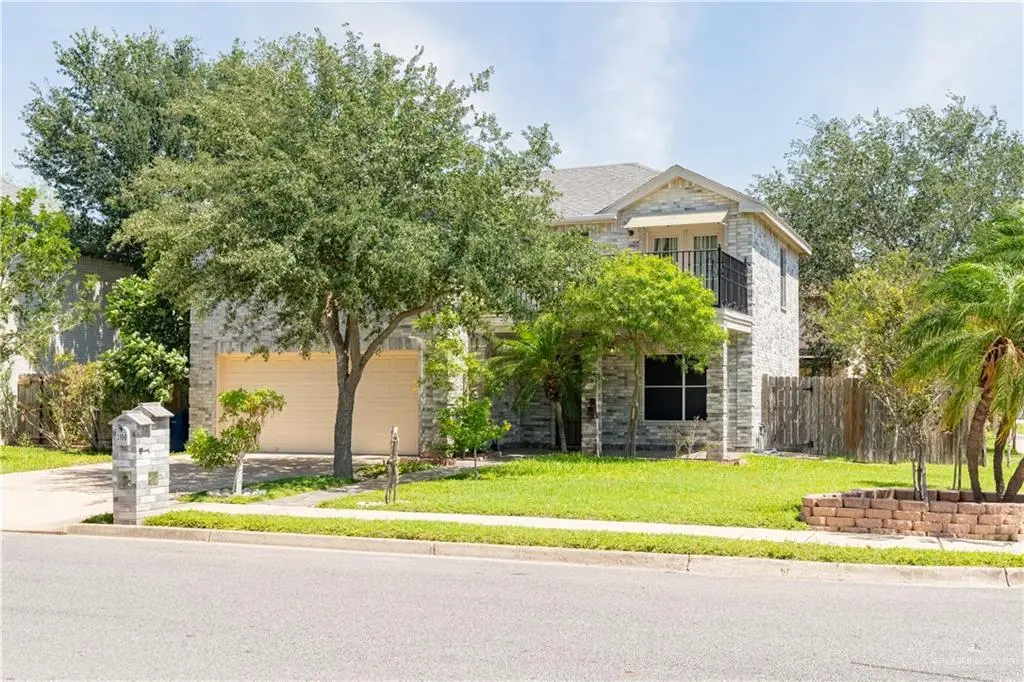
3100 Princeton Ave · McAllen, TX
Flood risk 1/10 · Minimal
- FEMA flood zone
- X
- Chance of flooding over 30 yrs
- 0.0%
- Est. flood insurance / yr
- $507 – $1,088
Fire risk 4/10 · Minor
- Est. fire insurance / yr
- $1,222 – $2,270
Heat risk 9/10 · Severe
- Hot days now (above 111°F)
- 7 days/yr
- Hot days in 30 yrs
- 22 days/yr
Wind risk 8/10 · Major
- Chance of severe wind over 30 yrs
- 99.0%
Air-quality risk 2/10 · Minimal
- Unhealthy air days now
- 0 days/yr
- Unhealthy air days in 30 yrs
- 1 days/yr
Risk factors via First Street. Map © Google.
Why this score? — see what drove the D+ grade
The composite is a weighted blend of 9 inputs, each scored 0–100. Each bar is that input's sub-score; the figure is the points it added to the 100-point composite (weight × sub-score).
- ARV discount +15.0/15.0
- Cash flow +12.7/30.0
- 1% rule +3.9/10.0
- DSCR +3.8/10.0
- Livability +3.8/5.0
- Schools +3.3/10.0
- Rent growth +3.1/5.0
- Condition / age +2.5/5.0
- Appreciation +0.0/10.0
$239,900
🖨 Deal sheet (PDF) 📄 Offer letter ✓ Due diligence
Listing remarks
Bright, spacious, and full of charm—this corner-lot two-story home offers 3 bedrooms, 2.5 baths, and 1,853 sq ft of comfortable living space. Enjoy two living areas, an open-concept layout filled with natural light, and a private upstairs primary suite with its own balcony for relaxing mornings or evenings. Outside, mature lime, orange, and fig trees create your own backyard retreat, while recently replaced A/C units in 2025 add extra peace of mind. Schedule your showing today!
Key facts
- Balcony
- Corner-lot
- Two living areas
Tags
Property features AI
Finance
- Other: Living area source: HidalgoCAD
- HOA & community: No homeowners association; Community sidewalks
Exterior
- Parking: Attached garage (2 cars); 2 covered parking spaces
- Security: Smoke detectors
- Utilities: Public water; City sewer; Cable available; Paved road
- Home design: Corner lot; Paved road access
- Construction: Brick construction; Composition shingle roof; Slab foundation; Built area approximately 1,853 sq ft
- Exterior features: Balcony / deck / porch; Patio; Mature trees; Automatic sprinkler system; Sidewalks; Curb and gutters
Interior
- Kitchen: Electric water heater; Electric smooth-top range / stove
- Bedrooms: Master bedroom with walk-in closet
- Flooring: Carpet; Laminate; Tile
- Bathrooms: 2 full bathrooms; 1 half bathroom
- Heating & cooling: Central heating; Central air conditioning; Thermostat (energy feature)
- Interior features: Granite and other countertops; Ceiling fans; Decorative / high ceilings; Split bedroom floor plan; Walk-in closets; Double-pane energy windows; Drapes
- Laundry & utility: Laundry area with washer/dryer connections
Neighborhood map
What this means for you Summary
Snapshot
- This is a 3-bed/3.0-bath single-family listed at $240k.
Deal economics
- At list price, monthly cash flow is $-26 ($-307/yr) — negative.
- To cash-flow at today's rent, offer at most $235k (1.9% below list).
- To meet the 1% rule (rent ≥ 1% of price), the offer needs to be $213k (11.1% below list).
- Recommended offer: $213k (11.1% below list) — sets the bar for 1% rule.
- Cap rate 6.2% vs local median 3.7% in McAllen — top-decile yield for the area; either an underpriced asset or a hidden risk that comps aren't pricing in. Stress-test before assuming the spread holds.
Location & tenants
- Location reads 76/100 on livability (#119 in TX, #3,771 nationally) — a middle-class / working-renter tenant base. Strengths: cost of living A+, housing A+, health & safety A+; Watch: employment D, amenities F, commute F.
- Mcallen ISD (urban): math 34% / reading 45% proficiency, ranked #440 of 826 in TX (top 53%) — families likely to look elsewhere, expect single-tenant / working-renter base with shorter leases.
- Zoned schools: Blanca E Sanchez (math 42% / reading 42%, grade F, #1,335 of 4,322 statewide, top 33%, 515 students, 61% FRL); Michael E Fossum Middle (math 40% / reading 45%, grade D-, #553 of 1,662 statewide, top 34%, 780 students, 59% FRL); Rowe H S (math 25% / reading 53%, grade F, #859 of 1,632 statewide, top 53%, 1,944 students, 74% FRL).
- Market conditions: Rents rising (+2.6%/yr); 898 active listings in the ZIP; 38 comparable units currently listed for rent nearby; rentals lingering (median 46d on market — plan ~5-8 weeks vacancy on turnover, expect pricing pressure); 53% of comp listings sitting > 30 days — soft ceiling on asking rent; solid renter incomes; 7,378 units permitted in Hidalgo County in 2024 (641 in 5+ unit buildings).
- This rent runs 31% of the median local income ($82k/yr) — at the standard rent-burdened threshold; future hikes will face affordability resistance.
Forward outlook
- Local home prices are declining (-3.0%/yr); year-one equity from $2k of loan paydown is wiped out by about $7k of value loss. Plan a longer hold.
- Hidalgo County population projected at +28% by 2050 — long-run rental-demand tailwind backs the buy-and-hold thesis.
Negotiation context
- It's been on market 33 days — a 3% lower offer ($233k) is reasonable based on typical stale-listing flexibility.
- 5 sale attempts since 2y ago with the ask held roughly flat each time — persistent listings suggest the price (not the market) is what's stuck; bring a comps-based counter.
Risks & watch-outs
- Climate carrying-cost: severe wind risk, 99% chance of damaging wind over 30y; extreme-heat days projected 7→22/yr by 2055 (HVAC capex compounding) — expect insurance premiums to compound above CPI over the hold.
Questions for the listing agent
- What do current leases actually rent for vs. the listed asking? Can we see a recent rent roll and the last 12 months of T-12 income?
- It's been on market 33 days. Have you received any prior offers? Is the seller open to a 11% concession, seller financing, or rate buy-down credit?
- Is there a deadline driving the sale (1031 exchange, divorce, estate, relocation)? That informs how much negotiation room exists.
- Schools are B-rated — typically a magnet for longer-tenancy family renters. What's the average tenant stay here, and is there a school-zone premium baked into asking?
- The area grade is low — what's the realistic commute time and amenity access for the typical tenant pool here? Any planned neighborhood developments (good or bad) we should know about?
- What's the average days-on-market for RENTAL listings here right now (not sales)? A rising rental-DOM trend means longer vacancies and softer asking-rent achievability than the comps imply.
- What's the recent tenant-quality profile in this submarket — average credit score on applications, eviction rate, late-payment / NSF rate, and stable-employment percentage? A property-management company in the area should have these aggregated.
- How much new for-sale + rental construction is in the pipeline within 1–3 miles? Heavy new supply typically softens prices + rents 12–24 months out; constrained supply supports both.
Investment metrics
- 1% rule
- 0.89% ✗
- Cap rate
- 6.17%
- Cash-on-cash
- -0.46%
- DSCR
- 0.98
- GRM
- 9.4
CMA / ARV
- ARV (on-the-fly)
- $329,834
- Comps found
- 12
Show comp detail 12 sales within ~0.75 mi
| Address | Dist | Beds/Ba | Sqft | Sold | Price | $/sf | Match |
|---|---|---|---|---|---|---|---|
| 9101 N 28th St | 0.29mi | 3/2.0 | 1,954 (+6%) | 1mo | $255,000 | $131 | 72 |
| 3317 Kingsborough Ave | 0.37mi | 3/2.0 | 1,778 (-4%) | 1mo | $262,500 | $148 | 71 |
| 9106 N 25th Ln | 0.46mi | 3/2.5 | 1,785 (-4%) | 1mo | $319,000 | $179 | 70 |
| 3600 Notre Dame Ave | 0.29mi | 3/2.5 | 1,718 (-7%) | 4mo | $224,900 | $131 | 69 |
| 9119 N 25th St | 0.47mi | 3/2.5 | 1,768 (-5%) | 0mo | $315,000 | $178 | 68 |
| 3205 Northgate Ln | 0.27mi | 4/2.0 (+1) | 1,716 (-7%) | 1mo | $325,000 | $189 | 66 |
| 2905 Northgate Ln | 0.26mi | 4/2.0 (+1) | 1,978 (+7%) | 4mo | $310,000 | $157 | 64 |
| 2901 Providence Ave | 0.13mi | 4/2.5 (+1) | 2,088 (+13%) | 3mo | $265,000 | $127 | 64 |
| 9102 N 25th Ln | 0.47mi | 4/2.5 (+1) | 1,920 (+4%) | 4mo | $354,000 | $184 | 62 |
| 3501 Harvard Ave | 0.60mi | 4/3.0 (+1) | 1,716 (-7%) | 1mo | $285,000 | $166 | 54 |
| 9904 N 24th St | 0.74mi | 3/2.5 | 2,012 (+9%) | 4mo | $422,500 | $210 | 46 |
| 9903 N 25th Ln | 0.57mi | 4/3.5 (+1) | 2,100 (+13%) | 2mo | $399,000 | $190 | 43 |
Match score weights: distance 35% · size 25% · config 20% · recency 20%. Top-matched comps best support the ARV.
Projected returns pro-forma
-3.0% appreciation · 2.57% rent growth · sell at horizon
- IRR
- -17.5%
- Equity multiple
- 0.38×
- Total profit
- $-41,356
- Equity at exit
- $35,770
- IRR
- -10.4%
- Equity multiple
- 0.38×
- Total profit
- $-41,584
- Equity at exit
- $20,742
Cash invested: $67,172 (down + closing). Projections, not guarantees.
Landlord ↔ Tenant lean methodology
- Overall (STATE)
- 87 Strongly Landlord-Friendly
- State Texas
- 87 Strongly Landlord-Friendly · R+5
- County
- — inherits STATE
- City
- — inherits STATE
ZIP-level market 78504
- Home prices YoY
- -29.4%
- Rents YoY
- 2.6%
- Active inventory
- 898
- Price-to-rent
- 9.4×
Monthly cashflow live
- Estimated rent
- $2,133 high interval (Pro) →
- Mortgage (P&I)
- −$1,258
- Tax from tax record
- −$353 /mo · $4,235/yr
- Insurance
- −$100
- HOA
- −$0
- Vacancy / Maint / Mgmt
- −$448
- Net cashflow
- $-26
Break-even live
Sensitivity live
| Price | -10% $110 | -5% $42 | +0% $-26 | +5% $-93 | +10% $-161 |
|---|---|---|---|---|---|
| Rent | -10% $-194 | -5% $-110 | +0% $-26 | +5% $59 | +10% $143 |
| Rate | -1.0pp $95 | -0.5pp $35 | base $-26 | +0.5pp $-88 | +1.0pp $-151 |
UW: 25.0% down · 7.5% · 30yr · 1.5% tax · 5.0% vac · 8.0% maint · 8.0% mgmt
Financing live
Cash to close
- Down payment
- $59,975
- Closing costs
- $7,197
- Reserves months
- —
- Total cash needed
- —
Loan-product check · same deal, 3 products live
Conventional
25% down · 7.5% · 30yr
- Down + closing
- —
- Monthly P&I
- —
- Monthly cashflow
- —
- DSCR
- —
- Eligible?
- —
Personal DTI + credit; lowest rate.
DSCR
20% down · 8.5% · 30yr
- Down + closing
- —
- Monthly P&I
- —
- Monthly cashflow
- —
- DSCR
- —
- Eligible?
- —
No personal income docs; deal must DSCR.
Hard money
10% down · 12.0% · 12mo
- Down + closing
- —
- Monthly P&I
- —
- Monthly cashflow
- —
- DSCR
- —
- Eligible?
- —
Short-term bridge; refi at stabilization.
Rent comps 38 comps
| Address | Beds | Baths | Sqft | Rent | $/sqft | DOM | Units | Dist |
|---|---|---|---|---|---|---|---|---|
| 3213 Princeton Ave McAllen, TX | 3.0 | 2.5 | 1868 | $1,850 | $0.99 | 16d | 1 | 0.09mi |
| 2920 Providence Ave McAllen, TX | 3.0 | 2.5 | 1848 | $1,600 | $0.87 | 25d | 1 | 0.10mi |
| 2908 Providence Ave McAllen, TX | 3.0 | 2.5 | 1646 | $1,750 | $1.06 | 45d | 1 | 0.14mi |
| 9104 N 28th St McAllen, TX | 3.0 | 2.0 | 1747 | $1,900 | $1.09 | 16d | 1 | 0.30mi |
| 4923 N 35th Ln McAllen, TX | 2.0–4.0 | 2.0–2.5 | 1373 | $2,062 | $1.50 | 16d | 11 | 0.51mi |
| 9807 N 24th Ln McAllen, TX | 4.0 | 3.5 | 2300 | $3,700 | $1.61 | 16d | 1 | 0.63mi |
| 8330 N 34th Ln McAllen, TX | 2.0 | 3.0 | 1458 | $2,250 | $1.54 | 25d | 1 | 0.64mi |
| 9806 N 24th Ln McAllen, TX | 4.0 | 3.5 | 2300 | $3,700 | $1.61 | 45d | 1 | 0.65mi |
| 8406 N 33rd Ln McAllen, TX | 3.0 | 2.0 | 1448 | $2,000 | $1.38 | 16d | 1 | 0.65mi |
| 2809 Grambling Ave McAllen, TX | 3.0 | 2.5 | 2152 | $2,500 | $1.16 | 45d | 1 | 0.66mi |
| 9805 N 24th St McAllen, TX | 4.0 | 3.5 | 2300 | $3,700 | $1.61 | 45d | 1 | 0.68mi |
| 9809 N 24th St McAllen, TX | 4.0 | 3.5 | 2300 | $4,500 | $1.96 | 45d | 1 | 0.68mi |
| 9813 N 24th St McAllen, TX | 4.0 | 3.5 | 2300 | $3,700 | $1.61 | 45d | 1 | 0.69mi |
| 10315 N 26th Ln McAllen, TX | 3.0 | 2.5 | 2124 | $2,300 | $1.08 | 16d | 1 | 0.70mi |
| 2613 Fairmont Ave McAllen, TX | 3.0 | 2.0 | 1735 | $2,000 | $1.15 | 45d | 1 | 0.73mi |
| 3132 Zurich Ave McAllen, TX | 3.0 | 2.0 | 1400 | $1,900 | $1.36 | 21d | 1 | 0.74mi |
| 8101 N 23rd St Unit 27 McAllen, TX | 3.0 | 2.5 | 1600 | $1,900 | $1.19 | 25d | 1 | 0.97mi |
| 8101 N 23rd St Unit 29 McAllen, TX | 3.0 | 2.5 | 1600 | $1,900 | $1.19 | 45d | 1 | 0.97mi |
| 10338 N 23rd Ln McAllen, TX | 4.0 | 3.5 | 2563 | $2,700 | $1.05 | 46d | 1 | 0.98mi |
| 1800 Kingsborough Ave McAllen, TX | 3.0 | 2.0 | 2027 | $2,200 | $1.09 | 25d | 1 | 1.05mi |
| 2909 Fuerte Ave McAllen, TX | 3.0 | 2.0 | 1440 | $1,600 | $1.11 | 45d | 1 | 1.12mi |
| 4012 Auburn Ave McAllen, TX | 3.0 | 2.0 | 1843 | $2,000 | $1.09 | 45d | 1 | 1.12mi |
| 4012 Auburn Ave McAllen, TX | 3.0 | 2.0 | 1843 | $1,900 | $1.03 | 16d | 1 | 1.12mi |
| 3908 Zenker Ave McAllen, TX | 4.0 | 2.5 | 1946 | $3,500 | $1.80 | 45d | 1 | 1.18mi |
| 3200 Guadalupe McAllen, TX | 4.0 | 3.0 | 2136 | $2,800 | $1.31 | 16d | 1 | 1.19mi |
| 2629 Warbler Ave McAllen, TX | 3.0 | 2.5 | 1420 | $2,100 | $1.48 | 45d | 1 | 1.25mi |
| 3601 Warbler Ave McAllen, TX | 3.0 | 2.0 | 1568 | $1,500 | $0.96 | 25d | 1 | 1.34mi |
| 2717 Umbrellabird Ave McAllen, TX | 3.0 | 2.0 | 1521 | $1,695 | $1.11 | 45d | 1 | 1.35mi |
| 7601 N 21st St McAllen, TX | 3.0 | 2.5 | 1888 | $2,600 | $1.38 | 45d | 1 | 1.35mi |
| 10221 N 15th St McAllen, TX | 3.0 | 2.0 | 1418 | $2,200 | $1.55 | 45d | 1 | 1.37mi |
| 1304 Providence Ave McAllen, TX | 3.0 | 2.5 | 2029 | $3,750 | $1.85 | 45d | 1 | 1.39mi |
| 7504 N 21st St McAllen, TX | 3.0 | 2.0 | 1746 | $1,800 | $1.03 | 16d | 1 | 1.39mi |
| 10218 N 15th St McAllen, TX | 3.0 | 2.5 | 1768 | $3,150 | $1.78 | 45d | 1 | 1.40mi |
| 10321 N 15th St McAllen, TX | 3.0 | 2.0 | 1502 | $2,200 | $1.46 | 45d | 1 | 1.41mi |
| 10321 N 15th St McAllen, TX | 3.0 | 2.0 | 1502 | $2,000 | $1.33 | 16d | 1 | 1.41mi |
| 10333 N 15th St McAllen, TX | 3.0 | 2.0 | 1414 | $2,100 | $1.49 | 16d | 1 | 1.41mi |
| 10201 N 14th St McAllen, TX | 2.0 | 2.0 | 1249 | $2,300 | $1.84 | 45d | 1 | 1.42mi |
| 1205 Ozark Ave McAllen, TX | 3.0 | 3.0 | 1955 | $2,800 | $1.43 | 25d | 1 | 1.43mi |
Listing history 26 events
-
2026-06-21days on market $239,900 Active 33 DOM
-
2026-06-18days on market $239,900 Active 30 DOM
-
2026-06-17days on market $239,900 Active 29 DOM
-
2026-06-16days on market $239,900 Active 28 DOM
-
2026-06-15days on market $239,900 Active 27 DOM
-
2026-06-14days on market $239,900 Active 25 DOM
-
2026-06-10days on market $239,900 Active 22 DOM
-
2026-06-09days on market $239,900 Active 21 DOM
-
2026-06-08days on market $239,900 Active 20 DOM
-
2026-06-07days on market $239,900 Active 19 DOM
-
2026-06-05days on market $239,900 Active 16 DOM
-
2026-06-03days on market $239,900 Active 15 DOM
-
2026-06-02days on market $239,900 Active 14 DOM
-
2026-06-01days on market $239,900 Active 13 DOM
-
2026-05-31days on market $239,900 Active 12 DOM
-
2026-05-31days on market $239,900 Active 11 DOM
-
2026-05-19$239,900 Active
-
2026-01-10price $245,000
-
2025-12-15$249,000 Active
-
2025-08-25price $249,900
-
2025-06-09$255,000 Active
-
2024-08-21price $240,000
-
2024-08-17status Active
-
2024-07-21status Pending
-
2024-07-13historical Option
-
2024-07-06$245,000 Active
ⓘ Source: listings_history table (triggers on properties + properties_extension) + one-shot
backfill from property_details.listing_events for pre-trigger history.
Tax reassessment forecast TX · Resets to sale price
- Current annual tax
- $4,235 · $353/mo
- Projected year-2 tax
- $4,390 · $366/mo
- Expected delta
- +$155/yr (+$13/mo · 3.7%)
ⓘ Screening estimate from a state-policy table — verify with the county assessor before closing.
Climate risk First Street
- Flood 1/10 Low FEMA zone X · 0% chance over 30 yrs
- Wildfire 4/10 Moderate
- Heat 9/10 Extreme 7 d/yr ≥111°F today · 22 d/yr by 30 yrs out
- Wind 8/10 Severe 99% chance of damaging wind over 30 yrs
- Air quality 2/10 Low 0 unhealthy d/yr today · 1 by 30 yrs out
Nearby sold comps map
Loading sold comps map…
Walkable amenities ~0.75 mi
Loading nearby amenities…
Taxation est. · year 1
- Rental income
- $25,601
- − Mortgage interest
- −$13,438
- − Property taxes
- −$4,235
- − Insurance
- −$1,200
- − Repairs & maintenance
- −$2,048
- − Management
- −$2,048
- − Depreciation
- −$6,979
- Taxable loss
- −$4,347
- Est. tax savings @ 24.0%
- +$1,043
- After-tax cash flow
- $737/yr
For passive investors: Depreciation is non-cash, so a rental often shows a tax loss while cash-flowing — sheltering income. Rental losses are passive: they offset passive income freely, and up to $25,000/yr can offset ordinary (W-2) income if you actively participate and your MAGI is under $100k (phasing out to $0 by $150k); unused losses carry forward. On sale, claimed depreciation is recaptured at up to 25%, and gains may owe capital-gains tax (a 1031 exchange can defer both). Figures are a year-1 estimate at your 24.0% rate — not tax advice; consult a CPA.
Schools (NCES district)
- District
- Mcallen ISD
- NCES district ID
- 4829670
- Math proficiency
- 34% ▼ -22.00%
- Reading proficiency
- 45% ▼ -5.00%
- Median HH income
- $40,805
- Composite
- 33.16/100
- National rank
- #5551
- State rank
- #440 of 826 in TX
Livability — McAllen
- Score
- 76/100
- State rank
- #119
- US rank
- #3771
Category grades
Schools grade is shown separately in the Schools card above.
Census & demographics
- Census place
- McAllen, TX
- County
- Hidalgo County · 623,128 people
- City population
- 144,650
- Metro
- McAllen-Edinburg-Mission, TX
- Population (ZIP)
- 63,094
- Household income
- $81,905
- Rent vs Own
- Severe rent burden
- 1468.0
Population outlook (Hidalgo County) Hauer SSP2
- Today (2025)
- 955,232 people
- By 2030
- 1,009,774 · +5.7%
- By 2040
- 1,120,332 · +17.3%
- By 2050
- 1,225,036 · +28.2%
- By 2075
- 1,439,189 · +50.7%
- By 2100
- 1,533,429 · +60.5%
Race, ethnicity, and origin ACS 2023
- Neighborhood character
- Predominantly Hispanic (82%)
- Race & ethnicity
- Hispanic / Latino 82% Two or more races 39% White 11% Asian 5%
- Hispanic origin (detail)
- Mexican 75%
- Common ancestry
- Lithuanian 1% Italian 1%
- Foreign-born
- 24% · Canada, South Korea, Vietnam
- Languages at home
- 34% English-only · Spanish 62% Other Asian/Pacific 1% Tagalog/Filipino 1%
Political lean MEDSL · Hidalgo
- 2024 margin
- Toss-up / Even · D 48.1% · R 51.0%
- 2008→2024 swing
- -41.6pp toward R · 2008: 38.7pp · 2024: -2.9pp
- All cycles
- 2024: R+2.9 2020: D+17.1 2016: D+40.5 2012: D+41.8 2008: D+38.7
Not yet ingested
- Civics
- —
Market trends
- HPI YoY
- ▼ -80.87%
- Current HPI
- 194.1764
- Rent YoY
- ▲ 2.57%
- Metro
- McAllen-Edinburg-Mission, TX
- State GDP YoY
- ▲ 3.95%
- F500 in state
- 110
Industry mix (Fortune 500 HQ in TX)
| Industry | F500 HQs | Revenue |
|---|---|---|
| Energy | 16 | $1,198B |
|
||
| Technology | 5 | $198B |
|
||
| Engineering / Construction | 4 | $72B |
|
||
| Energy Services | 3 | $60B |
|
||
| Utilities | 3 | $41B |
|
||
| Healthcare | 2 | $330B |
|
||
Price history
-2.1% since first listed10 events — show timeline
- 2026-05-19 Listed $239,900 MCALLENMLS
- 2026-01-10 Price Changed $245,000 MCALLENMLS
- 2025-12-15 Listed $249,000 MCALLENMLS
- 2025-08-25 Price Changed $249,900 MCALLENMLS
- 2025-06-09 Listed $255,000 MCALLENMLS
- 2024-08-21 Price Changed $240,000 MCALLENMLS
- 2024-08-17 Relisted — MCALLENMLS
- 2024-07-21 Pending — MCALLENMLS
- 2024-07-13 Contingent — MCALLENMLS
- 2024-07-06 Listed $245,000 MCALLENMLS
Property tax history
+4.2%/yrLatest (2025): $4,235 · +7.0% YoY. Source: county tax records.
Cash-flow waterfall
monthlySold comps — $/sqft
last 12 mo · ≤1 miLoading sold comps…