11935 Bayonet Ln #0 · Meadow Oaks, FL
Flood risk 1/10 · Minimal
- FEMA flood zone
- AE
- Chance of flooding over 30 yrs
- 0.0%
- Est. flood insurance / yr
- $1,737 – $8,500
Fire risk 4/10 · Minor
- Est. fire insurance / yr
- $947 – $1,759
Heat risk 10/10 · Severe
- Hot days now (above 108°F)
- 7 days/yr
- Hot days in 30 yrs
- 26 days/yr
Wind risk 10/10 · Severe
- Chance of severe wind over 30 yrs
- 99.0%
Air-quality risk 2/10 · Minimal
- Unhealthy air days now
- 1 days/yr
- Unhealthy air days in 30 yrs
- 3 days/yr
Risk factors via First Street. Map © Google.
Why this score? — see what drove the C- grade
The composite is a weighted blend of 9 inputs, each scored 0–100. Each bar is that input's sub-score; the figure is the points it added to the 100-point composite (weight × sub-score).
- Cash flow +19.4/30.0
- 1% rule +9.6/10.0
- ARV discount +7.5/15.0
- DSCR +6.1/10.0
- Schools +4.3/10.0
- Livability +3.1/5.0
- Condition / age +2.5/5.0
- Rent growth +2.0/5.0
- Appreciation +0.0/10.0
$95,000
🖨 Deal sheet (PDF) 📄 Offer letter ✓ Due diligence
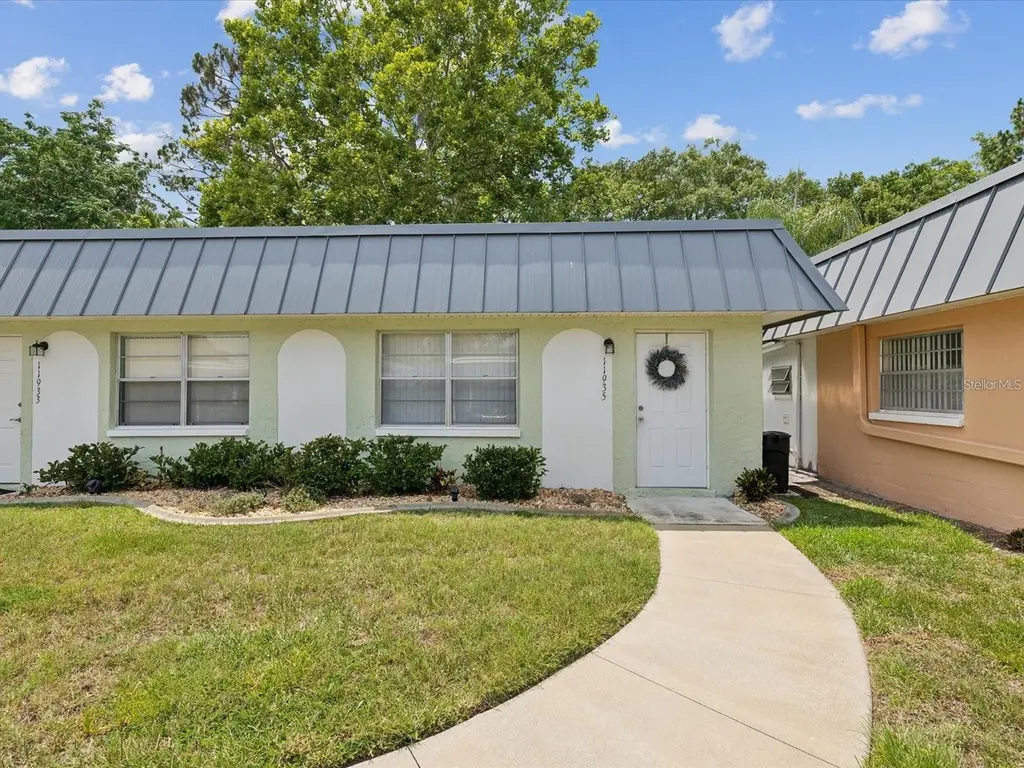
Listing remarks
Very nice unit located in the Paradise Pointe West community of Summertree! Close to the expressway for quick access to Tampa Airport, Downtown Tampa and Clearwater Beach! Close to shopping and restaurants along SR 52 and US19. An active 55+ private golf community with clubhouse, fitness center and pool! Enjoy maintenance free living in this resort style community. Recently added walk-in shower, new hot water heater 2025 and brand new AC completed March 2026.
Key facts
- Fitness center
- Clubhouse
- Pool
Tags
Property features AI
Finance
- Other: Unit is unfurnished; Condo land included
- Financial info: Lease restrictions apply
- HOA & community: Association: Heather (monthly dues; approval required); Clubhouse; Fitness center; Pool; Shuffleboard court; Tennis courts; Association-maintained amenities; Buyer approval required; Association includes cable TV, internet, recreational facilities, sewer; No truck/RV/motorcycle parking; Sidewalks and street lights; Golf access; Senior community; Pets allowed (cats and dogs; limits apply, max pet weight 20 lbs)
Exterior
- Utilities: Public water; Public sewer; Cable connected; Electricity connected; Sewer connected
- Home design: Condominium; Residential property; One story; Faces east; Completed condition; Homestead exempt
- Construction: Block and stucco construction; Membrane roof; Slab foundation; Built on one level
- Exterior features: Sidewalk
Interior
- Kitchen: Range; Refrigerator
- Bedrooms: 1 bedroom
- Bathrooms: 1 full bath; 1 half bath
- Heating & cooling: Central heat; Central air
- Interior features: Ceiling fans
- Laundry & utility: Washer; Dryer; Laundry closet
Neighborhood map
What this means for you Summary
Snapshot
- This is a 1-bed/2.0-bath condo listed at $95k.
Deal economics
- At list price, monthly cash flow is $-321 ($-4k/yr) — negative.
- The deal already cash-flows at list — no discount required.
- Meets the 1% rule at list price ($1k rent vs $95k).
- Cap rate 7.6% vs local median 4.6% in Meadow Oaks — top-decile yield for the area; either an underpriced asset or a hidden risk that comps aren't pricing in. Stress-test before assuming the spread holds.
Location & tenants
- Location reads 61/100 on livability (#794 in FL) — a middle-class / working-renter tenant base. Strengths: crime A+, cost of living A+, housing A+; Watch: schools D-, amenities F, commute F.
- Pasco (suburban): math 50% / reading 52% proficiency, ranked #32 of 73 in FL (top 44%) — acceptable for families but not a draw, mixed tenant base, ~2y average lease.
- Market conditions: Rents soft (-1.9%/yr); 353 active listings in the ZIP; 4 comparable units currently listed for rent nearby; rentals at typical pace (median 21d on market — plan ~3-4 weeks tenant-placement turnaround); 6,765 units permitted in Pasco County in 2024 (1,250 in 5+ unit buildings).
Forward outlook
- Local home prices are declining (-3.0%/yr); year-one equity from $657 of loan paydown is wiped out by about $3k of value loss. Plan a longer hold.
- Pasco County population projected at +29% by 2050 — long-run rental-demand tailwind backs the buy-and-hold thesis.
Negotiation context
- Only 13 days on market — expect competitive offers; lowballing is unlikely to land.
- 5 sale attempts since 2y ago with the ask held roughly flat each time — persistent listings suggest the price (not the market) is what's stuck; bring a comps-based counter.
- Current owner paid $67k; 42% above their basis — modest negotiation headroom, anchor on the comps not their cost.
Risks & watch-outs
- Watch-outs: flood insurance adds $427/mo; HOA is 31% of rent.
- Climate carrying-cost: in FEMA flood zone AE (mandatory federal flood insurance); severe wind risk, 99% chance of damaging wind over 30y; extreme-heat days projected 7→26/yr by 2055 (HVAC capex compounding) — expect insurance premiums to compound above CPI over the hold.
Questions for the listing agent
- What do current leases actually rent for vs. the listed asking? Can we see a recent rent roll and the last 12 months of T-12 income?
- Built in 1975 — when were the roof, HVAC, electrical panel, plumbing, and water heater last replaced?
- What's the actual annual flood-insurance premium (NFIP or private), and is the property in a SFHA with mandatory coverage?
- What does the HOA fee cover, when was the last increase, and are there any pending special assessments or reserve-fund shortfalls?
- Any open or pending special assessments — roof, HVAC, plumbing, elevator, façade? What's the per-unit balance and payoff schedule, and is the seller paying it off at close or rolling it to the buyer?
- Is there a deadline driving the sale (1031 exchange, divorce, estate, relocation)? That informs how much negotiation room exists.
- Schools are D-rated, which usually means shorter tenancies and higher turnover. Who's the typical renter profile here, and what's been the actual vacancy rate?
- What's the average days-on-market for RENTAL listings here right now (not sales)? A rising rental-DOM trend means longer vacancies and softer asking-rent achievability than the comps imply.
- What's the recent tenant-quality profile in this submarket — average credit score on applications, eviction rate, late-payment / NSF rate, and stable-employment percentage? A property-management company in the area should have these aggregated.
- How much new apartment / multifamily construction is in the pipeline within 1–3 miles? Heavy new supply (>2% of stock underway) typically softens rents 12–24 months out; light construction supports rent growth.
Investment metrics
- 1% rule
- 1.46% ✓
- Cap rate
- 7.63%
- Cash-on-cash
- 4.76%
- DSCR
- 1.21
- GRM
- 5.7
CMA / ARV
No comps found within radius.
Projected returns pro-forma
-3.0% appreciation · 0.0% rent growth · sell at horizon
- IRR
- -53.7%
- Equity multiple
- -0.48×
- Total profit
- $-39,426
- Equity at exit
- $14,165
- IRR
- —
- Equity multiple
- -1.80×
- Total profit
- $-74,418
- Equity at exit
- $8,214
Cash invested: $26,600 (down + closing). Projections, not guarantees.
Landlord ↔ Tenant lean methodology
- Overall (STATE)
- 87 Strongly Landlord-Friendly
- State Florida
- 87 Strongly Landlord-Friendly · R+3
- County
- — inherits STATE
- City
- — inherits STATE
ZIP-level market 34654
- Home prices YoY
- -12.7%
- Rents YoY
- -1.9%
- Active inventory
- 353
- Price-to-rent
- 5.7×
Monthly cashflow live
- Estimated rent
- $1,390 medium interval (Pro) →
- Mortgage (P&I)
- −$498
- Tax from tax record
- −$23 /mo · $278/yr
- Insurance
- −$40
- Flood insurance flood zone
- −$427 /mo · $5,118/yr
- HOA est. from 1 same-building comp
- −$432
- Vacancy / Maint / Mgmt
- −$292
- Net cashflow
- $-321
Break-even live
Sensitivity live
| Price | -10% $-267 | -5% $-294 | +0% $-321 | +5% $-348 | +10% $-375 |
|---|---|---|---|---|---|
| Rent | -10% $-431 | -5% $-376 | +0% $-321 | +5% $-266 | +10% $-211 |
| Rate | -1.0pp $-273 | -0.5pp $-297 | base $-321 | +0.5pp $-346 | +1.0pp $-371 |
UW: 25.0% down · 7.5% · 30yr · 1.5% tax · 5.0% vac · 8.0% maint · 8.0% mgmt
Financing live
Cash to close
- Down payment
- $23,750
- Closing costs
- $2,850
- Reserves months
- —
- Total cash needed
- —
Loan-product check · same deal, 3 products live
Conventional
25% down · 7.5% · 30yr
- Down + closing
- —
- Monthly P&I
- —
- Monthly cashflow
- —
- DSCR
- —
- Eligible?
- —
Personal DTI + credit; lowest rate.
DSCR
20% down · 8.5% · 30yr
- Down + closing
- —
- Monthly P&I
- —
- Monthly cashflow
- —
- DSCR
- —
- Eligible?
- —
No personal income docs; deal must DSCR.
Hard money
10% down · 12.0% · 12mo
- Down + closing
- —
- Monthly P&I
- —
- Monthly cashflow
- —
- DSCR
- —
- Eligible?
- —
Short-term bridge; refi at stabilization.
Rent comps 4 comps
| Address | Beds | Baths | Sqft | Rent | $/sqft | DOM | Units | Dist |
|---|---|---|---|---|---|---|---|---|
| 11630 Bayonet Ln New Port Richey, FL | 1.0 | 1.5 | 923 | $1,150 | $1.25 | 20d | 1 | 0.33mi |
| 11105 Pinto Dr Port Richey, FL | 2.0 | 1.0 | 672 | $1,350 | $2.01 | 13d | 1 | 0.96mi |
| 11550 Baywood Meadows Dr #7 New Port Richey, FL | 2.0 | 1.0 | 1008 | $1,495 | $1.48 | 25d | 1 | 1.00mi |
| 12405 Shearwater Dr Unit 12405 New Port Richey, FL | 2.0 | 2.0 | 1000 | $1,600 | $1.60 | 3d | 1 | 1.22mi |
HOA detail condo
- Monthly dues
- $0 · $0/yr
- Likely covers
- waterpoolgym
- Assessments
- None detected in remarks — confirm with the listing agent.
Listing history 9 events
-
2026-06-18days on market $95,000 Active 13 DOM
-
2026-06-17days on market $95,000 Active 12 DOM
-
2026-06-16days on market $95,000 Active 11 DOM
-
2026-06-15days on market $95,000 Active 10 DOM
-
2026-06-13days on market $95,000 Active 8 DOM
-
2026-06-09days on market $95,000 Active 4 DOM
-
2026-06-08days on market $95,000 Active 3 DOM
-
2026-06-07remarks 463-char remark
-
2026-06-07$95,000 Active 2 DOM
ⓘ Source: listings_history table (triggers on properties + properties_extension) + one-shot
backfill from property_details.listing_events for pre-trigger history.
Tax reassessment forecast FL · Resets to sale price
- Current annual tax
- $278 · $23/mo
- Projected year-2 tax
- $788 · $66/mo
- Expected delta
- +$510/yr (+$43/mo · 183.1%)
ⓘ Screening estimate from a state-policy table — verify with the county assessor before closing.
Climate risk First Street
- Flood 1/10 Low FEMA zone AE · 0% chance over 30 yrs
- Wildfire 4/10 Moderate
- Heat 10/10 Extreme 7 d/yr ≥108°F today · 26 d/yr by 30 yrs out
- Wind 10/10 Extreme 99% chance of damaging wind over 30 yrs
- Air quality 2/10 Low 1 unhealthy d/yr today · 3 by 30 yrs out
Nearby sold comps map
Loading sold comps map…
Walkable amenities ~0.75 mi
Loading nearby amenities…
Taxation est. · year 1
- Rental income
- $16,686
- − Mortgage interest
- −$5,321
- − Property taxes
- −$278
- − Insurance
- −$5,594
- − Repairs & maintenance
- −$1,335
- − Management
- −$1,335
- − HOA
- −$5,184
- − Depreciation
- −$2,764
- Taxable loss
- −$5,125
- Est. tax savings @ 24.0%
- +$1,230
- After-tax cash flow
- $-2,622/yr
For passive investors: Depreciation is non-cash, so a rental often shows a tax loss while cash-flowing — sheltering income. Rental losses are passive: they offset passive income freely, and up to $25,000/yr can offset ordinary (W-2) income if you actively participate and your MAGI is under $100k (phasing out to $0 by $150k); unused losses carry forward. On sale, claimed depreciation is recaptured at up to 25%, and gains may owe capital-gains tax (a 1031 exchange can defer both). Figures are a year-1 estimate at your 24.0% rate — not tax advice; consult a CPA.
Schools (NCES district)
- District
- Pasco
- NCES district ID
- 1201530
- Math proficiency
- 50% ▼ -10.00%
- Reading proficiency
- 52% ▼ -5.00%
- Median HH income
- $45,039
- Composite
- 43.14/100
- National rank
- #3074
- State rank
- #32 of 73 in FL
Livability — Meadow Oaks
- Score
- 61/100
- State rank
- #794
- US rank
- #18203
Category grades
Schools grade is shown separately in the Schools card above.
Census & demographics
- County
- Pasco County · 524,098 people
- Metro
- Tampa-St. Petersburg-Clearwater, FL
- Population (ZIP)
- 24,355
- Household income
- $73,947
- Rent vs Own
- Severe rent burden
- 179.0
Population outlook (Pasco County) Hauer SSP2
- Today (2025)
- 570,045 people
- By 2030
- 605,844 · +6.3%
- By 2040
- 674,806 · +18.4%
- By 2050
- 736,022 · +29.1%
- By 2075
- 862,900 · +51.4%
- By 2100
- 906,364 · +59.0%
Race, ethnicity, and origin ACS 2023
- Neighborhood character
- Predominantly White (81%)
- Race & ethnicity
- White 81% Hispanic / Latino 10% Two or more races 7% Black 3% Asian 2%
- Hispanic origin (detail)
- Puerto Rican 6%
- Common ancestry
- Romanian 4% Slovak 2% Italian 2%
- Foreign-born
- 7% · Canada, China, Jamaica
- Languages at home
- 88% English-only · Spanish 5% Russian/Polish/Slavic 2% Other Indo-European 1%
Political lean MEDSL · Pasco
- 2024 margin
- Strong R (+25.2) · D 36.9% · R 62.1% · Other 1.0%
- 2008→2024 swing
- -21.6pp toward R · 2008: -3.6pp · 2024: -25.2pp
- All cycles
- 2024: R+25.2 2020: R+20.1 2016: R+21.6 2012: R+6.7 2008: R+3.6
Not yet ingested
- Civics
- —
Market trends
- HPI YoY
- ▼ -42.63%
- Current HPI
- 294.4358
- Rent YoY
- ▼ -1.85%
- Metro
- Tampa-St. Petersburg-Clearwater, FL
- State GDP YoY
- ▲ 3.28%
- F500 in state
- 36
Industry mix (Fortune 500 HQ in FL)
| Industry | F500 HQs | Revenue |
|---|---|---|
| Industrial Technology | 2 | $29B |
|
||
| Insurance | 2 | $17B |
|
||
| Retail | 1 | $60B |
|
||
| Technology Distribution | 1 | $58B |
|
||
| Homebuilding | 1 | $35B |
|
||
| Technology Manufacturing | 1 | $35B |
|
||
Price history
+238.1% since first listed19 events — show timeline
- 2026-06-05 Listed $95,000 Stellar MLS as Distributed by MLS Grid
- 2026-03-31 Listing Removed — Stellar MLS as Distributed by MLS Grid
- 2025-10-22 Price Changed $95,000 Stellar MLS as Distributed by MLS Grid
- 2025-07-14 Price Changed $100,000 Stellar MLS as Distributed by MLS Grid
- 2025-07-14 Relisted — Stellar MLS as Distributed by MLS Grid
- 2025-06-20 Pending — Stellar MLS as Distributed by MLS Grid
- 2025-04-16 Price Changed $105,000 Stellar MLS as Distributed by MLS Grid
- 2025-03-12 Price Changed $110,000 Stellar MLS as Distributed by MLS Grid
- 2025-03-11 Price Changed $105,000 Stellar MLS as Distributed by MLS Grid
- 2025-01-31 Relisted — Stellar MLS as Distributed by MLS Grid
- 2025-01-30 Listing Removed — Stellar MLS as Distributed by MLS Grid
- 2024-12-09 Price Changed $120,000 Stellar MLS as Distributed by MLS Grid
- 2024-11-19 Price Changed $125,000 Stellar MLS as Distributed by MLS Grid
- 2024-06-23 Price Changed $130,000 Stellar MLS as Distributed by MLS Grid
- 2024-05-20 Relisted — Stellar MLS as Distributed by MLS Grid
- 2024-03-27 Listed $135,000 Stellar MLS as Distributed by MLS Grid
- 2021-06-28 Sold (Public Records) $67,000 Public Records
- 2017-06-01 Sold (Public Records) $25,000 Public Records
- 1999-10-26 Sold (Public Records) $28,100 Public Records
Property tax history
-1.7%/yrLatest (2025): $278 · +8.4% YoY. Source: county tax records.
Cash-flow waterfall
monthlySold comps — $/sqft
last 12 mo · ≤1 miLoading sold comps…